Midland Office Building For
For Sale
Contact for pricing
404 Veterans Airpark Ln, Midland, TX 79705
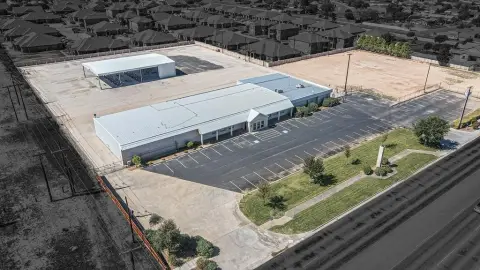
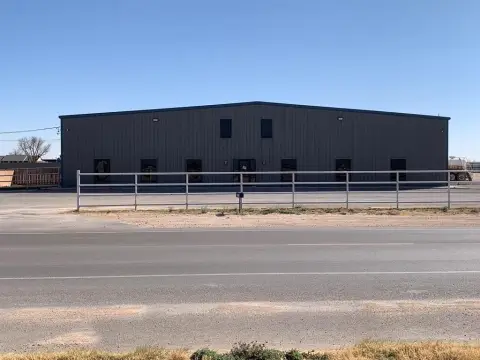
42,165 SF office building in Midland, TX for sale.
Property Size42,165 SF
Lot Size3.06 Acres
Price / SF$225.31
Days on Market247
Property Features for 404 Veterans Airpark Ln
General Information
Standard status
Active
Size
42,165 SF
Class
A
Lot size
3.06 Acres
Property subtype
Office
Zoning
Commercial
Building Details
Year Built
2019
Stories
3
Listing Agency:
Moriah Real Estate Company, LLC
Listed By:
Trey Dennis · License #TX 723150
(432) 682-2510
Source:
Crexi
Added: Feb 11
Changed: Oct 11
Last Checked: Oct 14 at 8:35PM
Displayed information is deemed reliable but is not guaranteed and should be independently verified. All listing content including descriptions, pricing, images are the copyrighted material of Moriah Real Estate Company, LLC

Ask AI about this property
Review the available facts, identify missing information and prepare questions for the agent.
Investment Insights
Based on property information with market context.
This 42,165-square-foot office building in Midland, TX, presents an exceptional commercial investment opportunity. The property is strategically located within a commercially zoned area, offering strong potential for investors. The building's generous square footage and flexible floor plans make it ideally suited for a variety of office configurations. Positioned in the heart of Midland, it provides outstanding visibility and convenient access, making it an attractive location for businesses. Its substantial size and prime zoning create opportunities for a wide range of commercial uses. The property is located near N Big Spring St on Veterans Airpark Ln and sits just north of the Claydesta Plaza Business Park within a mile of Loop 250. The property is a stand-alone building on 3.06 acres. Surrounding businesses include ExxonMobil and Apache Corporation.
Key Highlights
- Expansive 42,165 sq ft office building.
- Prime location in the heart of Midland, TX.
- Strategically located within a commercially zoned area.
Financial Insights
Estimated NOI and Cap Rate
NOI / Yr
$510,028
Cap Rate
5.37%
Suggested Prices Based on Cap Rates
Cap Rate 5%
$10,200,560
$10.2M
Cap Rate 7%
$7,286,114
$7.3M
Cap Rate 9%
$5,666,978
$5.7M
Market Conditions
NOI Build-Up for 42,165 SF
Gross rent
$809.6K $19.20/SF
− Vacancy
−$129.5K −$3.07/SF
EGI
$680.0K $16.13/SF
− OpEx
−$170.0K −$4.03/SF
NOI
$510.0K $12.10/SF
Area
Midland, TX
Vacancy
16.00%
Lease Rate
$19.20 /SF/Yr
Expense Ratio
25.00%
Simulate Cap Rate and NOI
Suggested Prices Based on Cap Rates
Cap Rate 5%
$10,200,560
Cap Rate 7%
$7,286,114
Cap Rate 9%
$5,666,978
Alternative Uses
Best Use
Office B
$7.29M
$6.38M – $8.50M
NOI $510,028 @ 7.0% cap · market cap 5.37%
Second Best
—
—
no second resolved use
Theoretical Best
Office A
$9.95M
$8.70M – $11.60M
NOI $696,228 @ 7.0% cap · market cap 7.33%
Zoning and permitted uses should be independently verified with authorities.
How Realmo checks its estimates
Property Analytics
Unlock full access to Insights
Subscribe to Realmo Intelligence
Open Analytics
Current Use
Location Intelligence
Trade Area within ½ mile
849
Businesses Nearby
Explore this area
Business Placement
Demographics for 79705, TX
44,138
Population
20,021
Households
2.2
Avg Household Size
33
Median Age
40%
College-Educated
91%
High-School Grad
79.4 sq mi
ZIP Area
556
Density / Sq Mi
$105,106
Median Household Income
$60,415
Median Earnings
$1,431
Median Rent
$329,300
Median Home Value
Check the figures for this property
Cap Rate, Value Estimation, Potential NOI and more
View Realmo Analytics
Market
Vacancy Rate% for Office in South region






Frequently Asked Questions
What type of property is this?
Office building - 42,165 SF office building in Midland, TX for sale.
Where is this office building located?
The property is located at 404 Veterans Airpark Ln Midland, TX.
What is the asking price?
The asking price for this property is $9,500,000.
What are key features of this property?
This property features: Expansive 42,165 sq ft office building.; Prime location in the heart of Midland, TX.; Strategically located within a commercially zoned area.


