Beachside Duplex with Separate
For Sale
$575,000
404 34th Ave. S, North Myrtle Beach, SC 29582
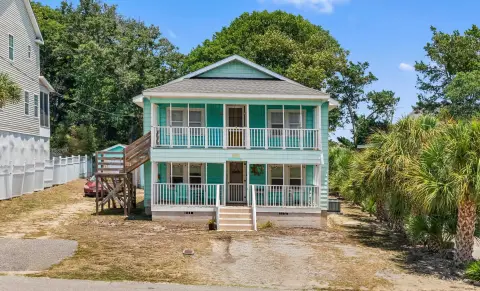
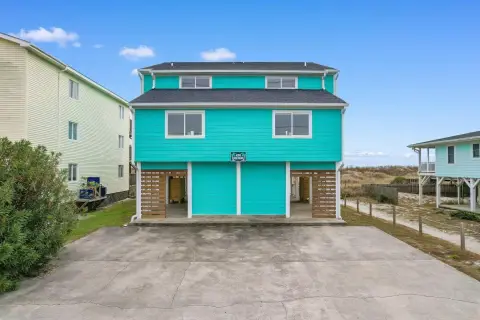
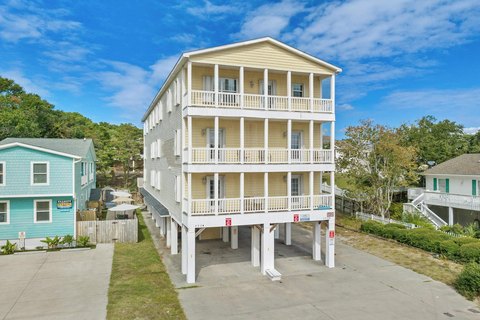
Two private residential levels offer flexible ownership, guest, and rental-use options near Crescent Beach.
Property Size1,742 SF
Price / SF$330.08
Days on Market66
Property Features for 404 34th Ave. S
General Information
Standard status
Active
Size
1,742 SF
Property subtype
Multi-Family
Additional Details
Multifamily Units
2
Amenities
washer and dryer
patio with gas grill
Building Details
Year Built
1956
Buildings
1
Listing Agency:
RE/MAX Southern Shores Nmb
(843) 603-1439
Listed By:
Seth June
(843) 848-3088
Source:
Shjune
Added: Aug 12
Changed: Oct 15
Last Checked: Oct 14 at 11:19PM
Displayed information is deemed reliable but is not guaranteed and should be independently verified. All listing content including descriptions, pricing, images are the copyrighted material of RE/MAX Southern Shores Nmb

Ask AI about this property
Review the available facts, identify missing information and prepare questions for the agent.
Investment Insights
Based on property information with market context.
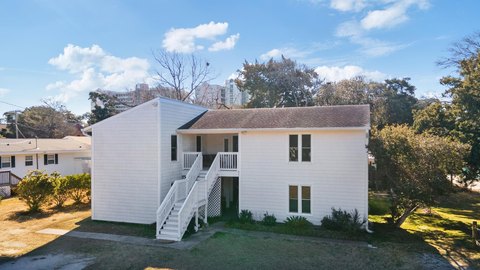
This 1,742 SF duplex at 404 34th Ave. S includes two independently accessed levels, each with 2 bedrooms, 2 full baths, and its own washer and dryer. The 1956 property has updated bathrooms, newer appliances, modern finishes, upgraded lower-level cabinetry, and granite countertops. A metal roof was installed in 2017, and both HVAC systems were replaced in December 2023.
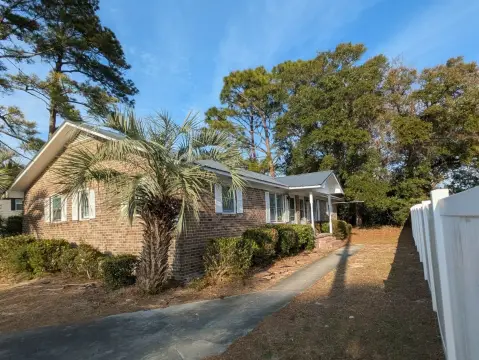
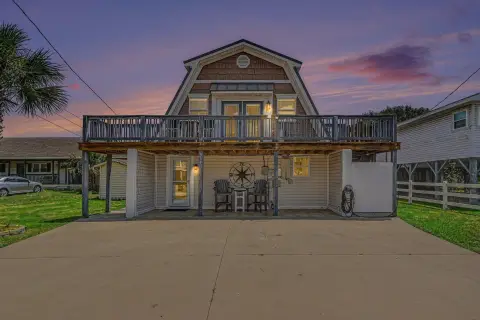
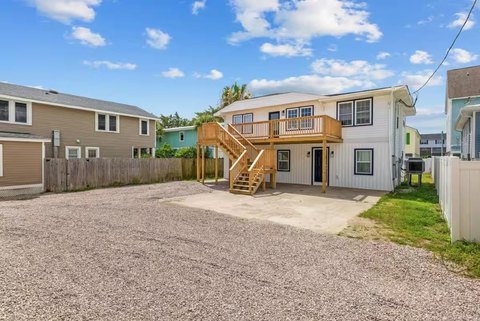
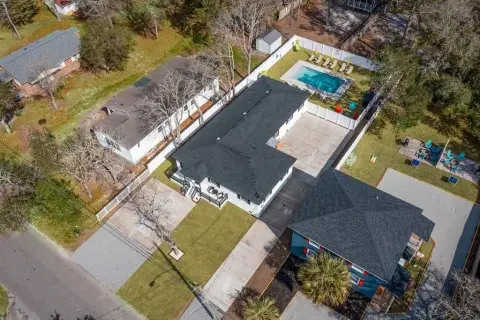
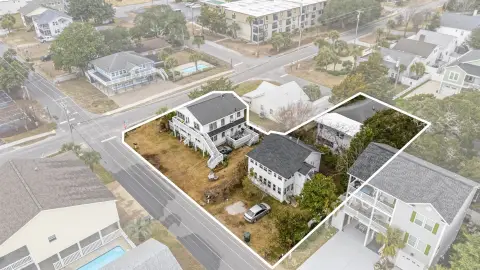
The home is approximately 100 steps from the beach in Crescent Beach, with separate entrances positioned on opposite sides of the residence. The property sits on an oversized lot outside a flood zone and has no HOA. The upper unit is furnished and features large living room windows, designer window treatments, and a furnished patio with a gas grill.
The home is approximately 100 steps from the beach in Crescent Beach, with separate entrances positioned on opposite sides of the residence. The property sits on an oversized lot outside a flood zone and has no HOA. The upper unit is furnished and features large living room windows, designer window treatments, and a furnished patio with a gas grill.
Key Highlights
- Approximately 100 steps from the beach in Crescent Beach
- Duplex with 2 bedrooms and 2 full baths on each level
- 1,742 SF property on an oversized lot outside a flood zone
Financial Insights
Estimated NOI and Cap Rate
NOI / Yr
$17,793
Cap Rate
3.09%
Suggested Prices Based on Cap Rates
Cap Rate 5%
$355,860
$355.9K
Cap Rate 7%
$254,186
$254.2K
Cap Rate 9%
$197,700
$197.7K
Market Conditions
NOI Build-Up for 1,742 SF
Gross rent
$26.8K $15.36/SF
− Vacancy
−$1.3K −$0.77/SF
EGI
$25.4K $14.59/SF
− OpEx
−$7.6K −$4.38/SF
NOI
$17.8K $10.21/SF
Area
Horry County, SC
Vacancy
5.00%
Lease Rate
$15.36 /SF/Yr
Expense Ratio
30.00%
Simulate Cap Rate and NOI
Suggested Prices Based on Cap Rates
Cap Rate 5%
$355,860
Cap Rate 7%
$254,186
Cap Rate 9%
$197,700
Alternative Uses
Best Use
Multifamily LT 5
$254.2K
$222.4K – $296.6K
NOI $17,793 @ 7.0% cap · market cap 3.09%
Second Best
Apartment 5plus
$229.7K
$201.0K – $268.0K
NOI $16,081 @ 7.0% cap · market cap 2.80%
Theoretical Best
Office A
$441.5K
$386.3K – $515.1K
NOI $30,904 @ 7.0% cap · market cap 5.37%
Zoning and permitted uses should be independently verified with authorities.
How Realmo checks its estimates
Property Analytics
Unlock full access to Insights
Subscribe to Realmo Intelligence
Open Analytics
Current Use
Lease Details
2
Residential units
Location Intelligence
Trade Area within ½ mile
329
Businesses Nearby
Explore this area
Business Placement
Demographics for 29582, SC
18,897
Population
27,559
Households
0.7
Avg Household Size
62
Median Age
38%
College-Educated
94%
High-School Grad
21.9 sq mi
ZIP Area
863
Density / Sq Mi
$71,030
Median Household Income
$36,906
Median Earnings
$1,194
Median Rent
$370,700
Median Home Value
Check the figures for this property
Cap Rate, Value Estimation, Potential NOI and more
View Realmo Analytics
Market
Vacancy Rate% for Multifamily in South region


Frequently Asked Questions
What type of property is this?
Duplex - Two private residential levels offer flexible ownership, guest, and rental-use options near Crescent Beach.
Where is this duplex located?
The property is located at 404 34th Ave. S North Myrtle Beach, SC.
What is the asking price?
The asking price for this property is $575,000.
What are key features of this property?
This property features: Approximately 100 steps from the beach in Crescent Beach; Duplex with 2 bedrooms and 2 full baths on each level; 1,742 SF property on an oversized lot outside a flood zone


