Mixed-Use Retail Building
For Sale
$2,850,000
4021-23-25 Market St and 4024-26 Filbert St, Philadelphia, PA 19104
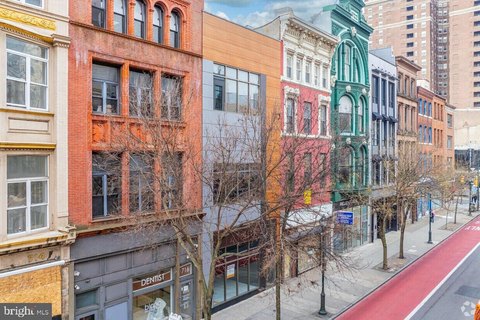
Three interconnected two-story retail buildings with basements and rear loading off Filbert Street.
Property Size22,192 SF
Days on Market125
Property Features for 4021-23-25 Market St and 4024-26 Filbert St
General Information
Standard status
Active
Size
22,192 SF
Property subtype
Retail
Site & Location
Neighborhood
West Powelton
Building Details
Building Size
22,192 SF
Year Built
1915
Listing Agency:
Mallin Panchelli Nadel Realty Inc
Listed By:
Veronica Blum · License #RS290724
(267) 238-1728
Source:
Mpnrealty
Added: Jun 24
Changed: Oct 25
Last Checked: Oct 24 at 3:11PM
Displayed information is deemed reliable but is not guaranteed and should be independently verified. All listing content including descriptions, pricing, images are the copyrighted material of Mallin Panchelli Nadel Realty Inc

Ask AI about this property
Review the available facts, identify missing information and prepare questions for the agent.
Investment Insights
Based on property information with market context.
The offering includes three parcels comprising interconnected two-story retail buildings with basements. Multiple stairwells and doorway openings connect the structures, and the space features large open floor plans with high ceilings.
On the Market Street side, the parcels provide approximately 60 feet of frontage and extend from Market Street to Filbert Street, with garage access in the rear. The Filbert Street parcel runs about half the length of the block toward Market Street and offers rear loading off Filbert Street.
Additional amenities include a large basement and a wide staircase. The property is one block from SEPTA transportation and is described as transit-oriented, with walking access to UPenn and Drexel University and proximity to the Market Frankford Line.
On the Market Street side, the parcels provide approximately 60 feet of frontage and extend from Market Street to Filbert Street, with garage access in the rear. The Filbert Street parcel runs about half the length of the block toward Market Street and offers rear loading off Filbert Street.
Additional amenities include a large basement and a wide staircase. The property is one block from SEPTA transportation and is described as transit-oriented, with walking access to UPenn and Drexel University and proximity to the Market Frankford Line.
Key Highlights
- Three interconnected two‑story retail buildings with basements built in 1915
- Market Street parcels offer 60 ft of frontage and stretch from Market to Filbert, with rear garage access
- Filbert Street portion runs about half the length of the block toward Market Street
Financial Insights
Estimated NOI and Cap Rate
NOI / Yr
$250,818
Cap Rate
8.80%
Suggested Prices Based on Cap Rates
Cap Rate 5%
$5,016,360
$5.0M
Cap Rate 7%
$3,583,114
$3.6M
Cap Rate 9%
$2,786,867
$2.8M
Market Conditions
NOI Build-Up for 22,192 SF
Gross rent
$399.5K $18.00/SF
− Vacancy
−$41.1K −$1.85/SF
EGI
$358.3K $16.15/SF
− OpEx
−$107.5K −$4.84/SF
NOI
$250.8K $11.30/SF
Area
Philadelphia, PA
Vacancy
10.30%
Lease Rate
$18.00 /SF/Yr
Expense Ratio
30.00%
Simulate Cap Rate and NOI
Suggested Prices Based on Cap Rates
Cap Rate 5%
$5,016,360
Cap Rate 7%
$3,583,114
Cap Rate 9%
$2,786,867
Alternative Uses
Best Use
Retail
$3.58M
$3.14M – $4.18M
NOI $250,818 @ 7.0% cap · market cap 8.80%
Second Best
—
—
no second resolved use
Theoretical Best
Multifamily LT 5
$5.41M
$4.73M – $6.31M
NOI $378,704 @ 7.0% cap · market cap 13.29%
Zoning and permitted uses should be independently verified with authorities.
How Realmo checks its estimates
Property Analytics
Current Use
Location Intelligence
Trade Area within ½ mile
7,610
Businesses Nearby
151k
Monthly Visits Nearby
Explore this area
Business Placement
Foot Traffic Nearby
Dining 55%
Shops & Services 30%
Hotels & Casinos 10%
Groceries 5%
McDonald's
Dining
26,974 visits/mo
0.2 miles
Wawa
Shops & Services
21,359 visits/mo
0.5 miles
Raising Cane's Chicken Fingers
Dining
15,022 visits/mo
0.3 miles
Checkers
Dining
13,397 visits/mo
0.4 miles
Dunkin' Donuts
Dining
11,056 visits/mo
0.4 miles
Demographics for 19104, PA
56,839
Population
23,888
Households
2.4
Avg Household Size
26
Median Age
47%
College-Educated
90%
High-School Grad
3.1 sq mi
ZIP Area
18,335
Density / Sq Mi
$39,526
Median Household Income
$18,420
Median Earnings
$1,329
Median Rent
$268,200
Median Home Value
Market
Vacancy Rate% for Retail in Philadelphia, PA




Frequently Asked Questions
What type of property is this?
Retail space - Three interconnected two-story retail buildings with basements and rear loading off Filbert Street.
Where is this retail space located?
The property is located at 4021-23-25 Market St and 4024-26 Filbert St Philadelphia, PA.
What is the asking price?
The asking price for this property is $2,850,000.
What are key features of this property?
This property features: Three interconnected two‑story retail buildings with basements built in 1915; Market Street parcels offer 60 ft of frontage and stretch from Market to Filbert, with rear garage access; Filbert Street portion runs about half the length of the block toward Market Street