Multi-Building Industrial
For Sale
$5,200,000
4018 E Linden St, Caldwell, ID 83605
Three-building industrial property offered for sale with 100% occupancy.
Property Size28,000 SF
Price / SF$185.71
Days on Market98
Property Features for 4018 E Linden St
General Information
Standard status
Active
Size
28,000 SF
Occupancy
100%
Additional Details
Cap Rate
6.5%
Building Details
Year Built
2022
Listing Agency:
Coldwell Banker Tomlinson
Listed By:
Rick Mcgraw · License #AB17400
(208) 880-8889
Source:
Debbiemarcotterealestate
Added: Jul 18
Changed: Oct 6
Last Checked: Oct 7 at 1:33PM
Displayed information is deemed reliable but is not guaranteed and should be independently verified. All listing content including descriptions, pricing, images are the copyrighted material of Coldwell Banker Tomlinson

Ask AI about this property
Review the available facts, identify missing information and prepare questions for the agent.
Investment Insights
Based on property information with market context.
This three-building industrial investment property is offered for sale as part of a 100% occupied portfolio. The offering consists of multiple industrial buildings totaling approximately 28,000 square feet, positioned to provide steady tenant occupancy under current leases.
The property is located at 4018 E Linden St in Caldwell, Idaho.
The seller’s materials indicate a 6.5% cap rate and full occupancy at the time of listing.
The property is located at 4018 E Linden St in Caldwell, Idaho.
The seller’s materials indicate a 6.5% cap rate and full occupancy at the time of listing.
Key Highlights
- Three‑building industrial investment property
- Year built: 2022
- 100% occupied
Financial Insights
Estimated NOI and Cap Rate
NOI / Yr
$289,384
Cap Rate
5.57%
Suggested Prices Based on Cap Rates
Cap Rate 5%
$5,787,680
$5.8M
Cap Rate 7%
$4,134,057
$4.1M
Cap Rate 9%
$3,215,378
$3.2M
Market Conditions
NOI Build-Up for 28,000 SF
Gross rent
$352.8K $12.60/SF
− Vacancy
−$12.3K −$0.44/SF
EGI
$340.5K $12.16/SF
− OpEx
−$51.1K −$1.82/SF
NOI
$289.4K $10.34/SF
Area
Canyon County, ID
Vacancy
3.50%
Lease Rate
$12.60 /SF/Yr
Expense Ratio
15.00%
Simulate Cap Rate and NOI
Suggested Prices Based on Cap Rates
Cap Rate 5%
$5,787,680
Cap Rate 7%
$4,134,057
Cap Rate 9%
$3,215,378
Alternative Uses
Best Use
Warehouse
$4.13M
$3.62M – $4.82M
NOI $289,384 @ 7.0% cap · market cap 5.57%
Second Best
—
—
no second resolved use
Theoretical Best
Office A
$7.46M
$6.53M – $8.70M
NOI $522,050 @ 7.0% cap · market cap 10.04%
Zoning and permitted uses should be independently verified with authorities.
How Realmo checks its estimates
Property Analytics
Unlock full access to Insights
Subscribe to Realmo Intelligence
Open Analytics
Current Use
Lease Details
100%
Occupancy
Location Intelligence
Trade Area within ½ mile
268
Businesses Nearby
Well-served
Demand for This Use
Explore this area
Business Placement
Demographics for 83605, ID
38,561
Population
14,197
Households
2.7
Avg Household Size
32
Median Age
14%
College-Educated
80%
High-School Grad
24.6 sq mi
ZIP Area
1,568
Density / Sq Mi
$60,657
Median Household Income
$31,806
Median Earnings
$973
Median Rent
$300,900
Median Home Value
Check the figures for this property
Cap Rate, Value Estimation, Potential NOI and more
View Realmo Analytics
Market
Vacancy Rate% for Industrial in West region
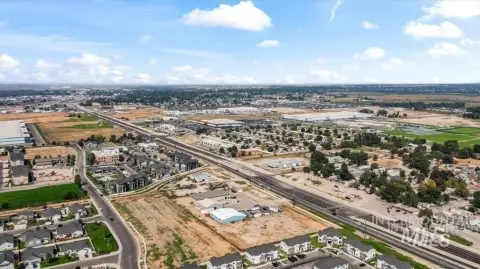


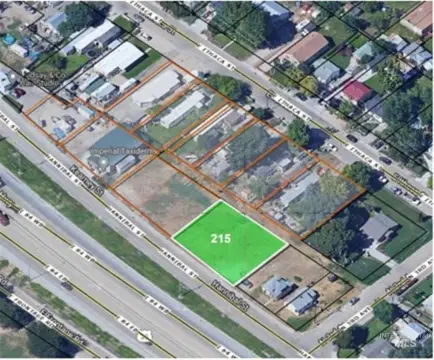


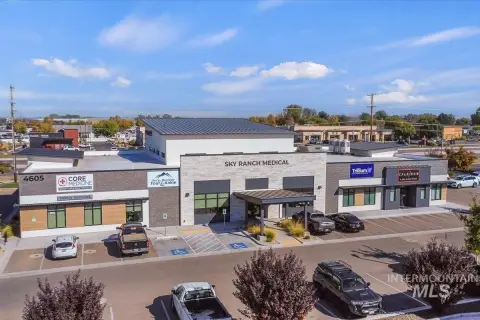


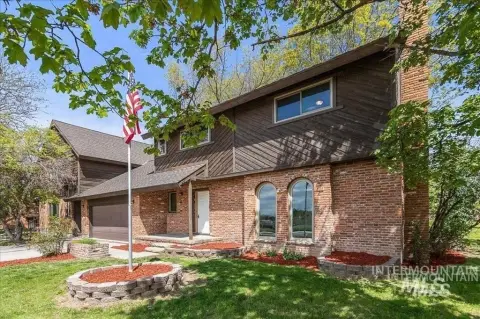
Similar Off Market Nearby
- Storage West — 4224 Dearborn St, Caldwell, ID 83605
- A.S.A.P. Mini Storage, LLC — 249 Loop St, Caldwell, ID 83605
- Republic Storage — 3202 Cleveland Blvd, Caldwell, ID 83605
- Republic Storage Linden — 3203 E Linden St, Caldwell, ID 83605
- Iron Mountain — 1701 Smeed Pkwy Suite 101, Caldwell, ID 83605
Frequently Asked Questions
What type of property is this?
Warehouse - Three-building industrial property offered for sale with 100% occupancy.
Where is this warehouse located?
The property is located at 4018 E Linden St Caldwell, ID.
What is the asking price?
The asking price for this property is $5,200,000.
What are key features of this property?
This property features: Three‑building industrial investment property; Year built: 2022; 100% occupied


