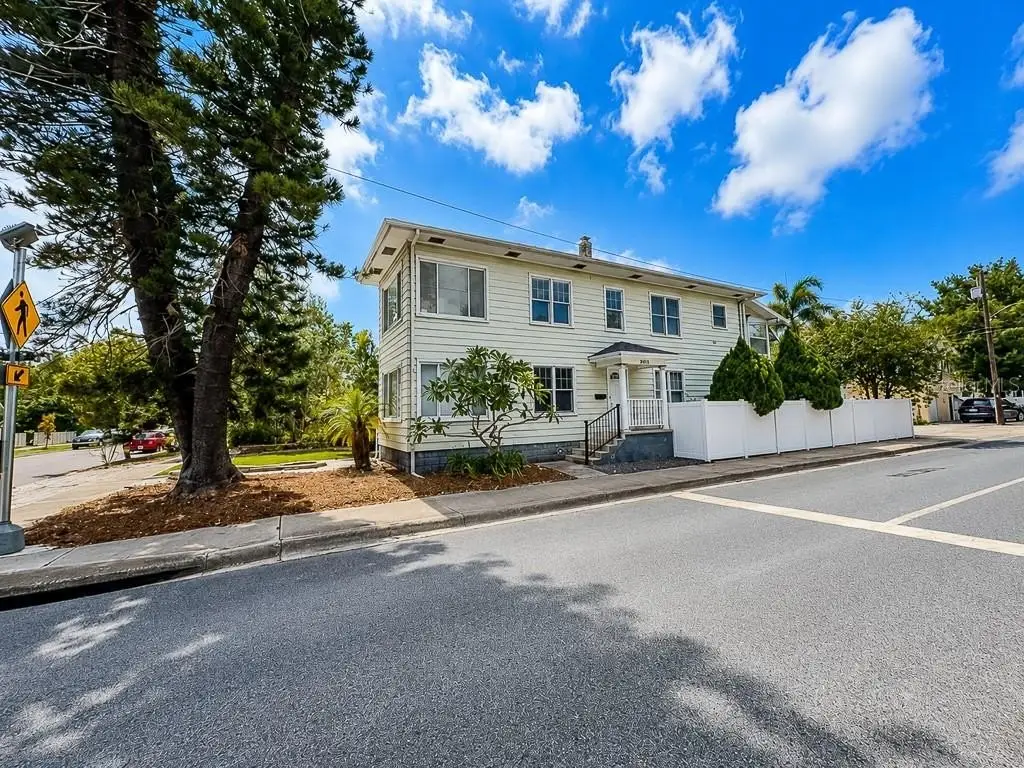
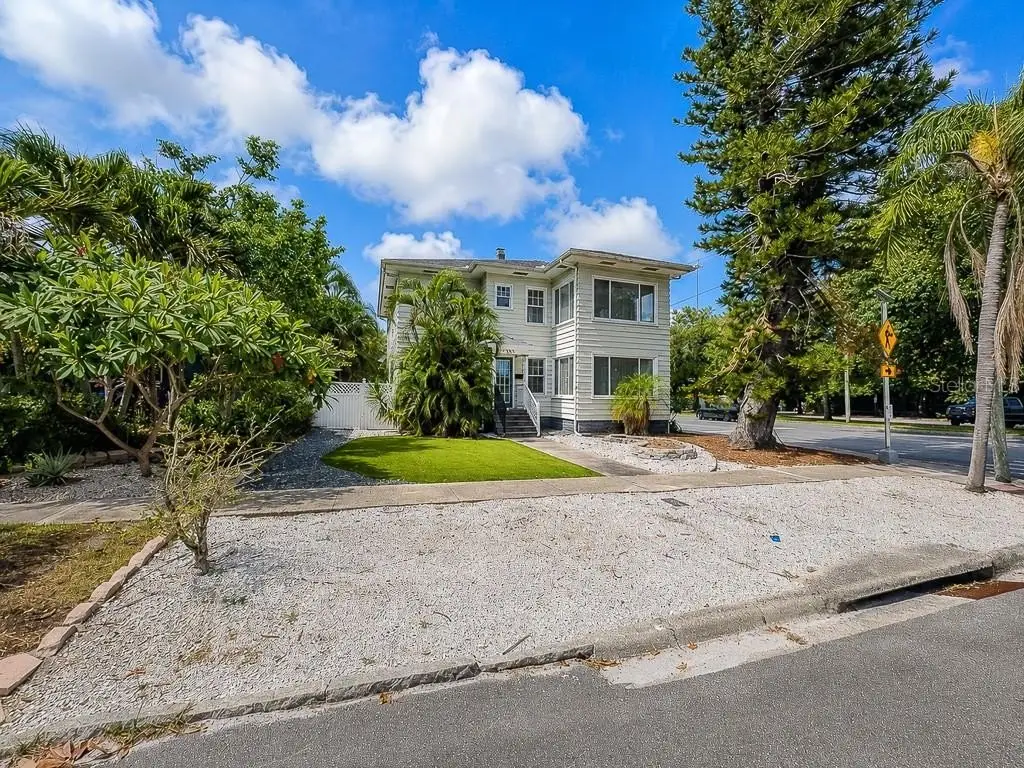
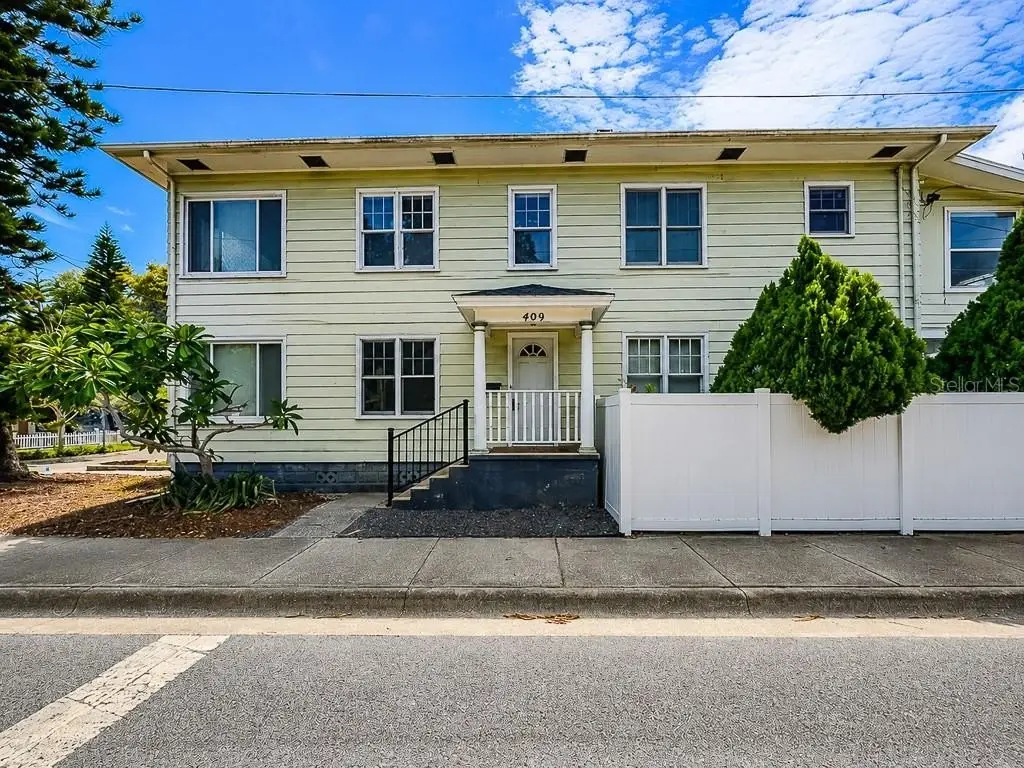
Updated Two-Unit
For Sale
$699,900
400 20TH Street N, St Petersburg, FL 33713
Residential Income, ST PETERSBURG, FL
Property Size2,688 SF
Lot Size0.15 Acres
Price / SF$260.38
Days on Market96
Property Features for 400 20TH Street N
General Information
Property type
Residential Multi Family
Property subtype
Duplex
Bedrooms
4
Bathrooms
2
Full bathrooms
2
Rooms
Bedroom 4, Bedroom 1, Bedroom 2, Bathroom 1, Bathroom 2, Bedroom 3
Parking features
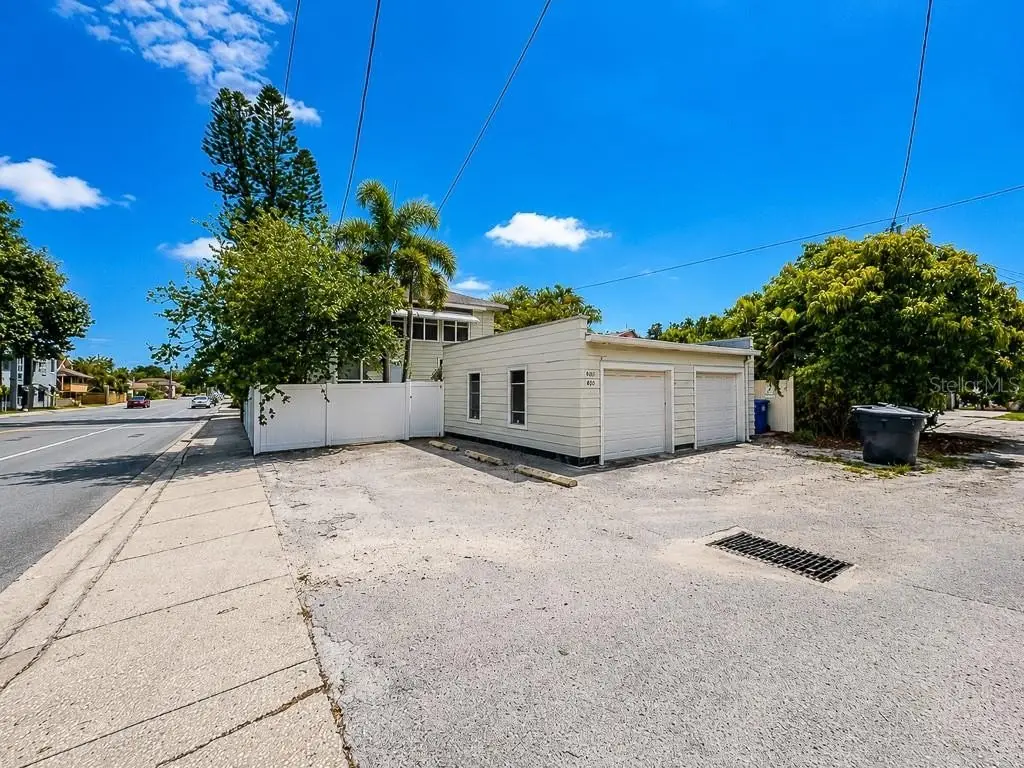
Open, On Street, Off Street, Garage, Guest
Patio and Porch features
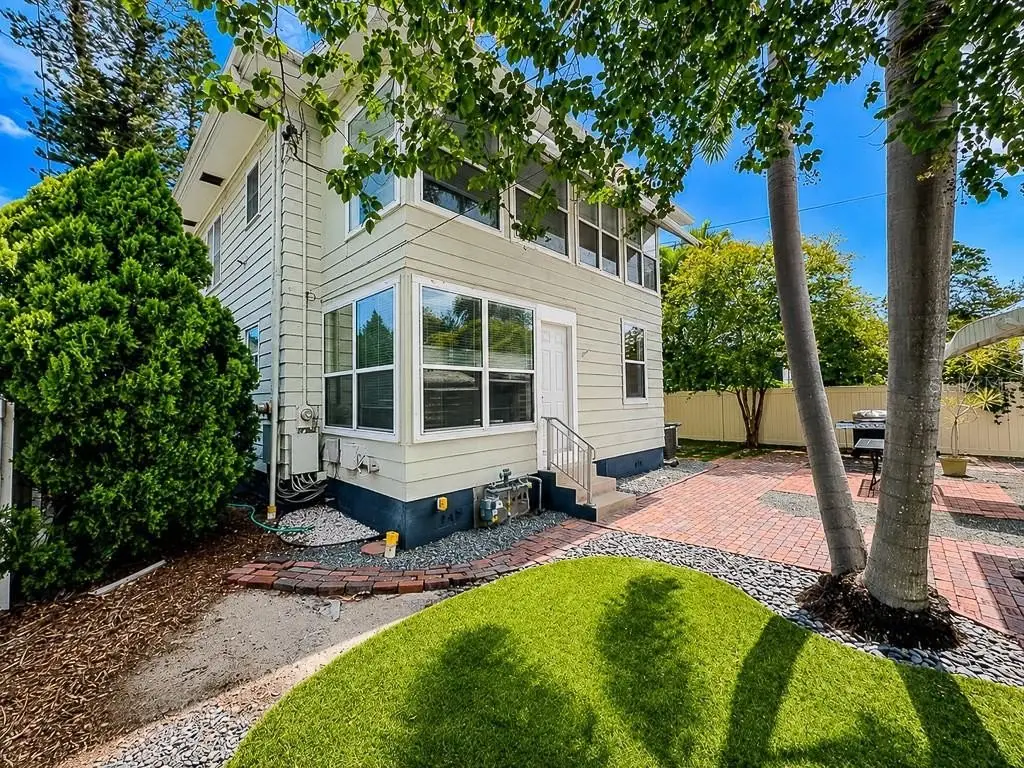
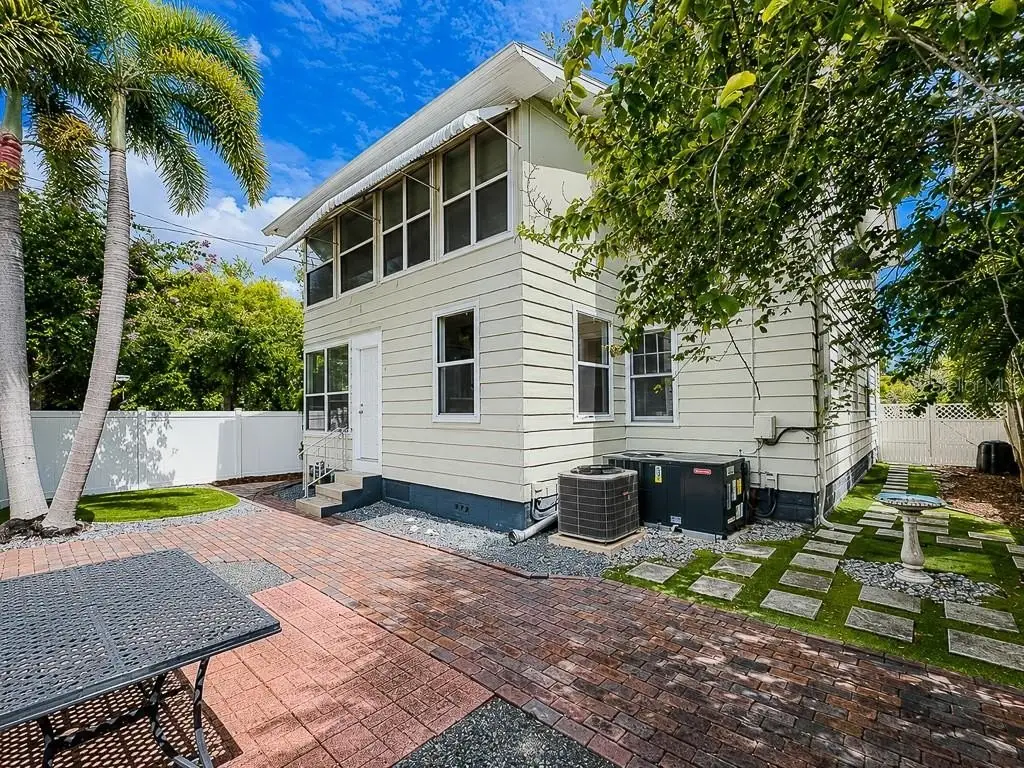
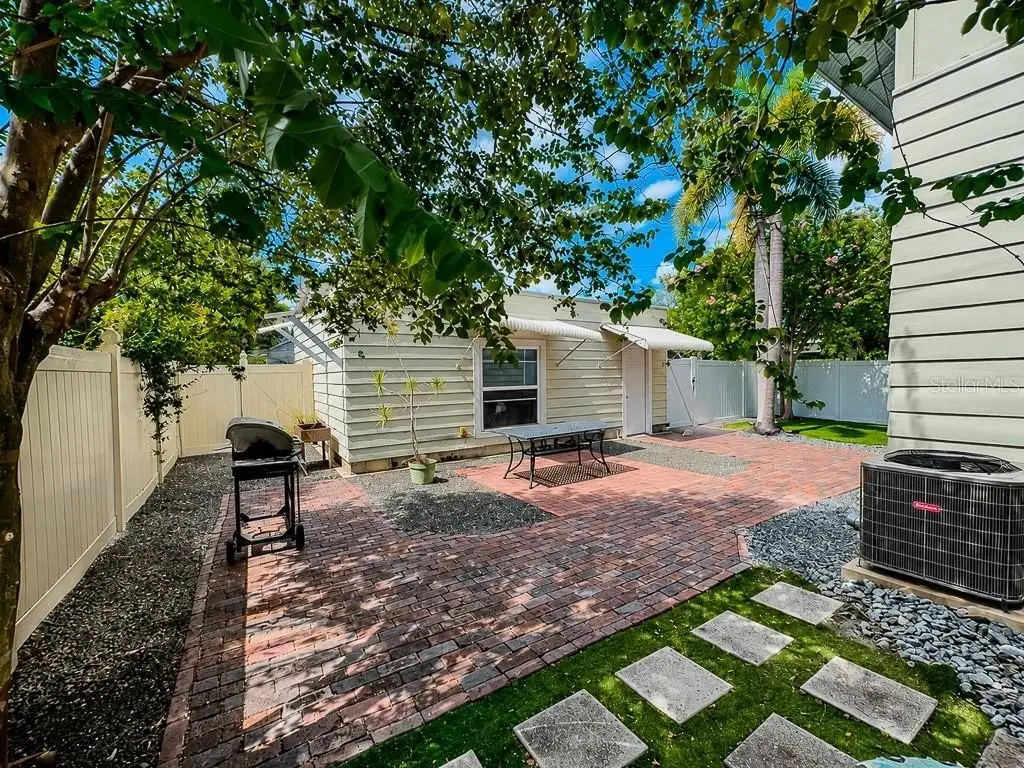
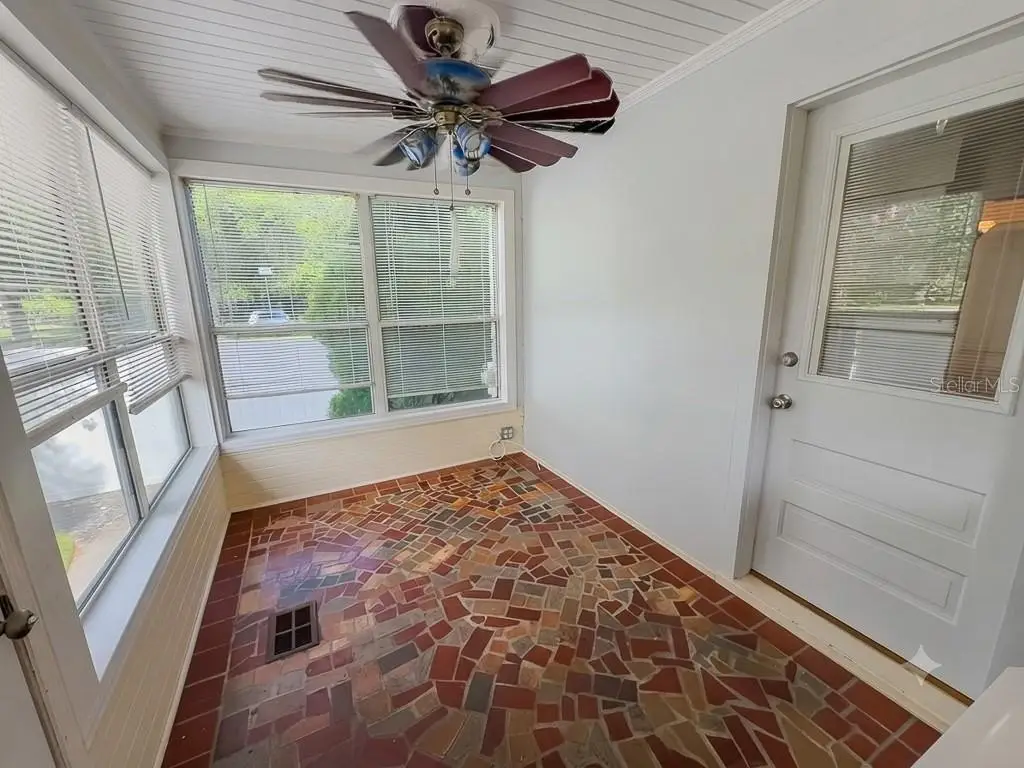
Porch, Patio
Interior features
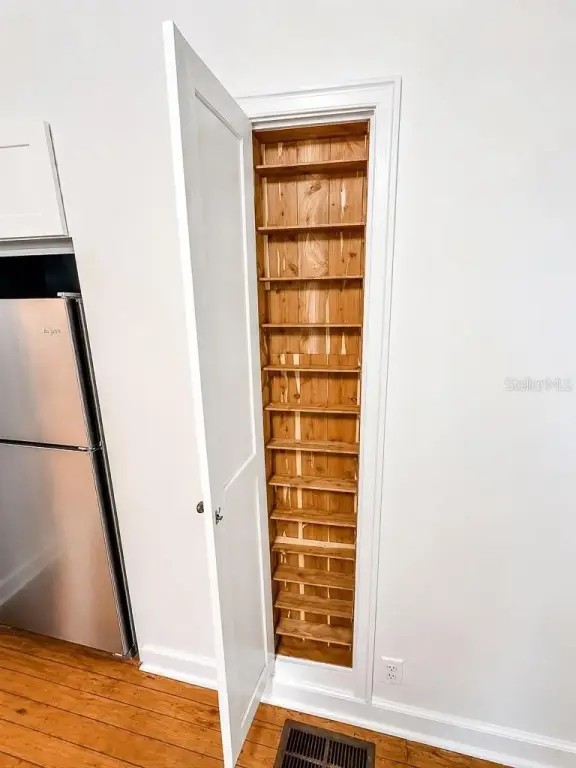
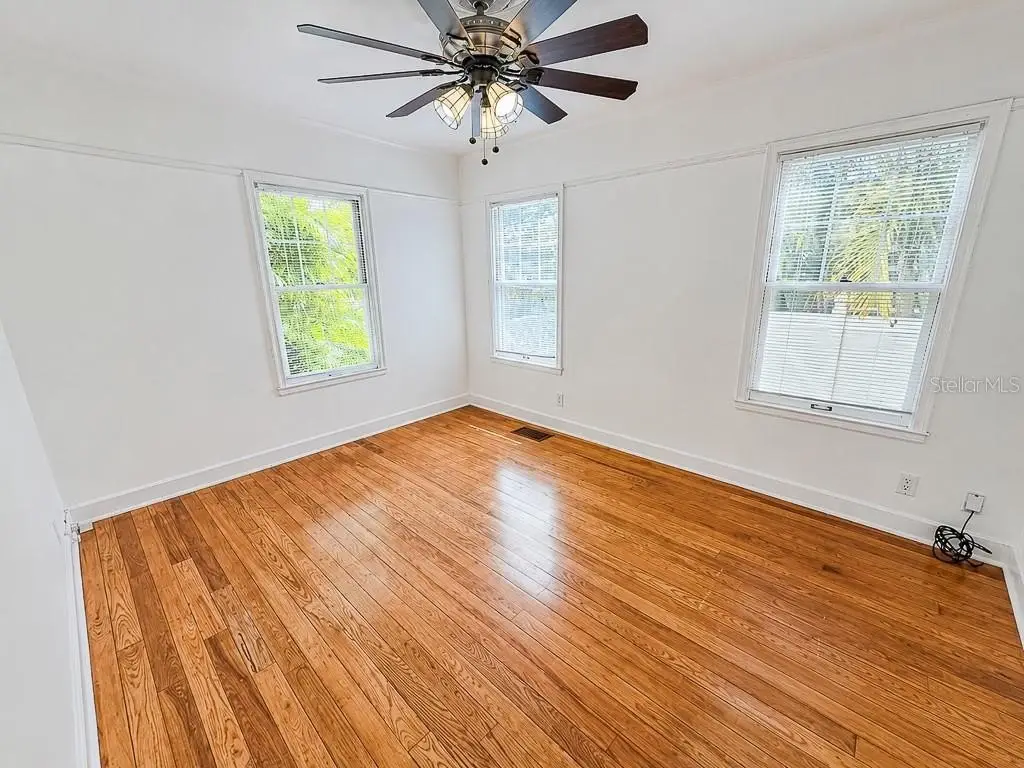
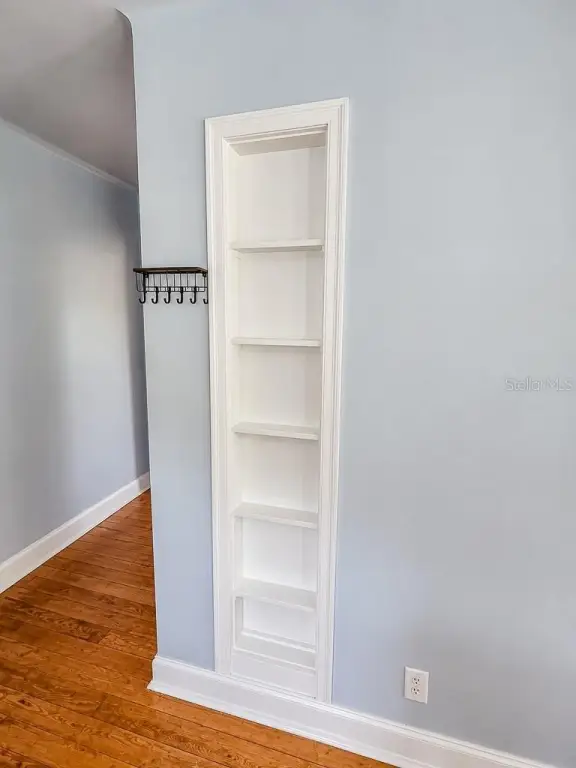
Built-in Features, Ceiling Fans(s)
Exterior features
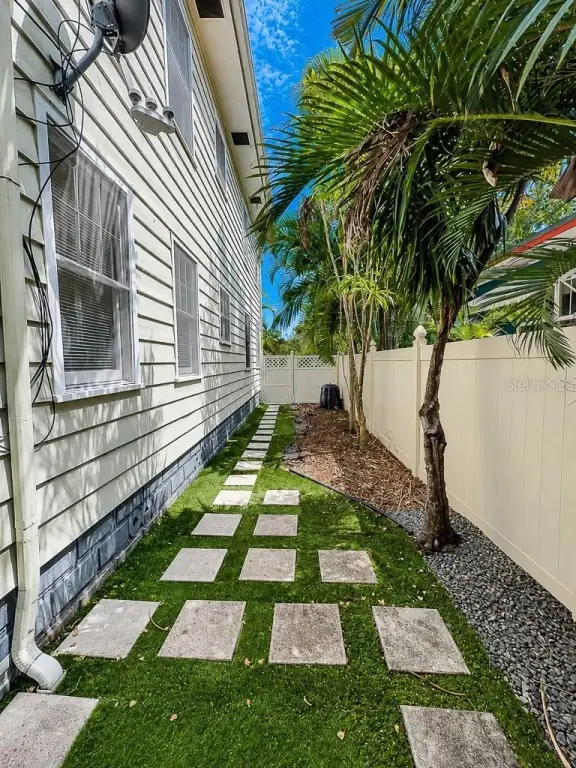
Fence, Rain Gutters, Sidewalk
Fencing
Fenced
Appliances
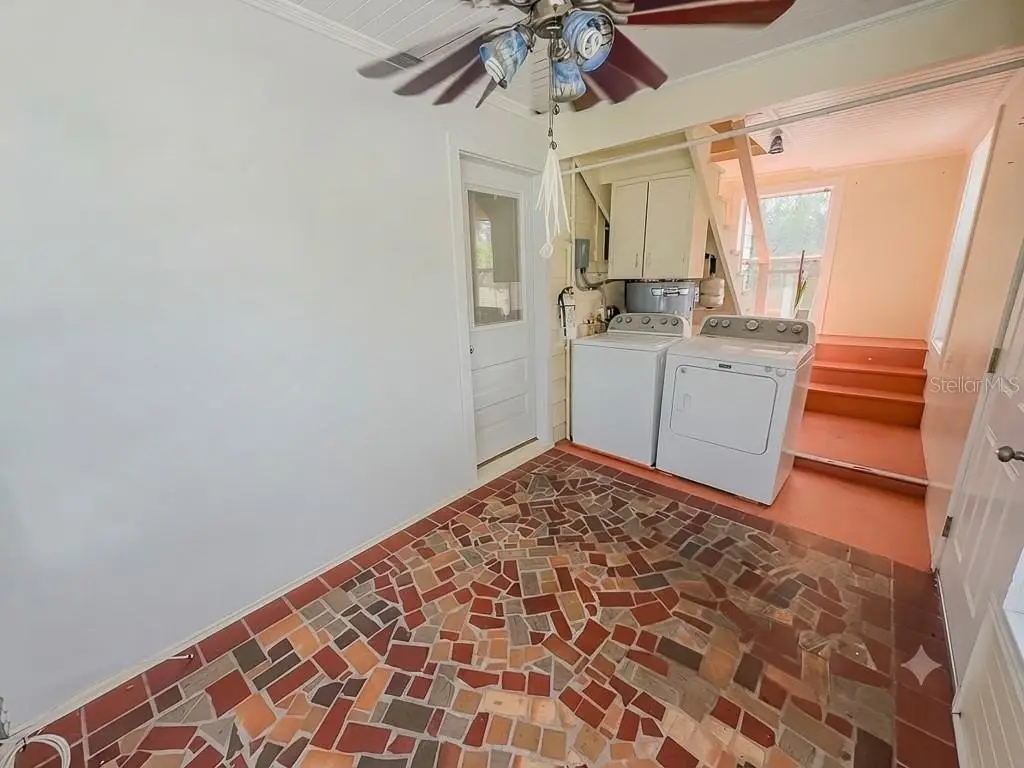
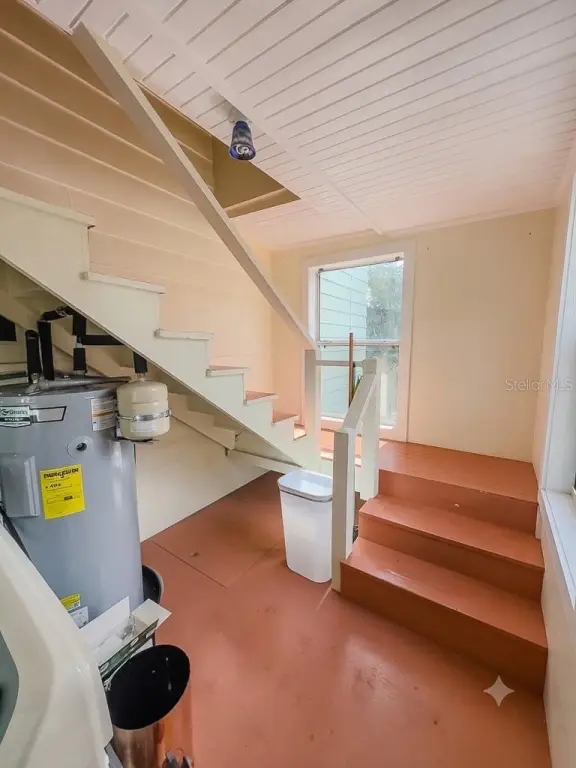
Dishwasher, Disposal, Dryer, Electric Water Heater, Range, Range Hood, Refrigerator, Washer
Subdivision
BRONX
Lot features
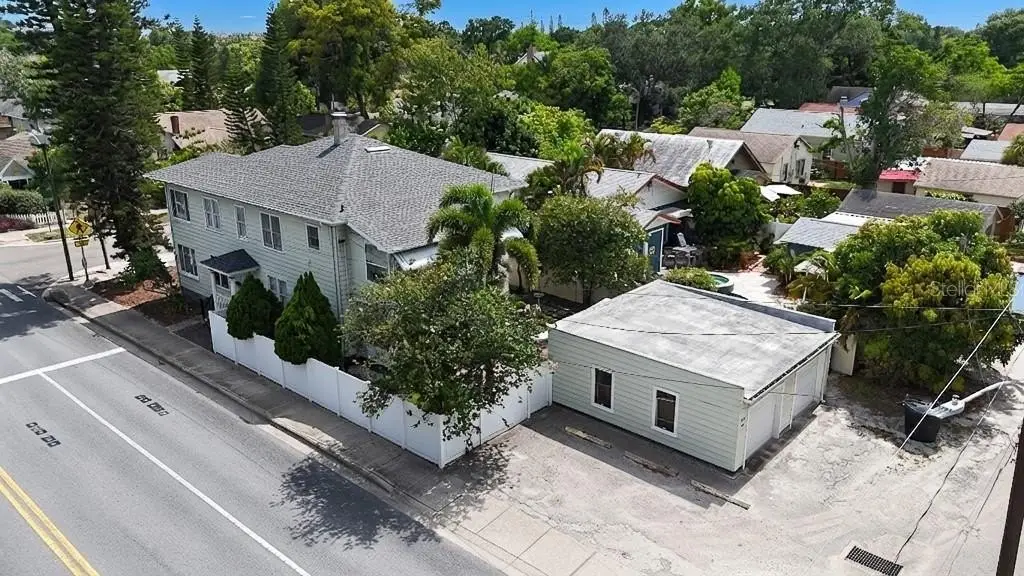
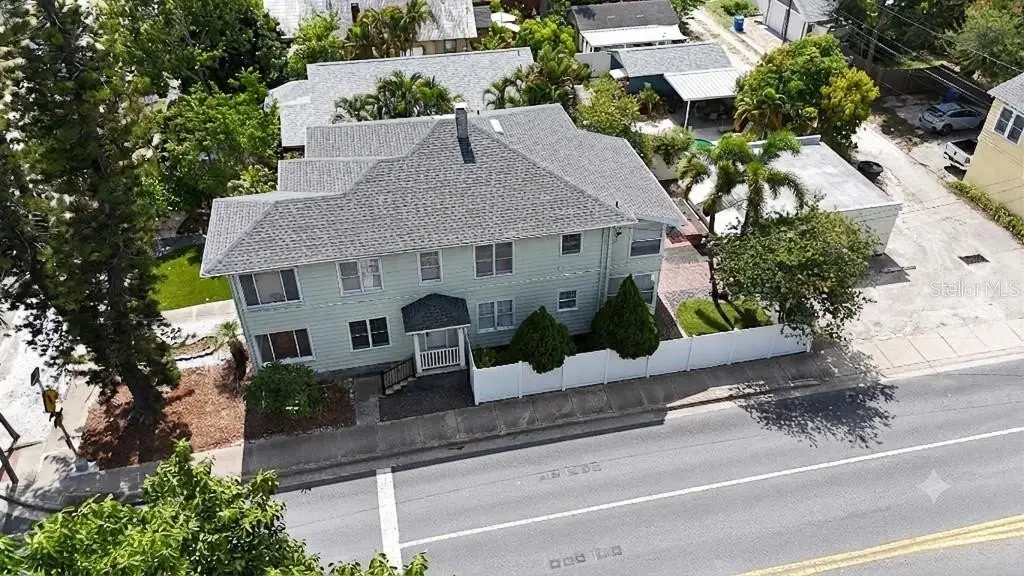
Corner Lot, Historic District, City Limits, Level, Near Public Transit, Sidewalk, Paved
View
Park
Elementary school
Woodlawn Elementary-PN
Middle school
John Hopkins Middle-PN
High school
St. Petersburg High-PN
Directions
From 20th St and 4th Ave N head West. Home is the first home on the Northwest corner of 20th St and 4th Ave N.
Standard status
Active
APN
24-31-16-11808-005-0090
Size
2,688 SF
Lot size
0.15 Acres
Taxes and HOA fees
Tax Year
2025
Tax Description
BRONX BLK 5, LOT 9
Tax Annual Amount
13944
Legal Description
BRONX BLK 5, LOT 9
Utilities
Sewer type
Public Sewer
Heating system
Central
Cooling system
Central Air
Water source
Public
Building Details
Year built
1939
Floors in Building
2
Number of units
2
Flooring type
Wood, Tile - Ceramic
Building materials
Frame
Roof type
Shingle
Additional Structures
Storage
Buildings
1
Listing Agency:
CHARLES RUTENBERG REALTY INC
(727) 538-9200
Listed By:
Bill Smith
(727) 487-3339
Added: Jul 22
Changed: Oct 25
Last Checked: Oct 25 at 9:06PM
MLS# TB8531733
Copyright © 2026 Stellar MLS. All rights reserved. All information provided by the listing agent/broker is deemed reliable but is not guaranteed and should be independently verified.

Ask AI about this property
Review the available facts, identify missing information and prepare questions for the agent.
Investment Insights
Based on property information with market context.
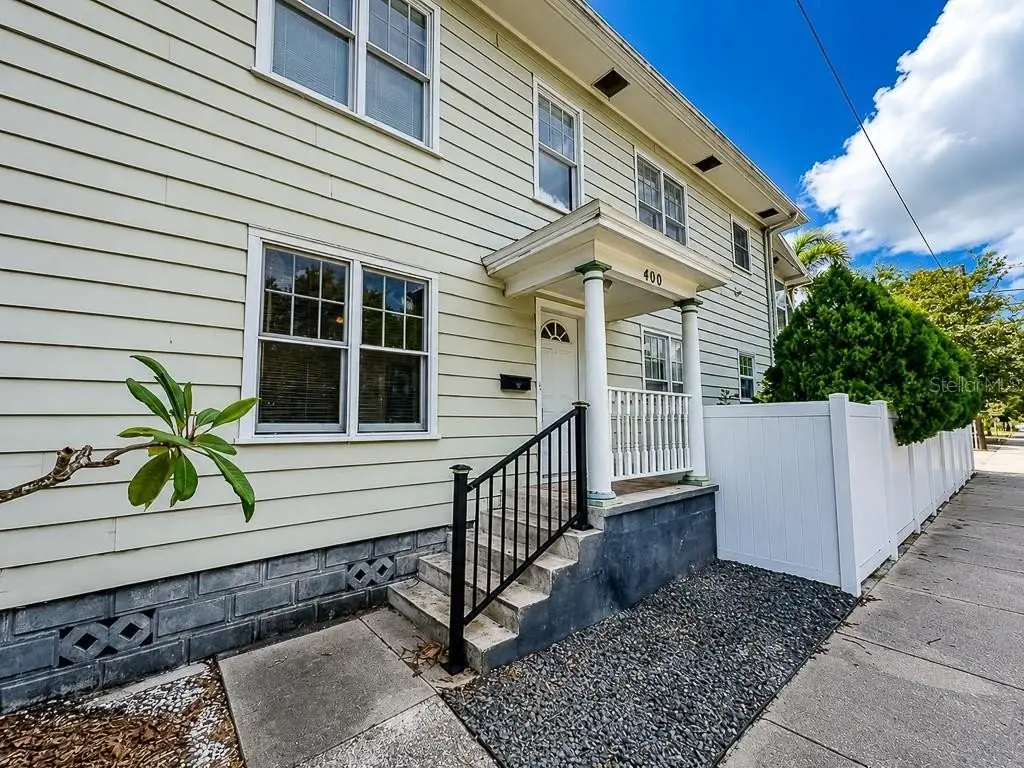
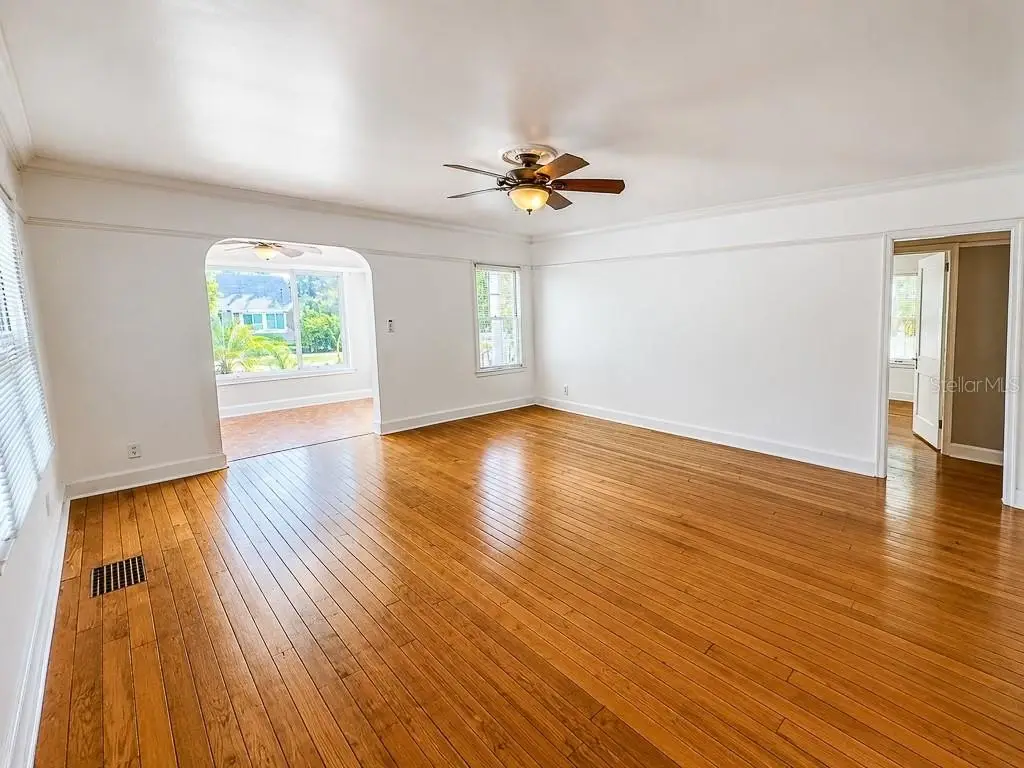
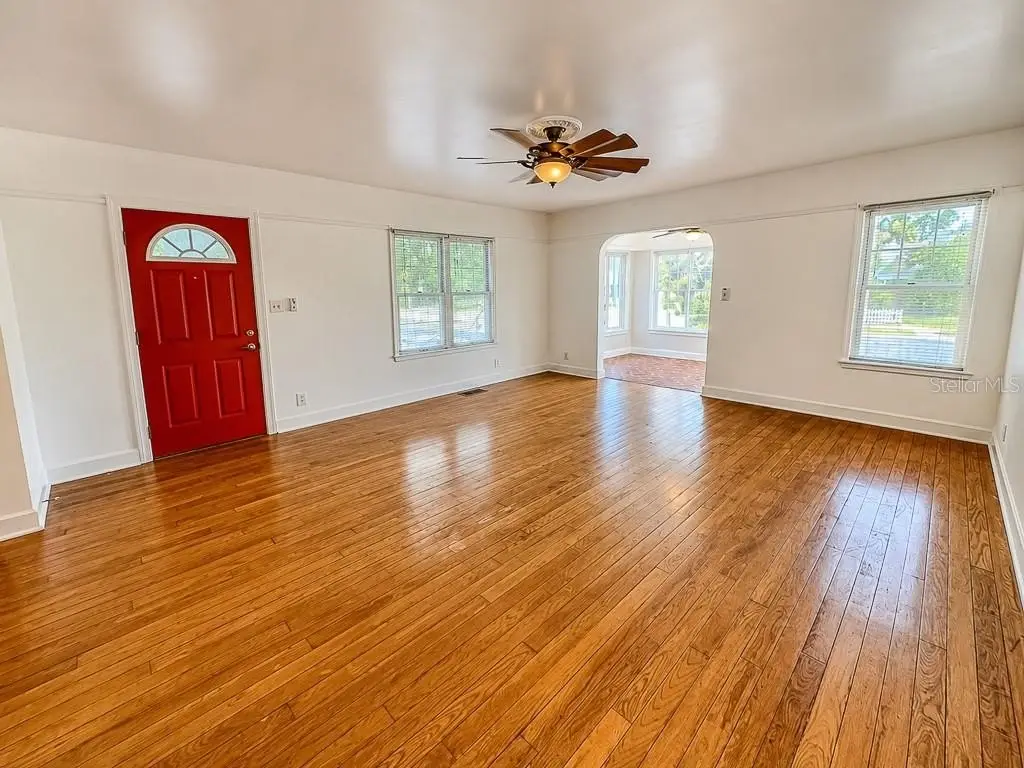
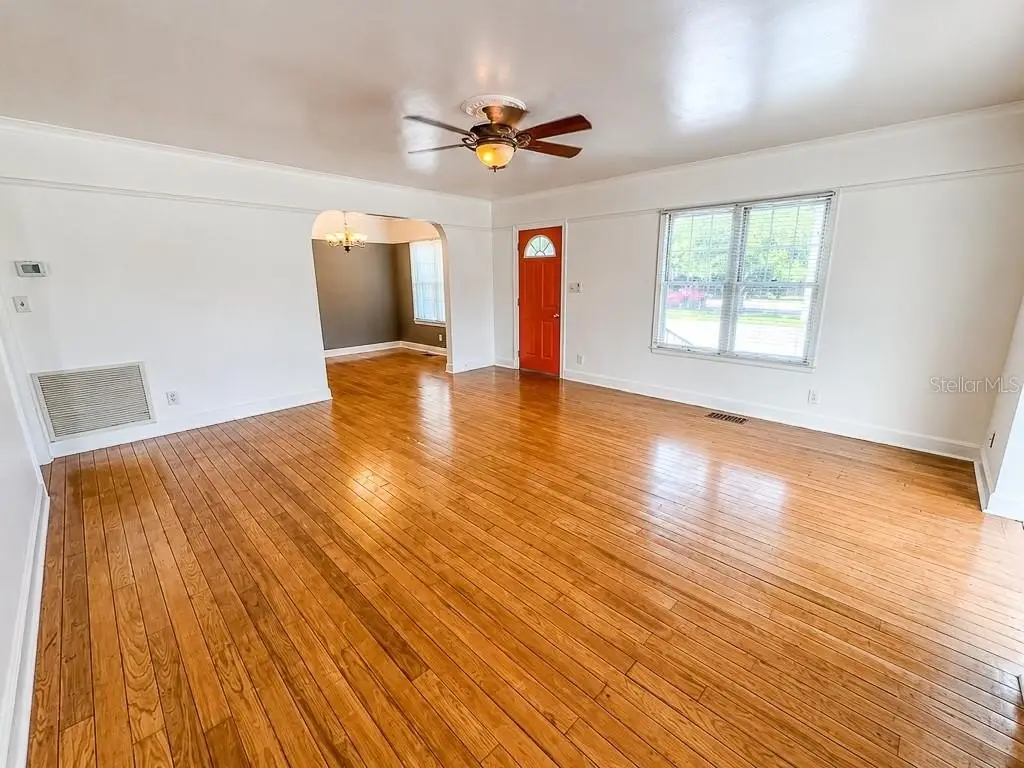
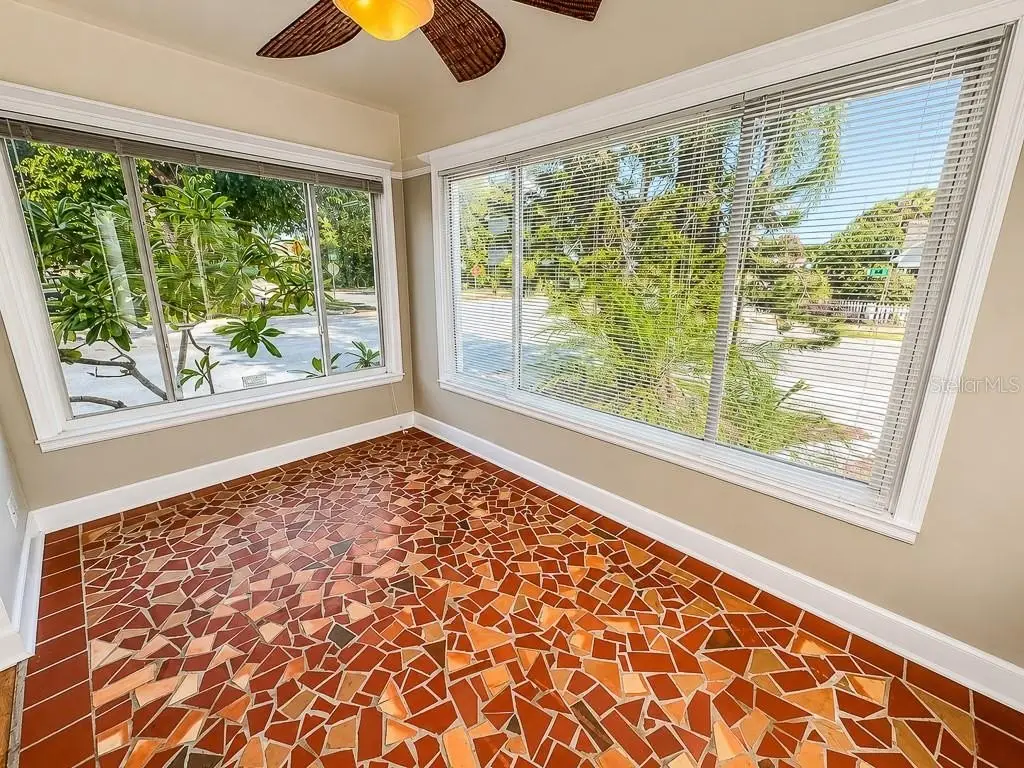
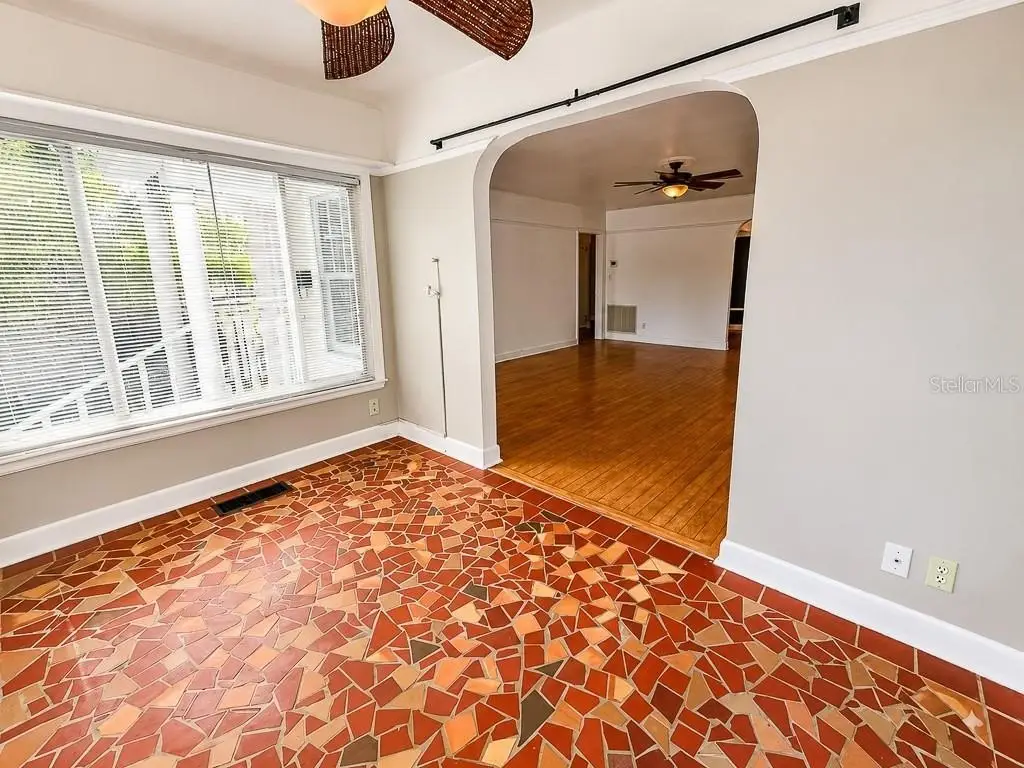
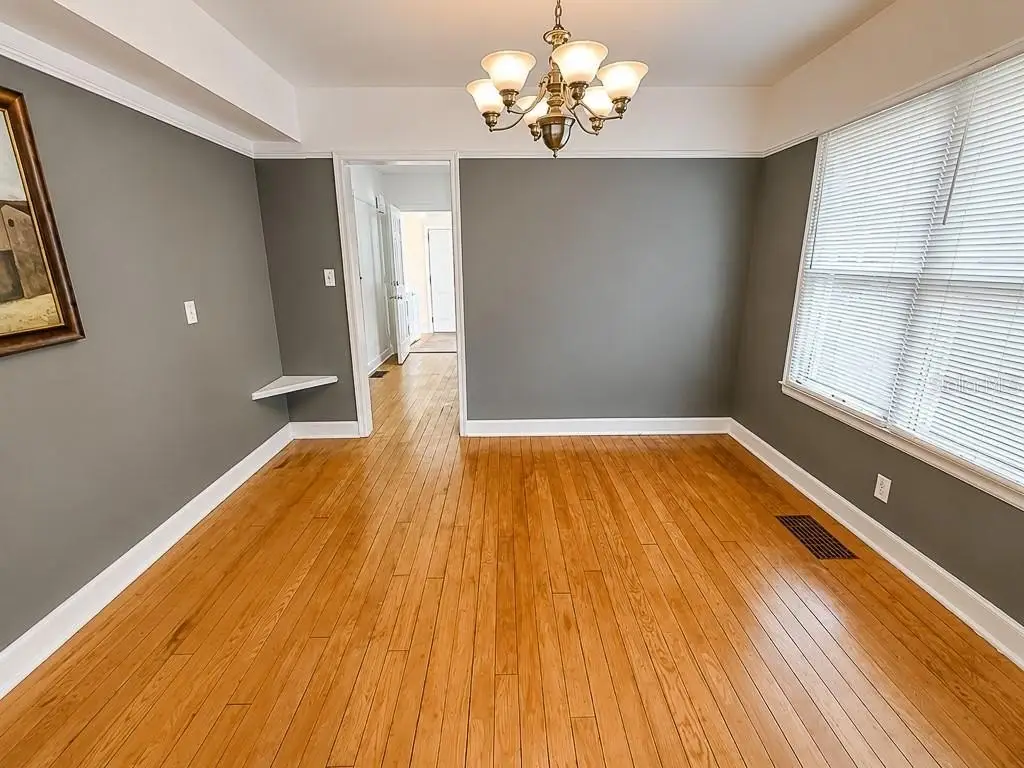
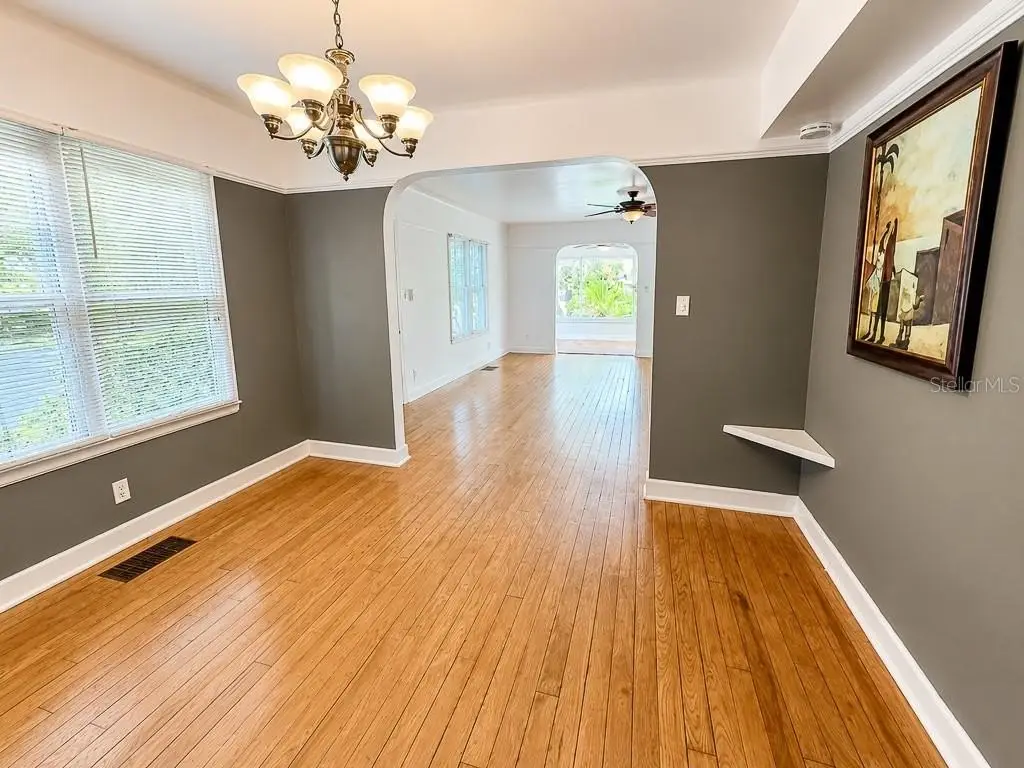
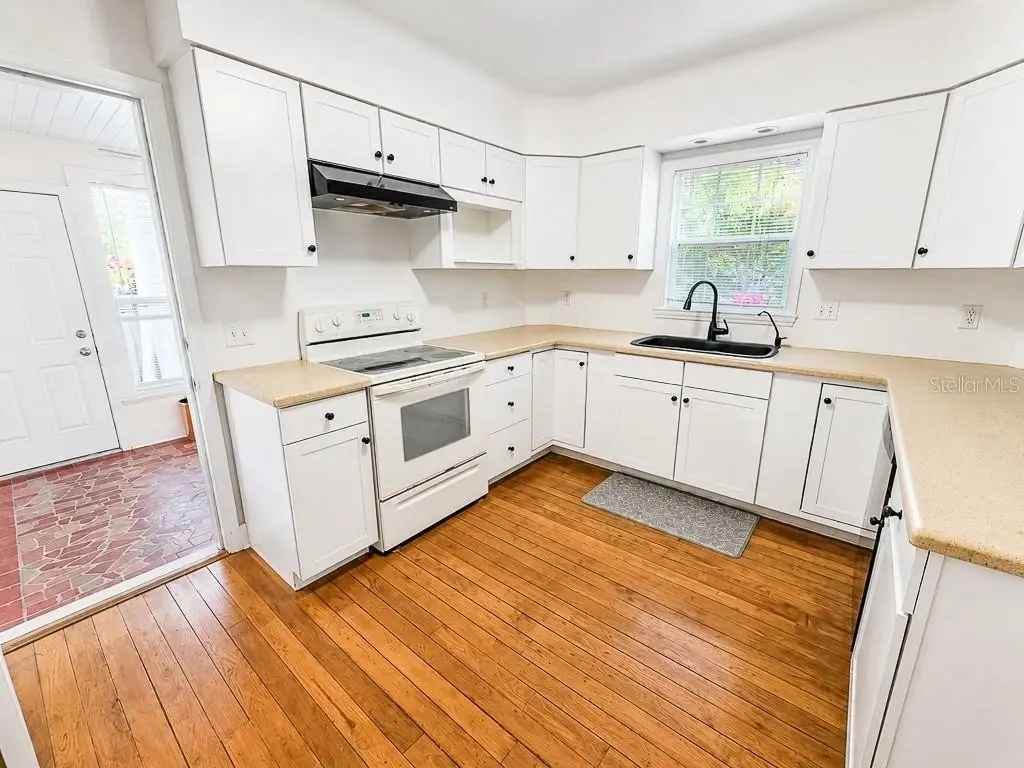
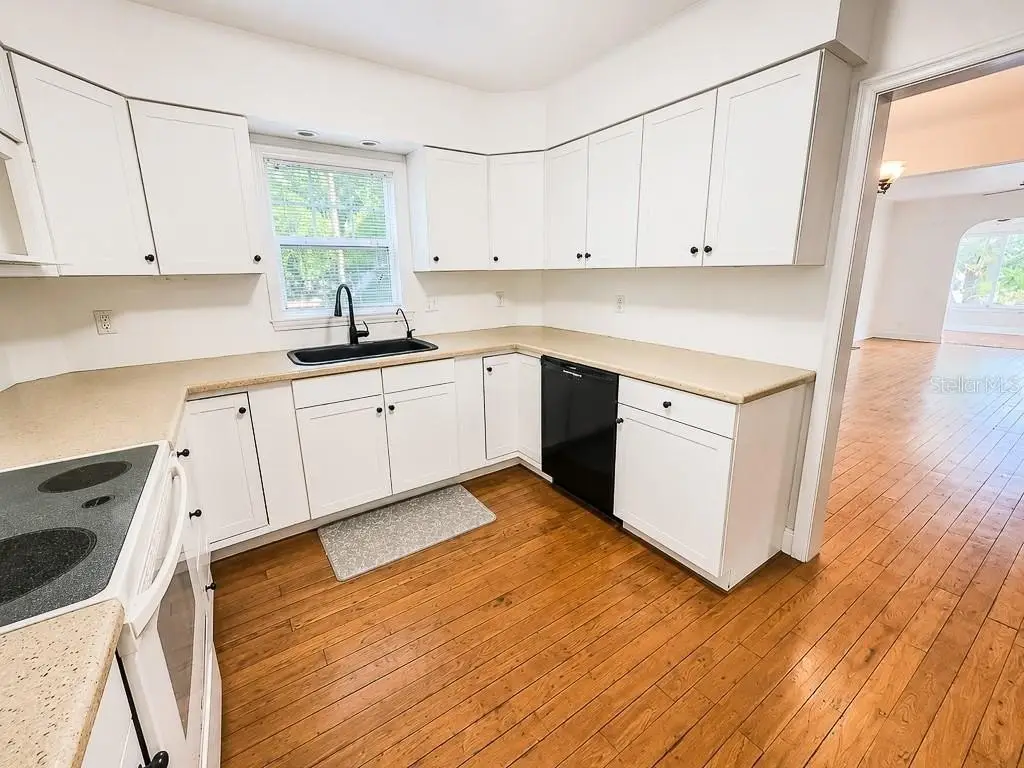
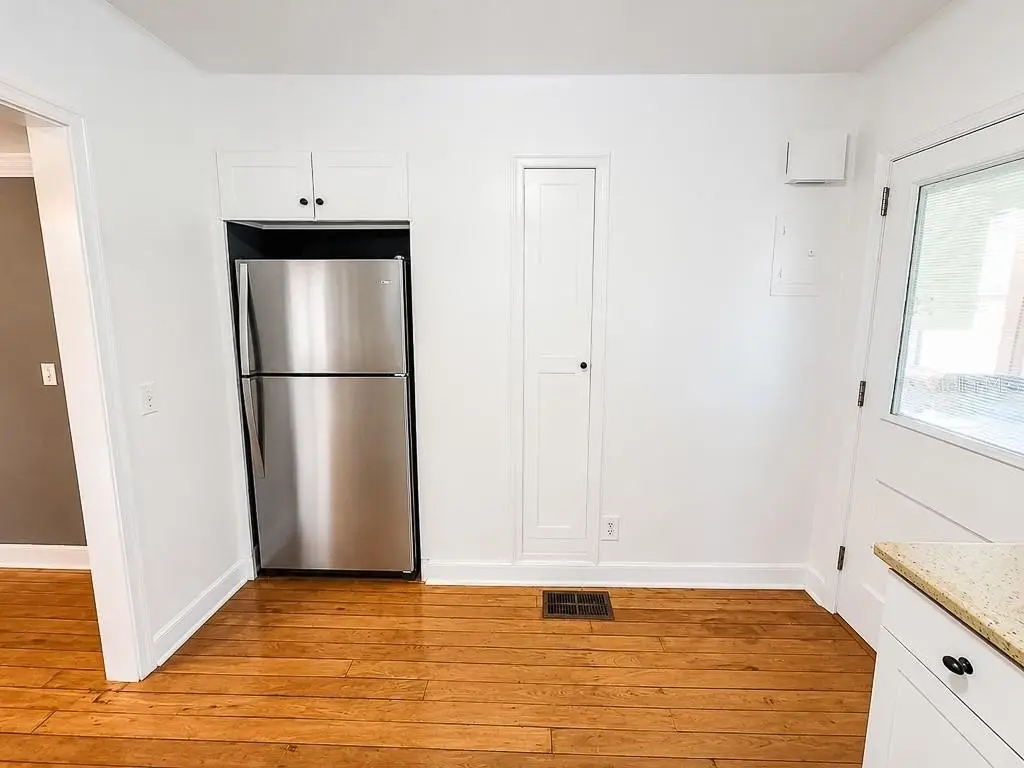
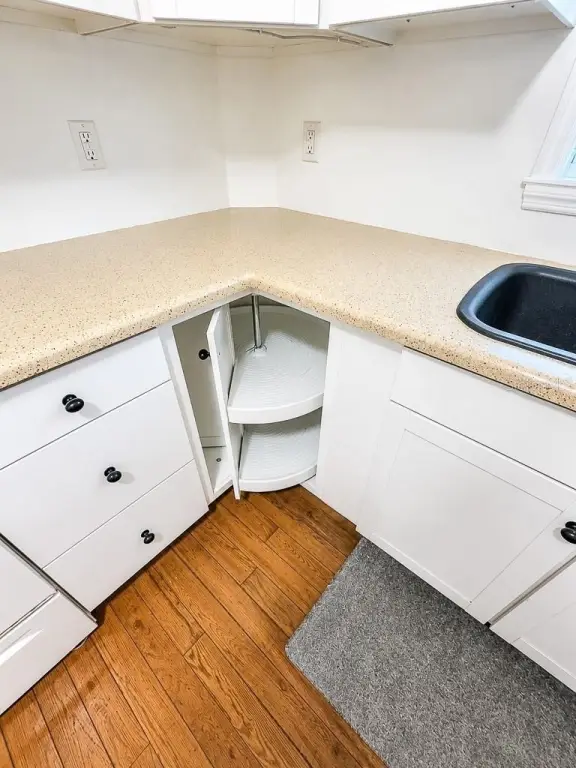
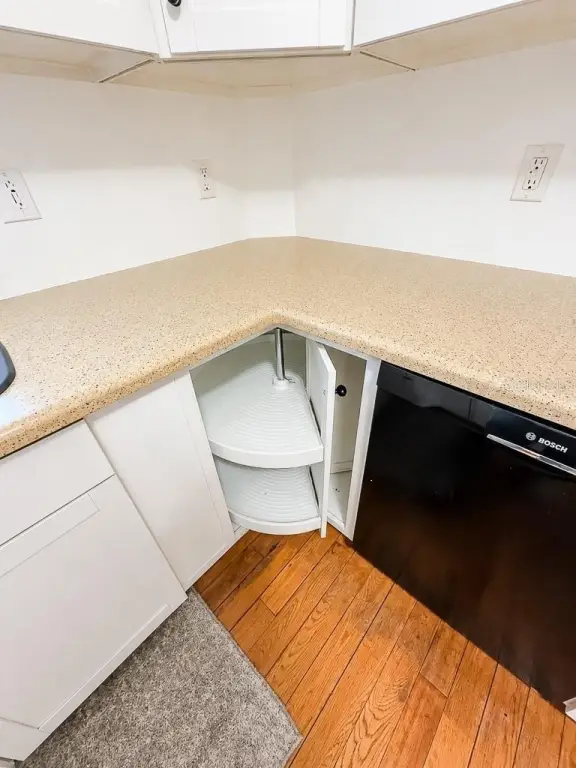
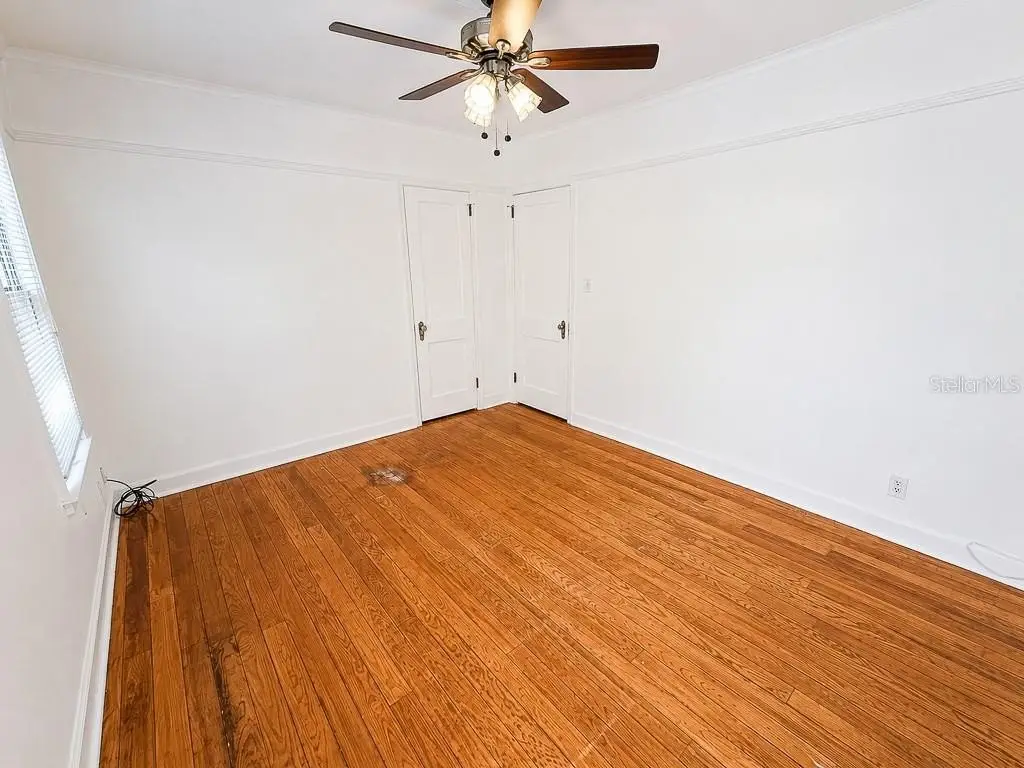
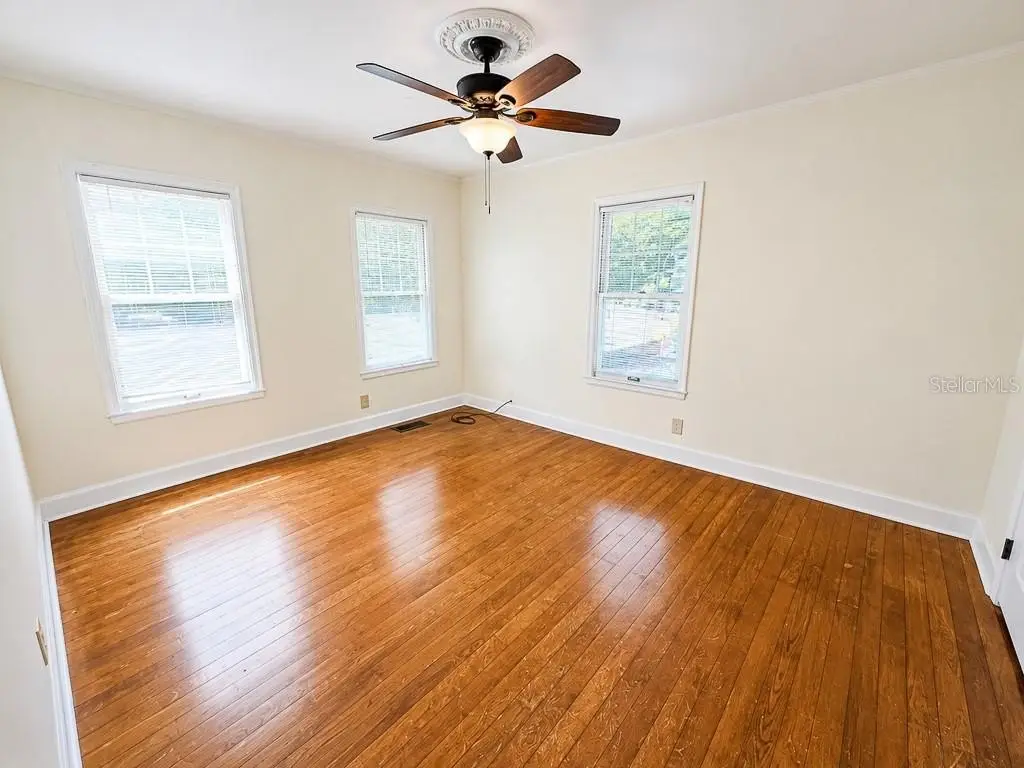
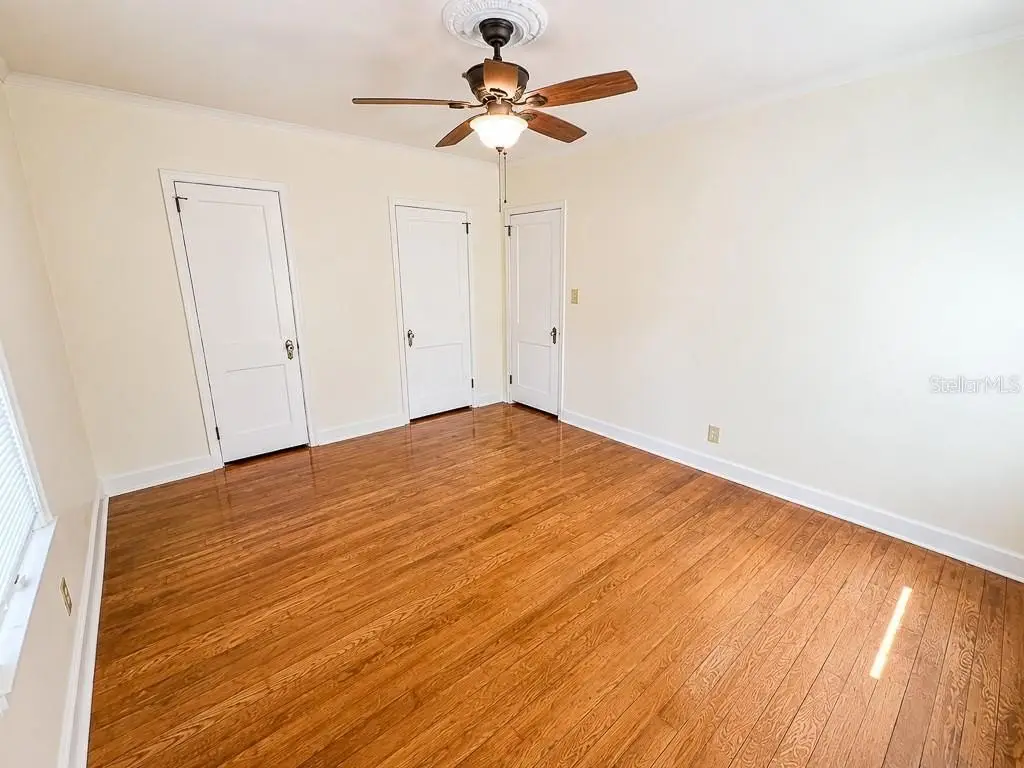
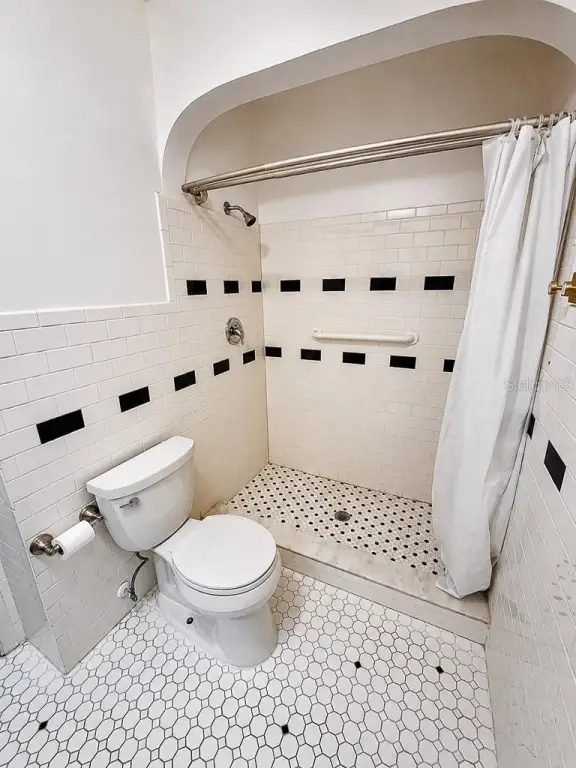
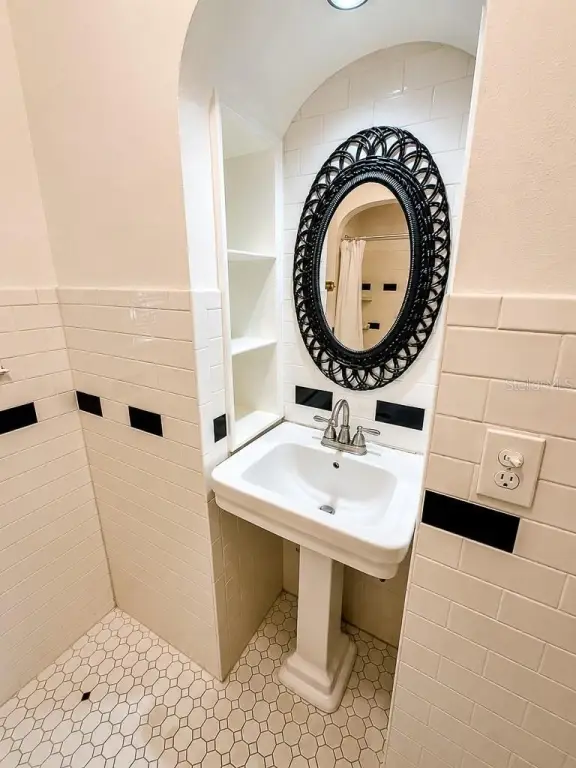
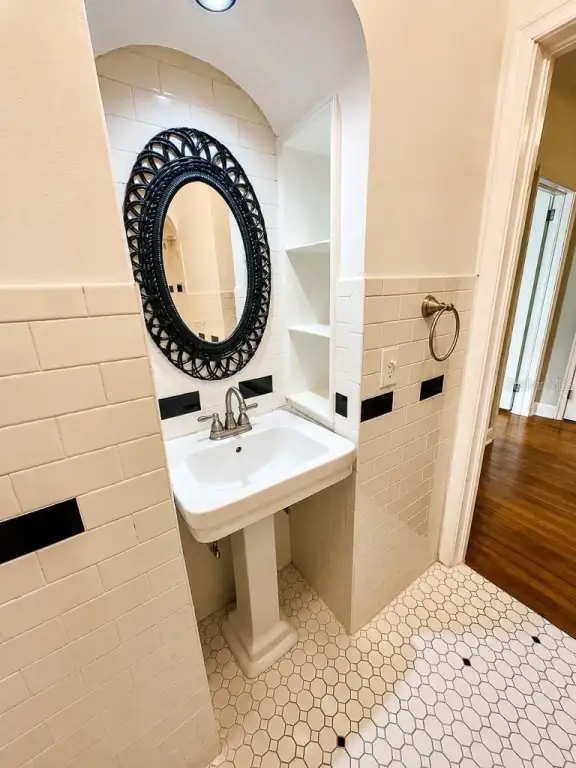
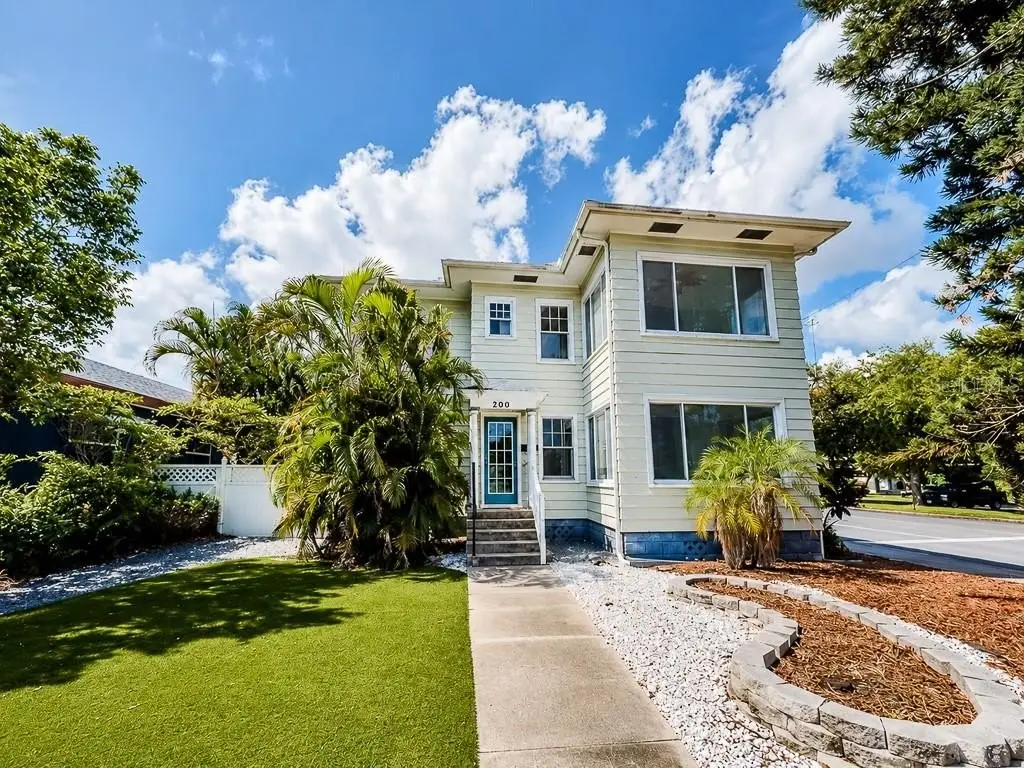
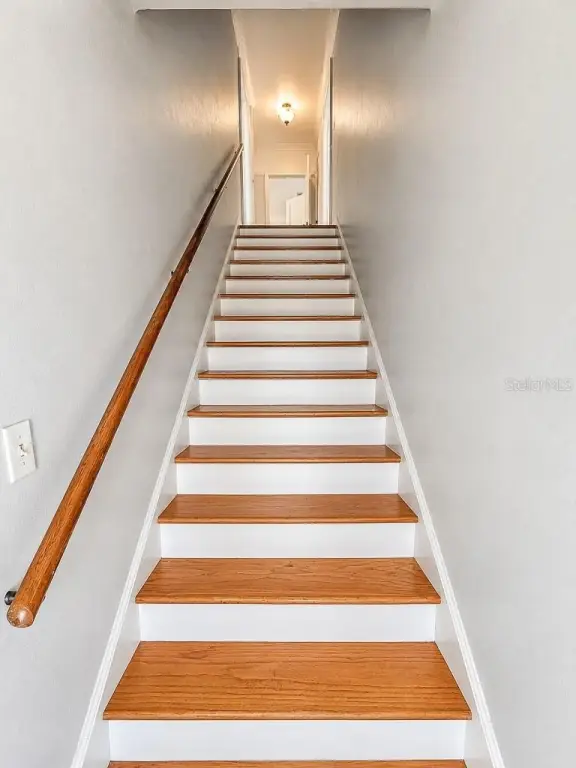
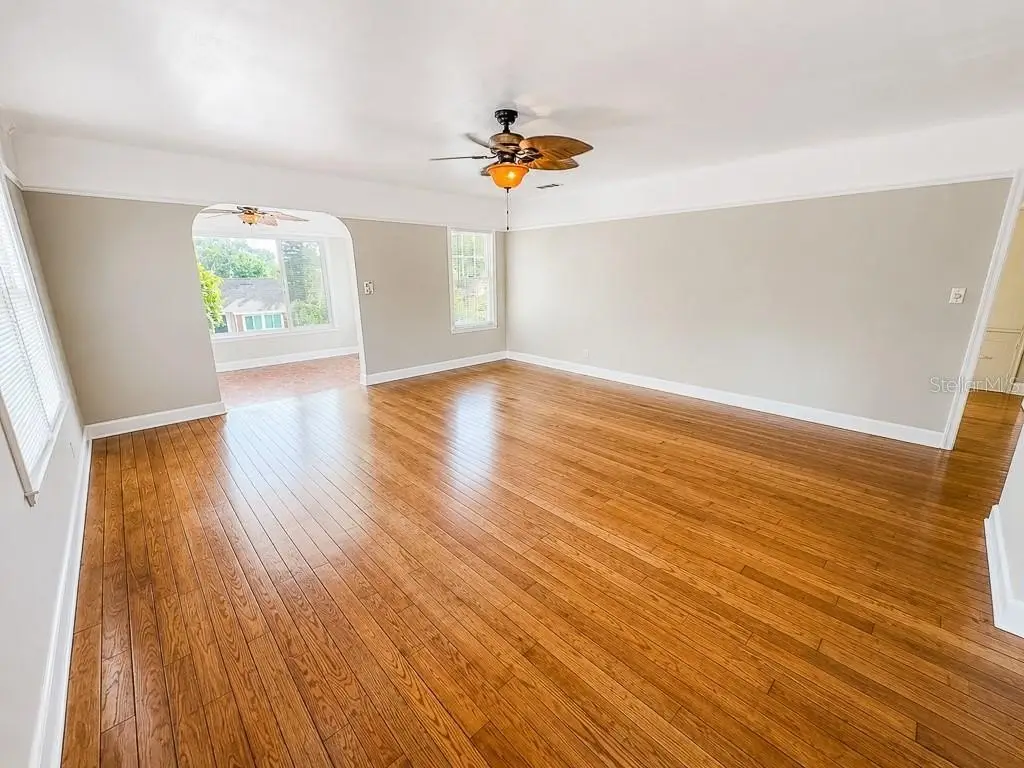
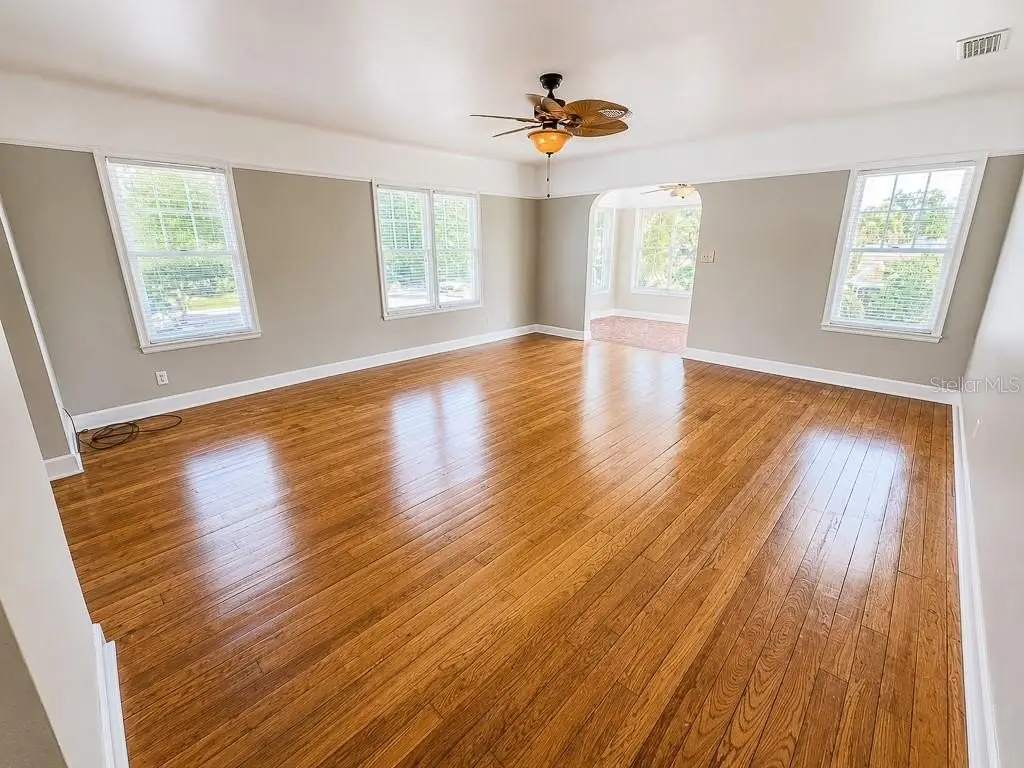
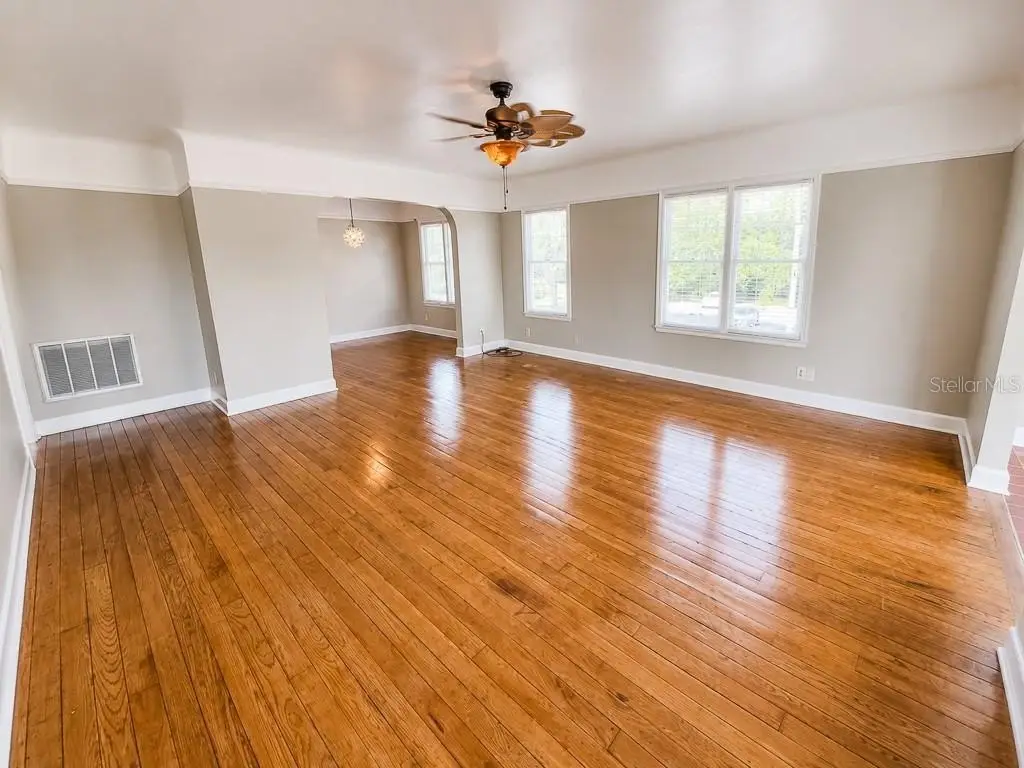
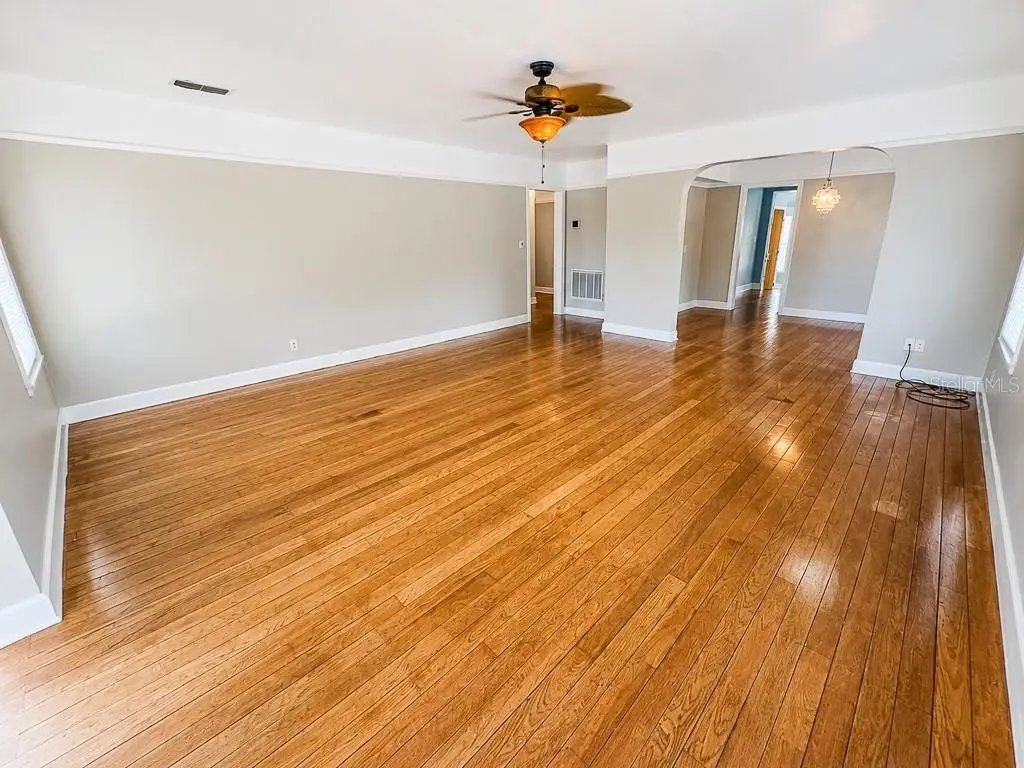
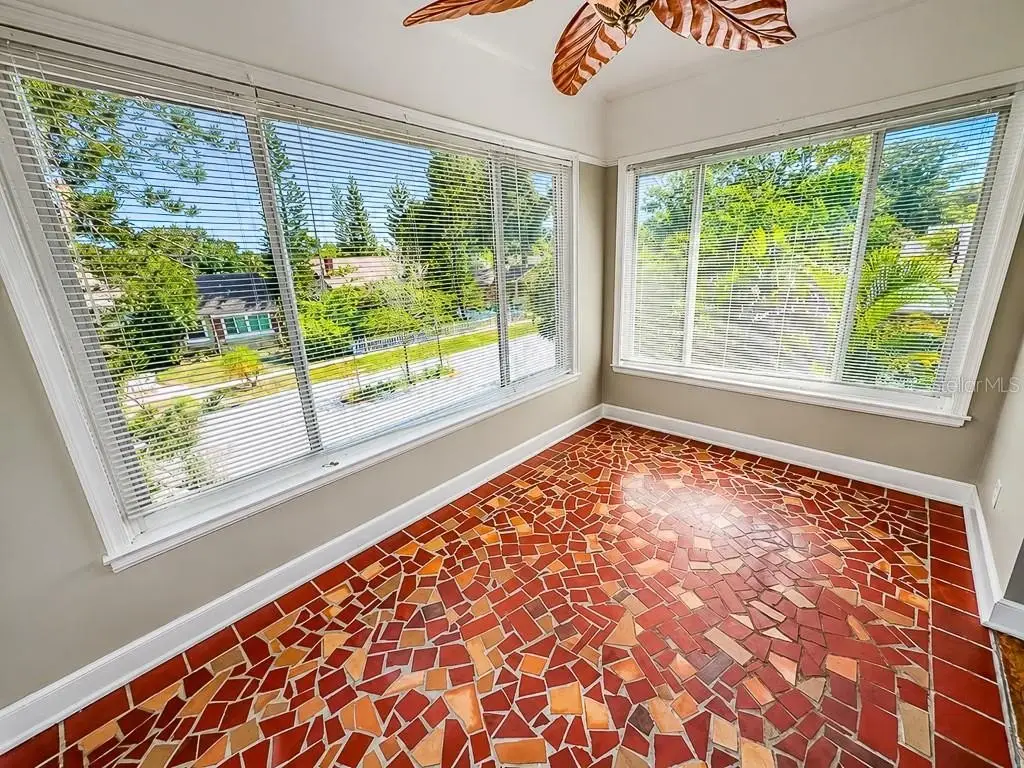
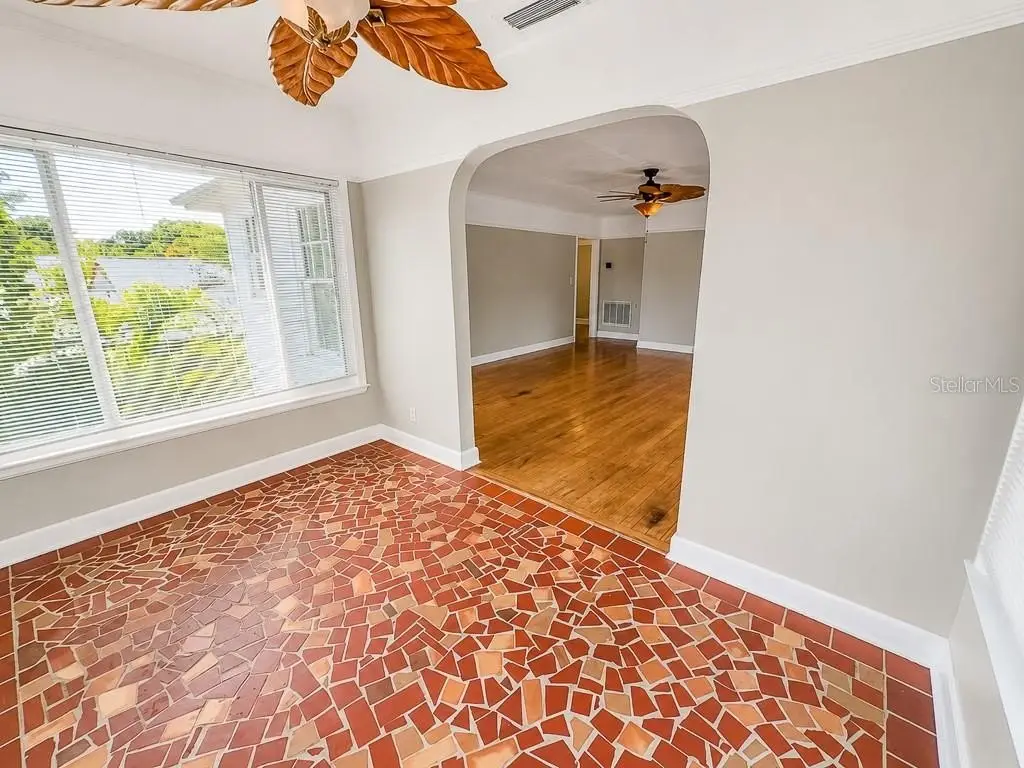
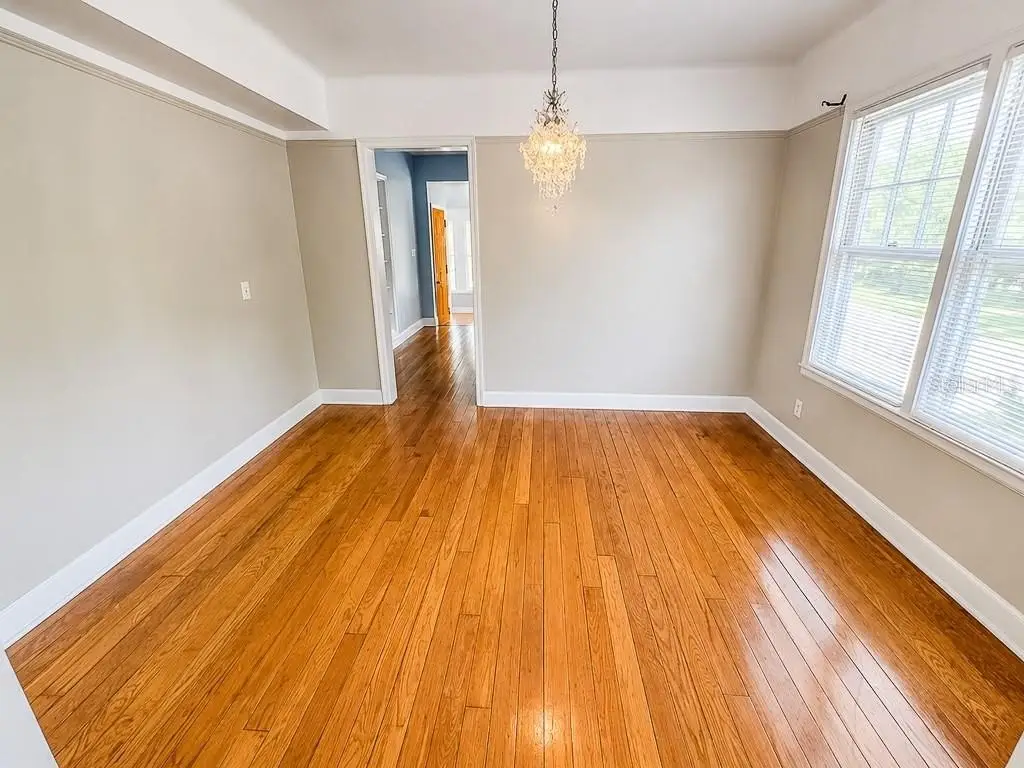
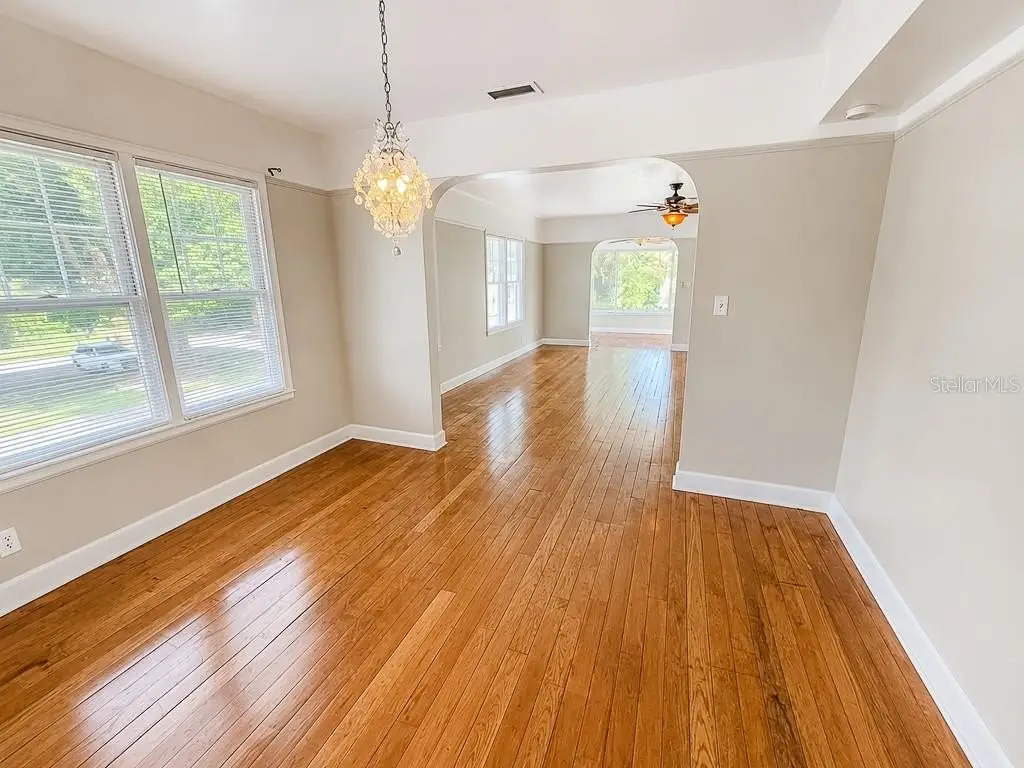
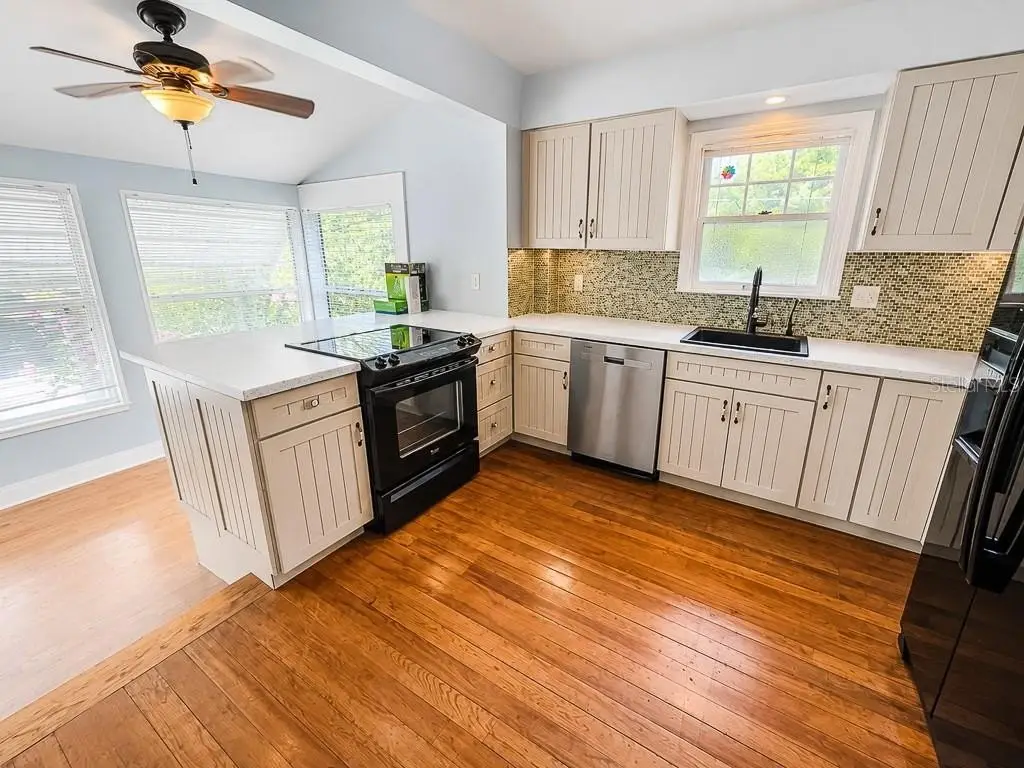
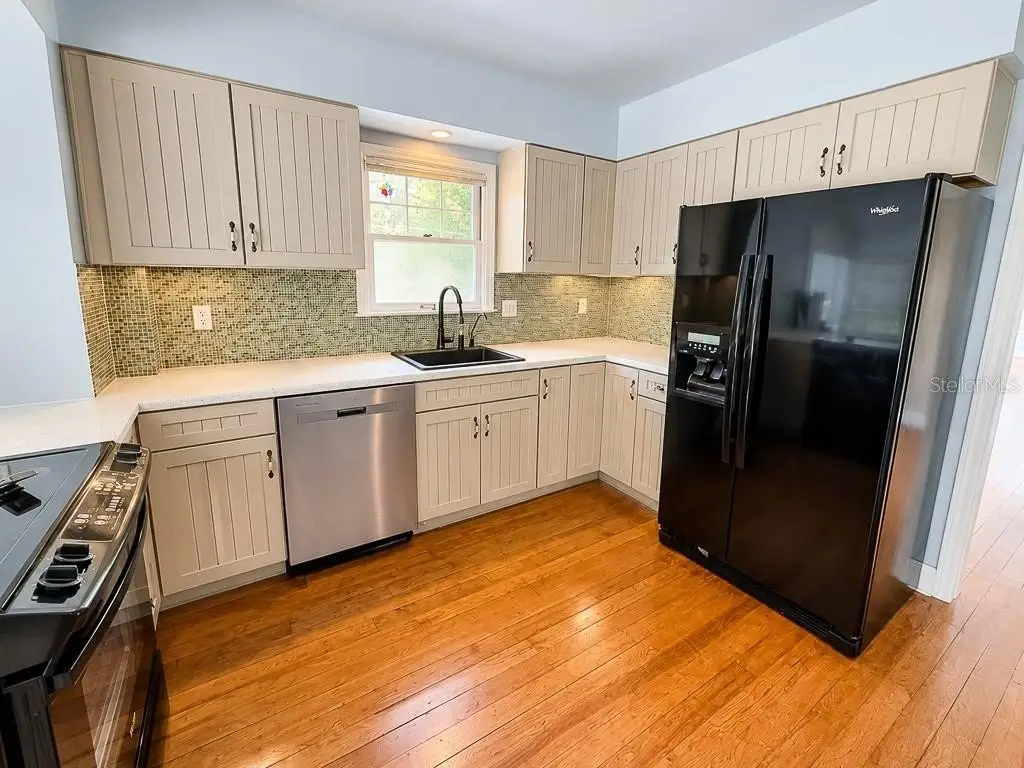
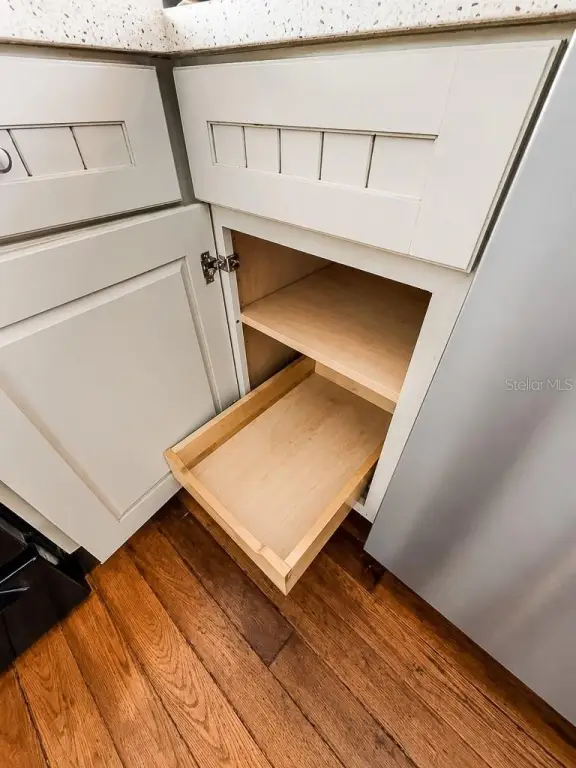
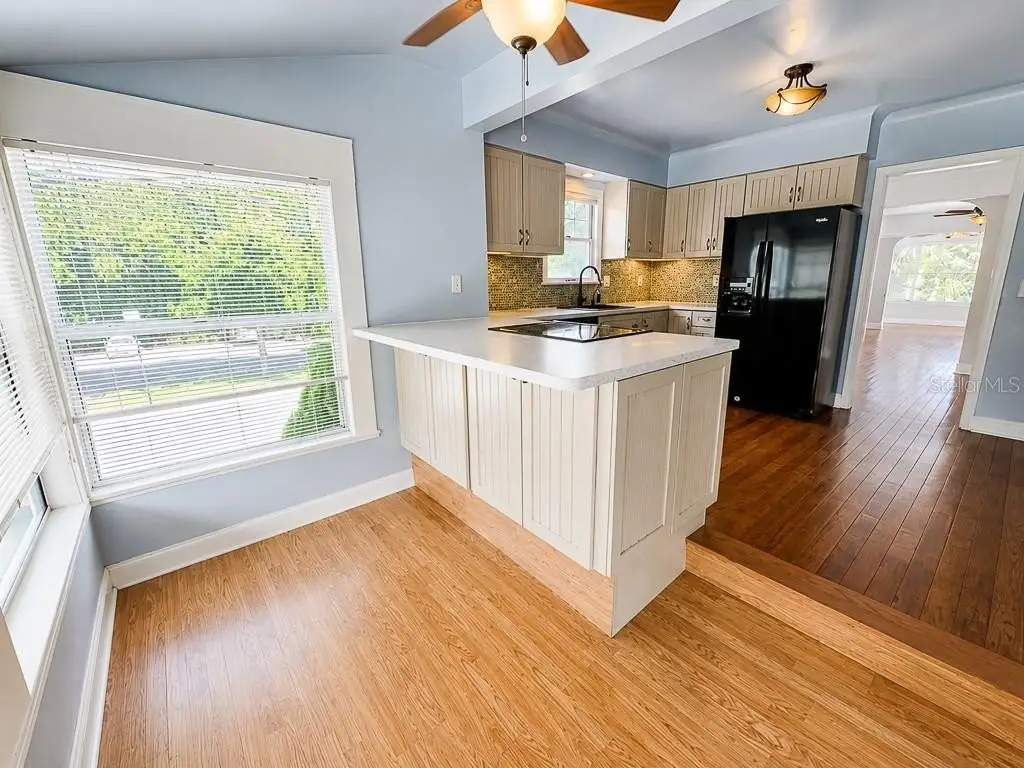
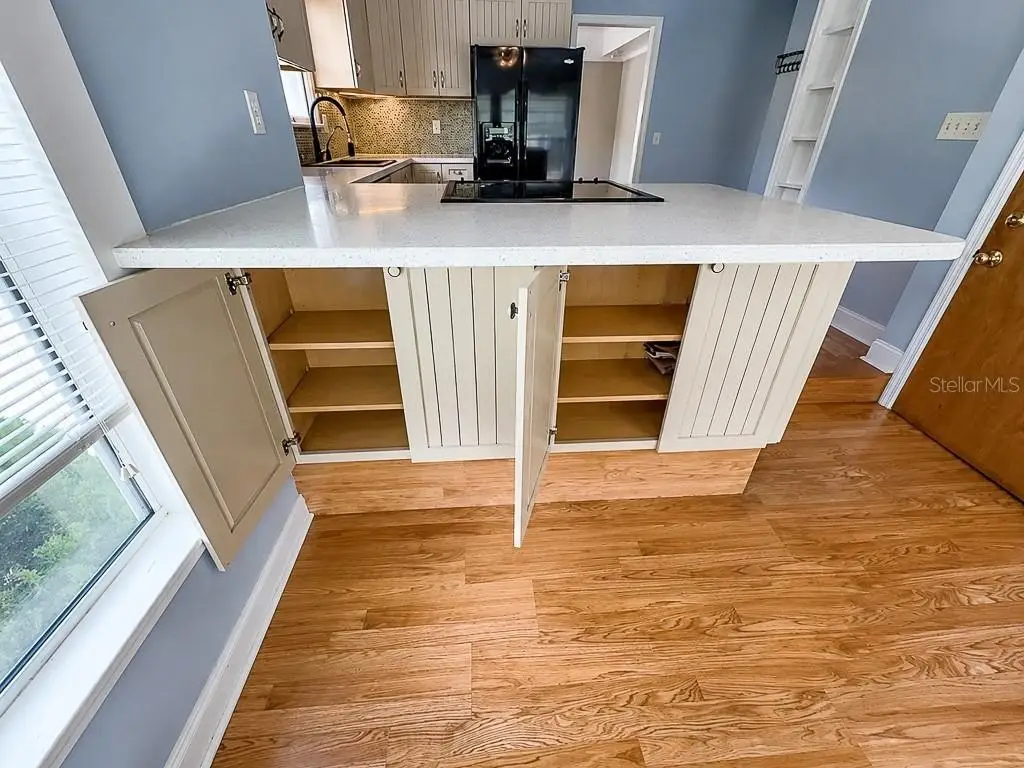
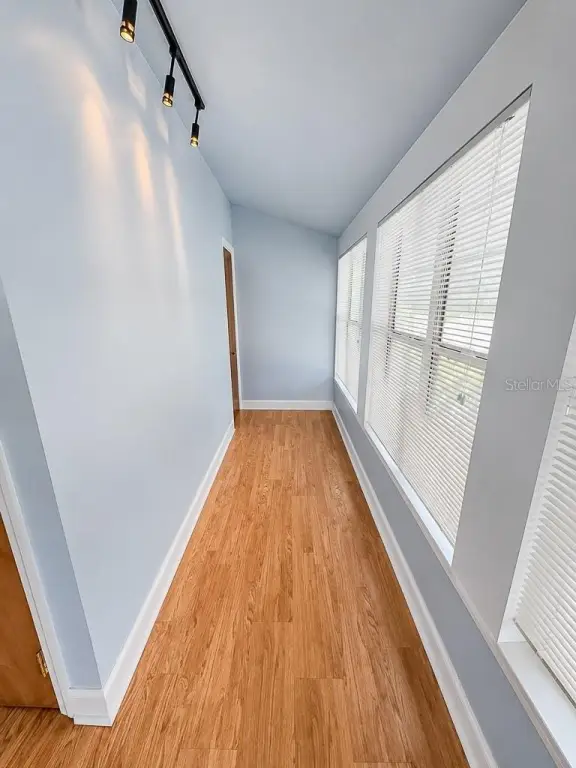
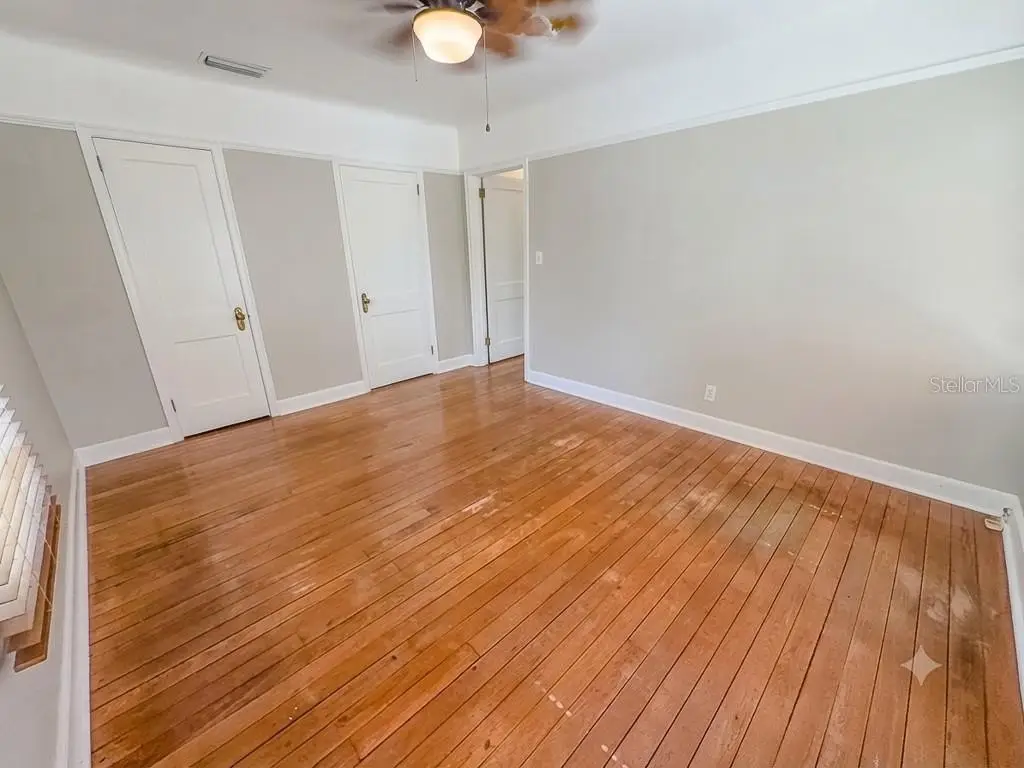
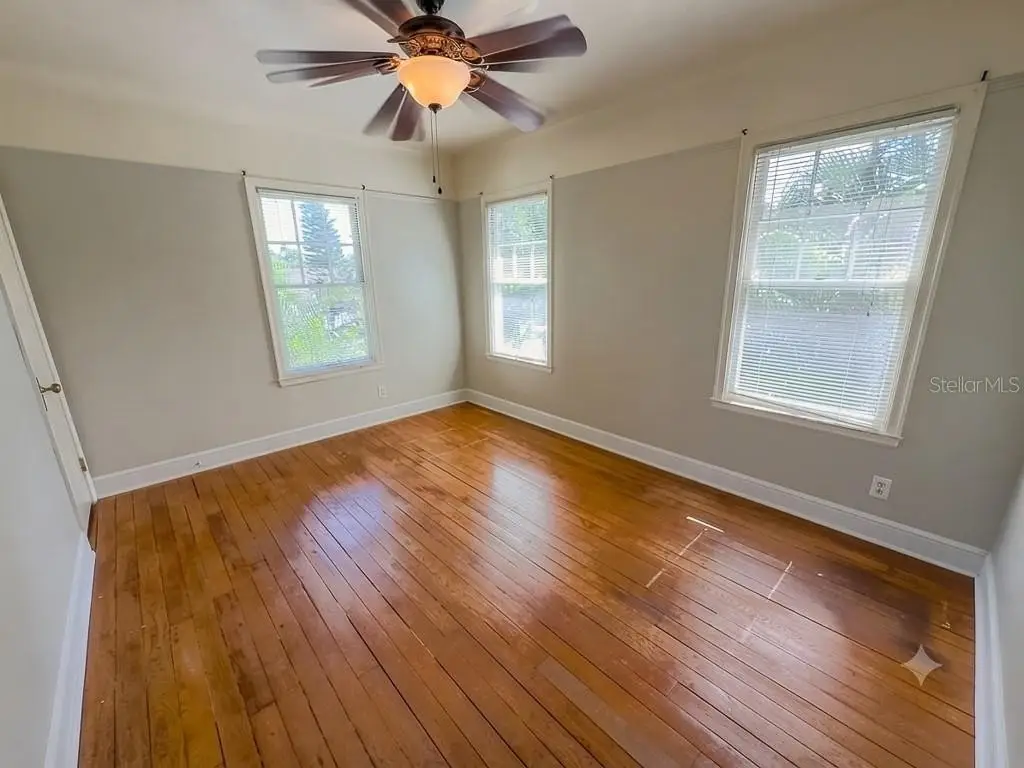
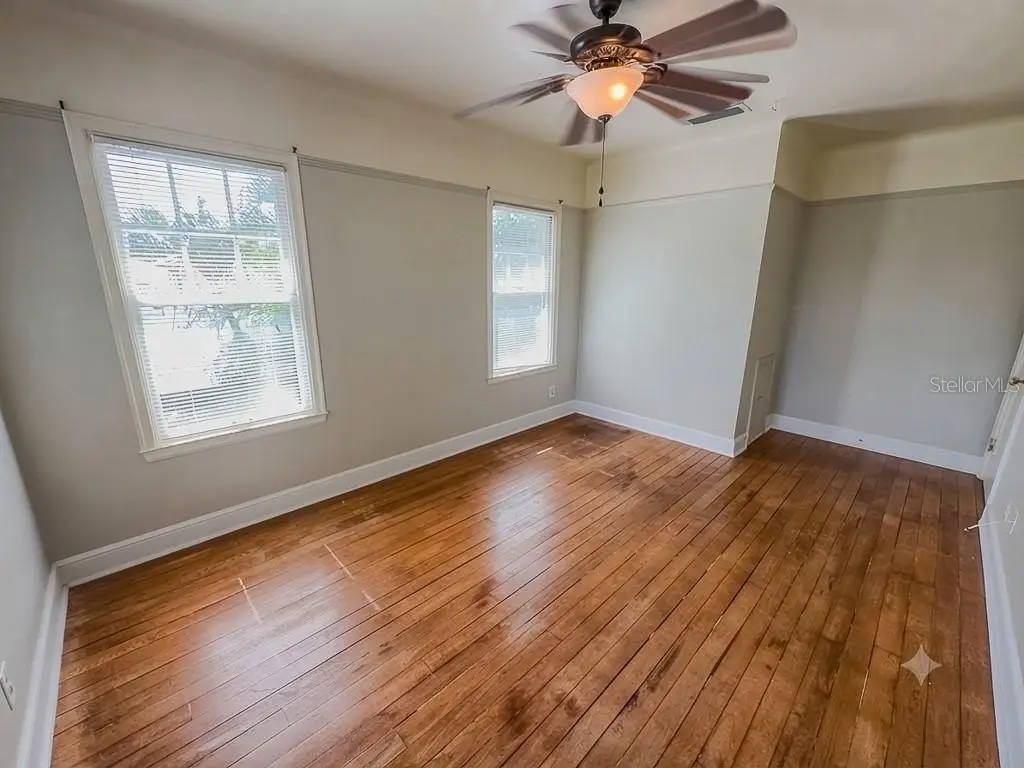
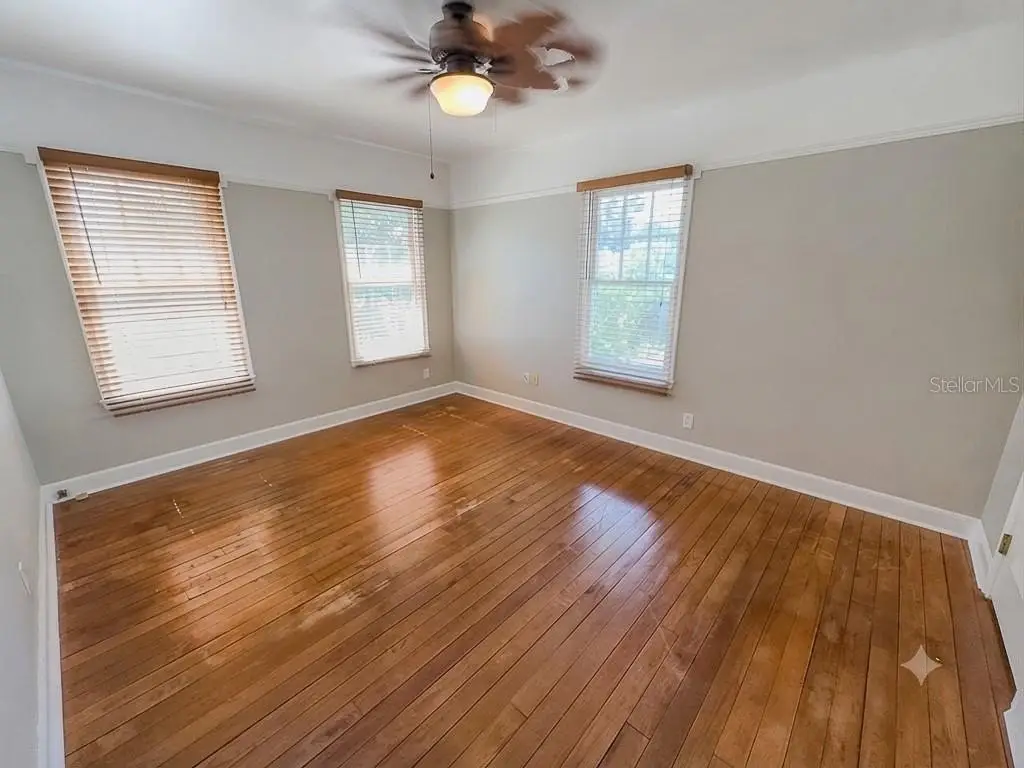
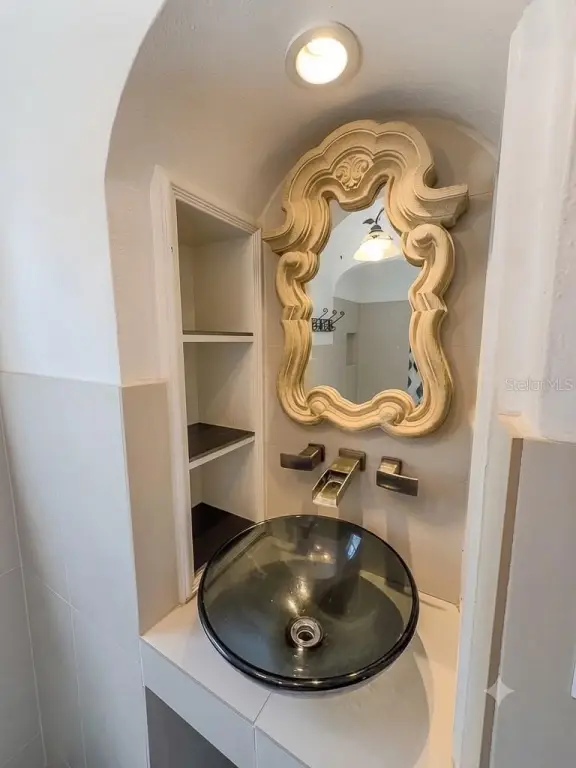
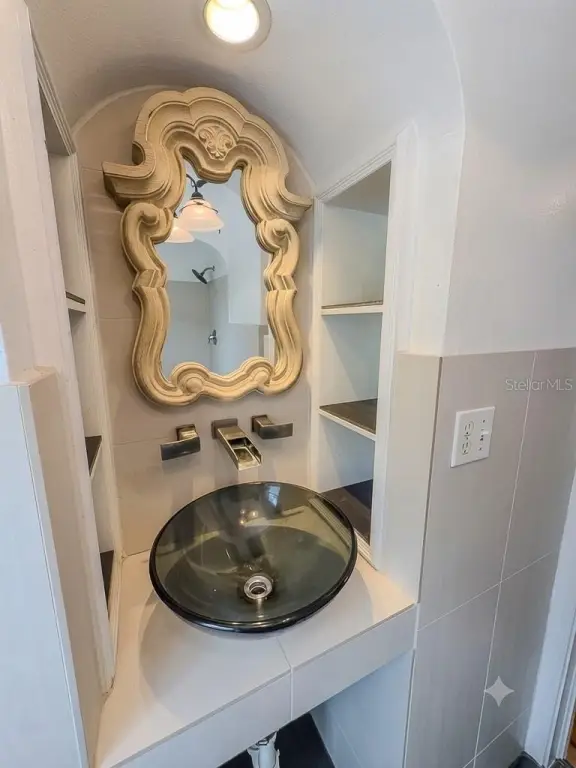
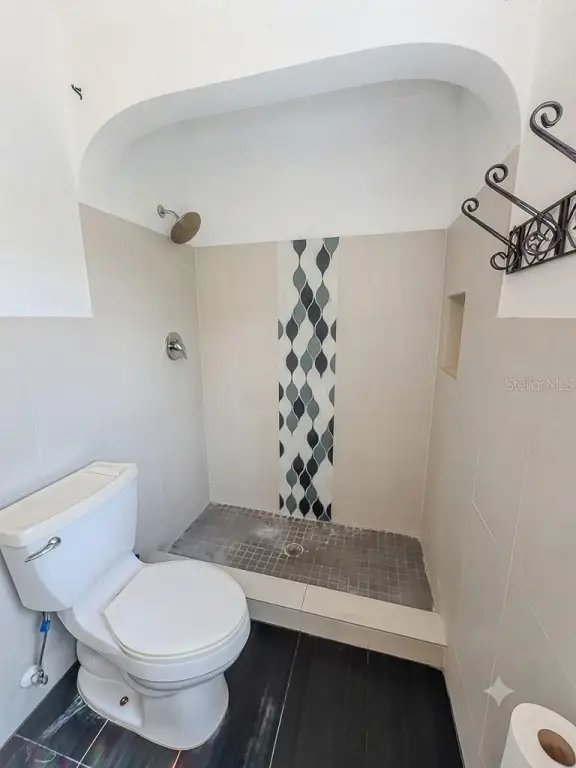
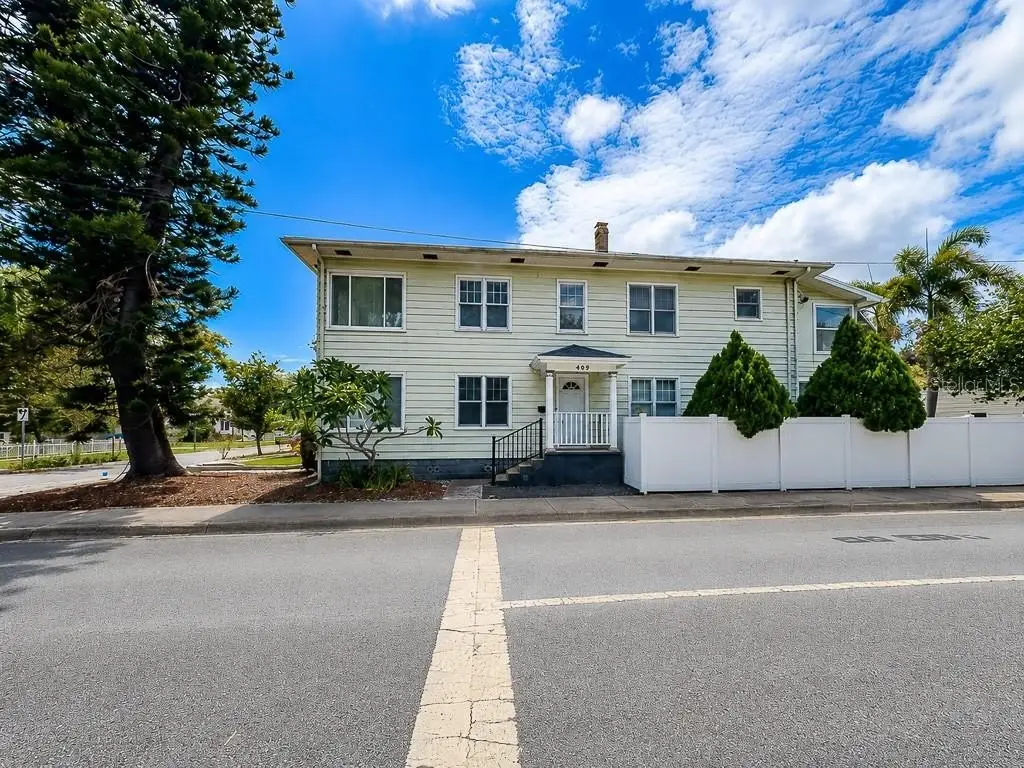
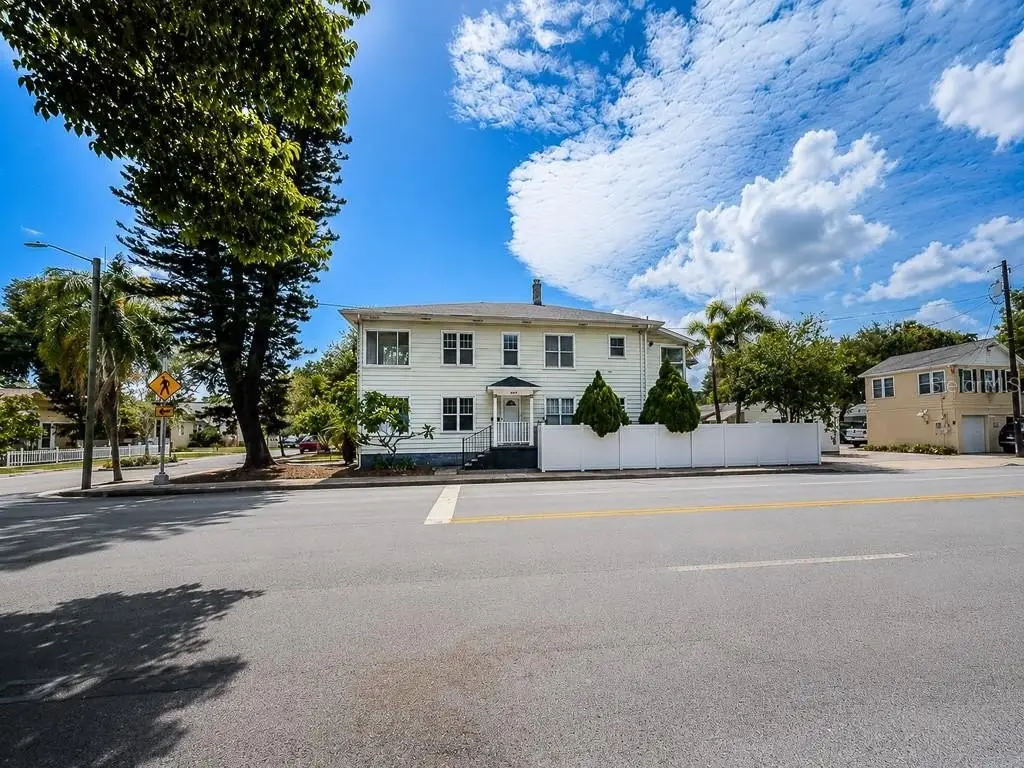
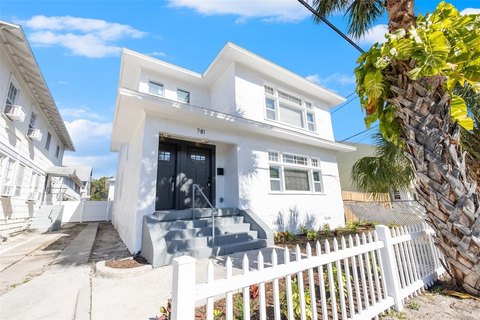
Built in 1939, this two-story duplex contains two 2-bedroom, 1-bath residences arranged on separate levels. The 2,688-square-foot property retains wood flooring, arched openings, high ceilings, built-in shelving, and oversized windows, while updated kitchens and bathrooms add contemporary functionality. Each unit includes open living and dining areas, spacious bedrooms, generous closets, and ceramic tile in selected areas.
Major improvements include a new shingle roof installed in 2025, one new A/C system from 2025, and a second A/C system replaced in 2018. The property also features central heating and cooling, public water and sewer, in-unit laundry appliances, and updated kitchen equipment.
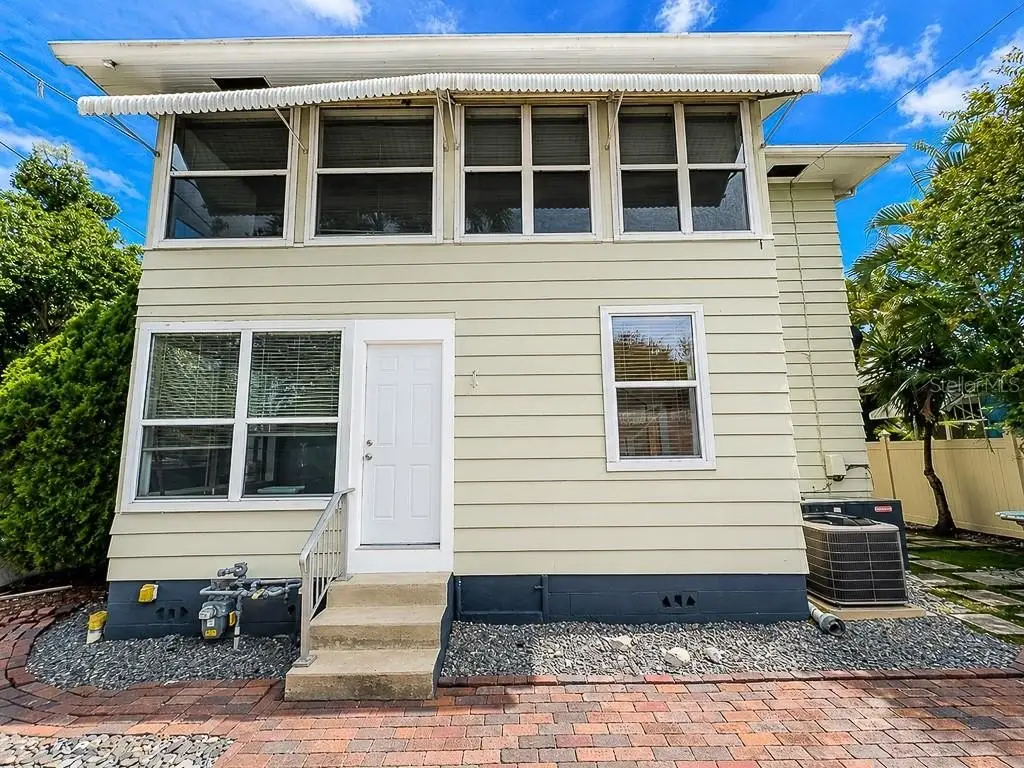
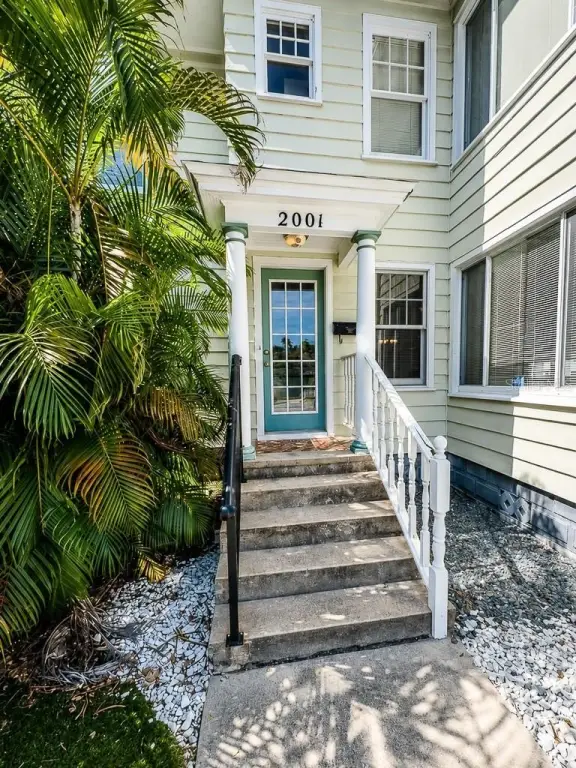
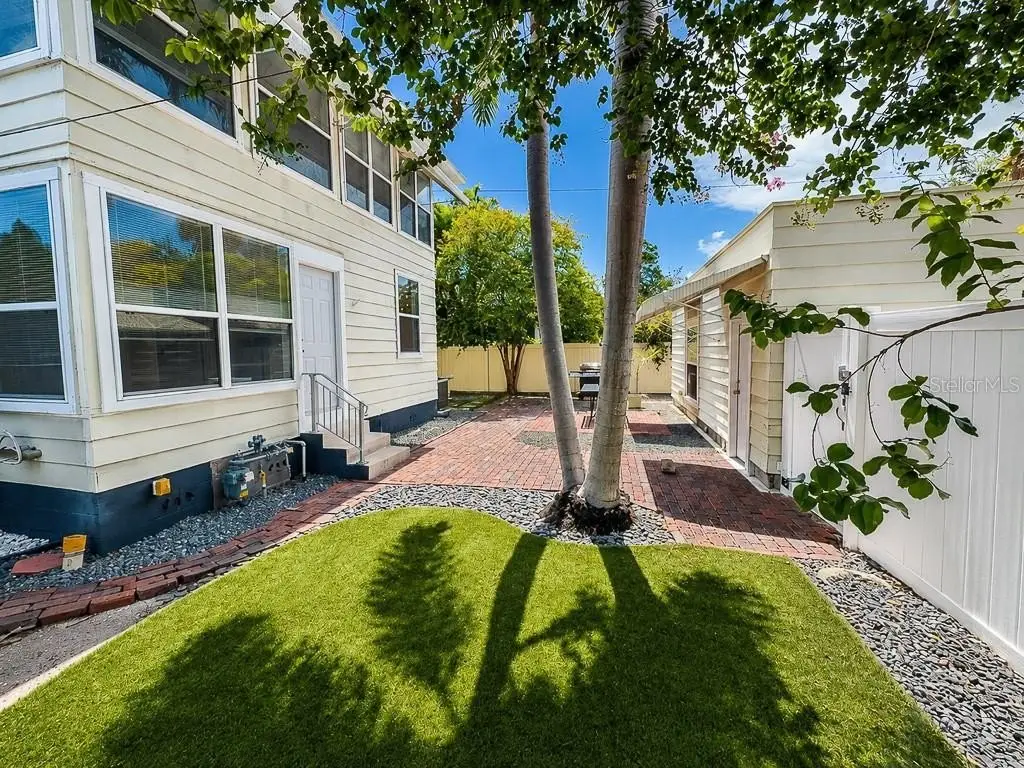
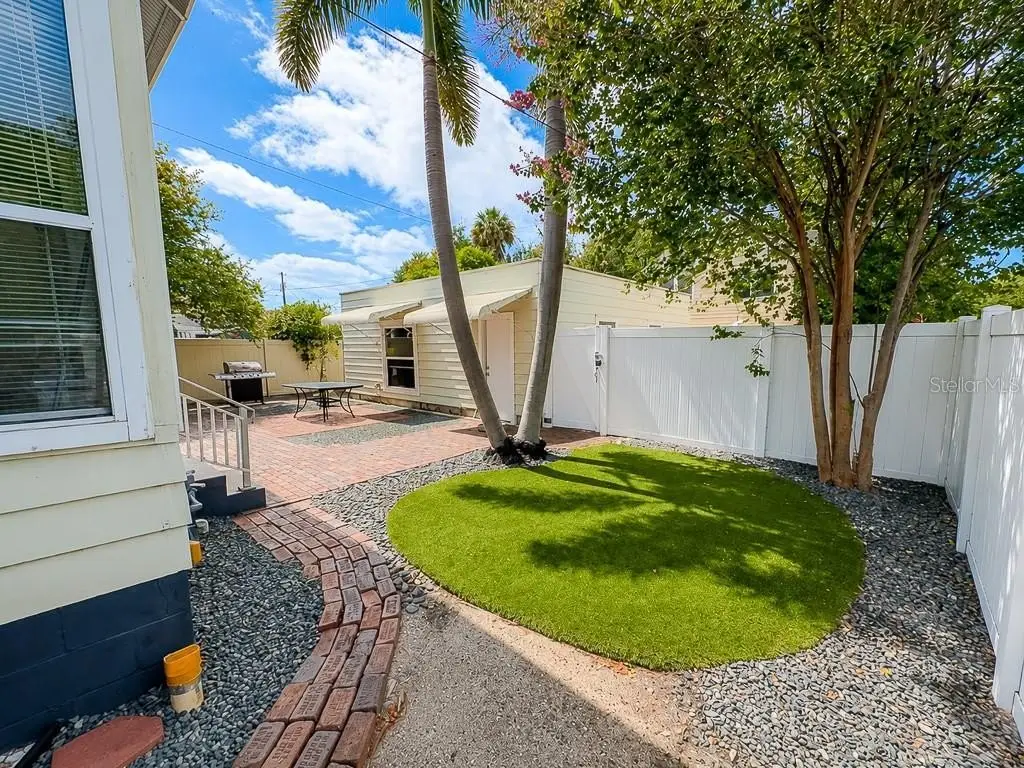
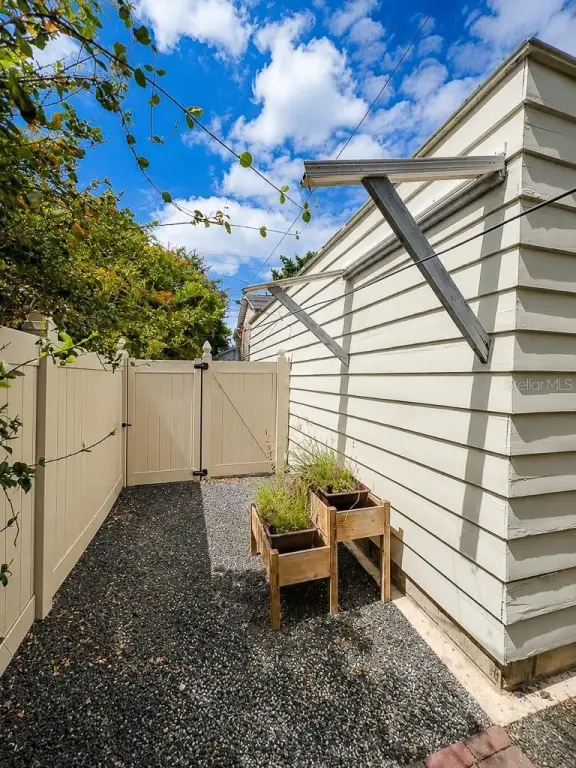
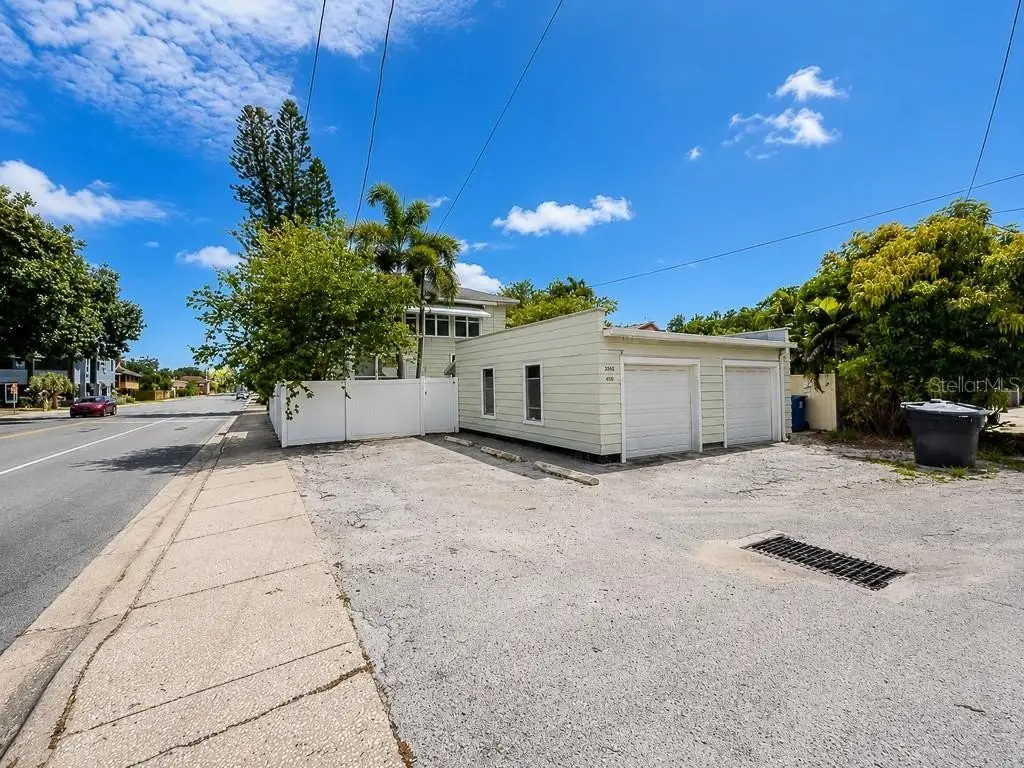
On a 0.15-acre lot in Historic Kenwood, the exterior includes a privacy-fenced backyard, patio, porch, sidewalks, and rain gutters. A rear alley leads to a detached two-car garage with additional off-street parking. The property is located near downtown St. Petersburg, restaurants, breweries, museums, waterfront parks, shopping, and I-275.
Major improvements include a new shingle roof installed in 2025, one new A/C system from 2025, and a second A/C system replaced in 2018. The property also features central heating and cooling, public water and sewer, in-unit laundry appliances, and updated kitchen equipment.
On a 0.15-acre lot in Historic Kenwood, the exterior includes a privacy-fenced backyard, patio, porch, sidewalks, and rain gutters. A rear alley leads to a detached two-car garage with additional off-street parking. The property is located near downtown St. Petersburg, restaurants, breweries, museums, waterfront parks, shopping, and I-275.
Key Highlights
- Two 2BR/1BA units in a two‑story duplex, with one residence upstairs and one downstairs
- 2,688 square feet on a 0.15‑acre lot in Historic Kenwood
- New shingle roof installed in 2025
Financial Insights
Estimated NOI and Cap Rate
NOI / Yr
$31,375
Cap Rate
4.48%
Suggested Prices Based on Cap Rates
Cap Rate 5%
$627,500
$627.5K
Cap Rate 7%
$448,214
$448.2K
Cap Rate 9%
$348,611
$348.6K
Market Conditions
NOI Build-Up for 2,688 SF
Gross rent
$48.1K $17.88/SF
− Vacancy
−$3.2K −$1.21/SF
EGI
$44.8K $16.67/SF
− OpEx
−$13.4K −$5.00/SF
NOI
$31.4K $11.67/SF
Area
Pinellas County, FL
Vacancy
6.74%
Lease Rate
$17.88 /SF/Yr
Expense Ratio
30.00%
Simulate Cap Rate and NOI
Suggested Prices Based on Cap Rates
Cap Rate 5%
$627,500
Cap Rate 7%
$448,214
Cap Rate 9%
$348,611
Alternative Uses
Best Use
Multifamily LT 5
$448.2K
$392.2K – $522.9K
NOI $31,375 @ 7.0% cap · market cap 4.48%
Second Best
Apartment 5plus
$353.2K
$309.0K – $412.0K
NOI $24,722 @ 7.0% cap · market cap 3.53%
Theoretical Best
Office A
$699.2K
$611.8K – $815.7K
NOI $48,942 @ 7.0% cap · market cap 6.99%
Zoning and permitted uses should be independently verified with authorities.
How Realmo checks its estimates
Property Analytics
Who owns this building?
See the owner, sales and loan history
Open Analytics
Lease Details
2
Residential units
Yes
Highway access
Location Intelligence
Trade Area within ½ mile
2,301
Businesses Nearby
Explore this area
Business Placement
Demographics for 33713, FL
31,321
Population
16,192
Households
1.9
Avg Household Size
42
Median Age
35%
College-Educated
91%
High-School Grad
6.5 sq mi
ZIP Area
4,819
Density / Sq Mi
$69,704
Median Household Income
$43,282
Median Earnings
$1,387
Median Rent
$279,000
Median Home Value
Check the figures for this property
Cap Rate, Value Estimation, Potential NOI and more
View Realmo Analytics
Market
Vacancy Rate% for Multifamily in South region






Frequently Asked Questions
What type of property is this?
Duplex - Two residences combine original architectural details with refreshed kitchens, bathrooms, HVAC systems, and outdoor space.
Where is this duplex located?
The property is located at 400 20TH Street N St Petersburg, FL.
What is the asking price?
The asking price for this property is $699,900.
What are key features of this property?
This property features: Two 2BR/1BA units in a two‑story duplex, with one residence upstairs and one downstairs; 2,688 square feet on a 0.15‑acre lot in Historic Kenwood; New shingle roof installed in 2025