Updated Kenwood Duplex with
For Sale
$699,900
400 20TH STREET N, St Petersburg, FL 33713
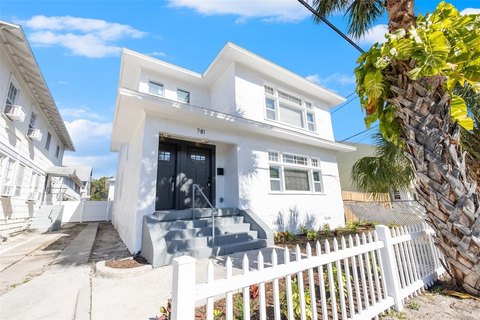
Two updated 2BR/1BA units in a two-story duplex, with a new roof, two A/C systems, and rear alley garage access.
Property Size2,688 SF
Price / SF$260.38
Days on Market97
Property Features for 400 20TH STREET N
General Information
Standard status
Active
Size
2,688 SF
Total Parking Spaces
2
Property subtype
Duplex
Site & Location
Highway Access
Yes
Fenced Yard
Yes
Additional Details
Multifamily Units
2
Building Details
Year Built
1939
Stories
2
Tenancy
Multi
Listing Agency:
CHARLES RUTENBERG REALTY INC
(727) 538-9200
Listed By:
Bill Smith · License #3282791
(727) 487-3339
Source:
Dennisrealty
Added: Jul 22
Changed: Oct 25
Last Checked: Oct 24 at 5:37PM
Displayed information is deemed reliable but is not guaranteed and should be independently verified. All listing content including descriptions, pricing, images are the copyrighted material of CHARLES RUTENBERG REALTY INC

Ask AI about this property
Review the available facts, identify missing information and prepare questions for the agent.
Investment Insights
Based on property information with market context.
This fully updated two-story duplex includes two separate 2-bedroom, 1-bath units—one upstairs and one downstairs. Both units feature original hardwood floors, arched doorways, high ceilings, and oversized windows, with open living and dining room layouts. Kitchens include abundant cabinetry and functional storage elements, while the bedrooms offer original hardwood flooring and generous closet space. Bathrooms have been tastefully renovated with modern finishes, including vessel sinks and oversized walk-in showers. Major improvements include a new roof in 2025, one A/C system replaced in 2025, and the second A/C system replaced in 2018.
A privacy-fenced backyard provides outdoor space for everyday use, and a rear alley offers access to a detached two-car garage for convenient off-street parking and additional storage. The property is located in Historic Kenwood and is described as just minutes from downtown St. Petersburg and major area amenities, with easy access to I-275.
Each residence is configured for self-contained living with dedicated interior space, original historic character details, and updated kitchens and bathrooms, supported by the recently completed exterior and mechanical upgrades.
A privacy-fenced backyard provides outdoor space for everyday use, and a rear alley offers access to a detached two-car garage for convenient off-street parking and additional storage. The property is located in Historic Kenwood and is described as just minutes from downtown St. Petersburg and major area amenities, with easy access to I-275.
Each residence is configured for self-contained living with dedicated interior space, original historic character details, and updated kitchens and bathrooms, supported by the recently completed exterior and mechanical upgrades.
Key Highlights
- 1939 two‑story duplex with two 2BR/1BA units—one upstairs and one downstairs.
- Fully updated interior features original hardwood floors, arched doorways, high ceilings, built‑in shelving, and oversized windows.
- Updated kitchens in both units with abundant cabinetry, pull‑out shelving, lazy Susan corner storage, spice organizers, and tray storage.
Financial Insights
Estimated NOI and Cap Rate
NOI / Yr
$31,375
Cap Rate
4.48%
Suggested Prices Based on Cap Rates
Cap Rate 5%
$627,500
$627.5K
Cap Rate 7%
$448,214
$448.2K
Cap Rate 9%
$348,611
$348.6K
Market Conditions
NOI Build-Up for 2,688 SF
Gross rent
$48.1K $17.88/SF
− Vacancy
−$3.2K −$1.21/SF
EGI
$44.8K $16.67/SF
− OpEx
−$13.4K −$5.00/SF
NOI
$31.4K $11.67/SF
Area
Pinellas County, FL
Vacancy
6.74%
Lease Rate
$17.88 /SF/Yr
Expense Ratio
30.00%
Simulate Cap Rate and NOI
Suggested Prices Based on Cap Rates
Cap Rate 5%
$627,500
Cap Rate 7%
$448,214
Cap Rate 9%
$348,611
Alternative Uses
Best Use
Multifamily LT 5
$448.2K
$392.2K – $522.9K
NOI $31,375 @ 7.0% cap · market cap 4.48%
Second Best
Apartment 5plus
$353.2K
$309.0K – $412.0K
NOI $24,722 @ 7.0% cap · market cap 3.53%
Theoretical Best
Office A
$699.2K
$611.8K – $815.7K
NOI $48,942 @ 7.0% cap · market cap 6.99%
Zoning and permitted uses should be independently verified with authorities.
How Realmo checks its estimates
Property Analytics
Contact the owner directly
Get the owner's phone numbers and email
Open Analytics
Lease Details
2
Residential units
Multi-tenant
Tenancy
Yes
Fenced yard
Yes
Highway access
Location Intelligence
Trade Area within ½ mile
2,301
Businesses Nearby
Explore this area
Business Placement
Demographics for 33713, FL
31,321
Population
16,192
Households
1.9
Avg Household Size
42
Median Age
35%
College-Educated
91%
High-School Grad
6.5 sq mi
ZIP Area
4,819
Density / Sq Mi
$69,704
Median Household Income
$43,282
Median Earnings
$1,387
Median Rent
$279,000
Median Home Value
Check the figures for this property
Cap Rate, Value Estimation, Potential NOI and more
View Realmo Analytics
Market
Vacancy Rate% for Multifamily in South region






Frequently Asked Questions
What type of property is this?
Duplex - Two updated 2BR/1BA units in a two-story duplex, with a new roof, two A/C systems, and rear alley garage access.
Where is this duplex located?
The property is located at 400 20TH STREET N St Petersburg, FL.
What is the asking price?
The asking price for this property is $699,900.
What are key features of this property?
This property features: 1939 two‑story duplex with two 2BR/1BA units—one upstairs and one downstairs.; Fully updated interior features original hardwood floors, arched doorways, high ceilings, built‑in shelving, and oversized windows.; Updated kitchens in both units with abundant cabinetry, pull‑out shelving, lazy Susan corner storage, spice organizers, and tray storage.