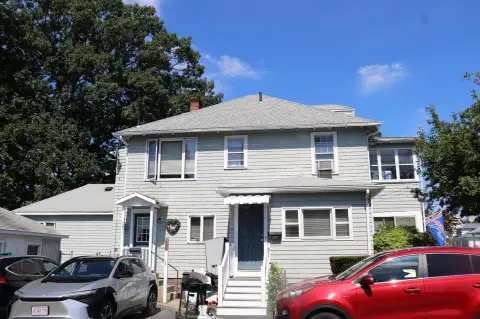
Well-Maintained Two-Family
For Sale
$1,189,000
Pending
40 Woodbine St, Quincy, MA 02170
Two units with eat-in kitchens, gas cooking, basement laundry, and generous parking with double-width paved drive.
Property Size2,262 SF
Days on Market74
Property Features for 40 Woodbine St
General Information
Standard status
Pending
Size
2,262 SF
Total Parking Spaces
7
Property subtype
Multifamily
Additional Details
Multifamily Units
2
Taxes and HOA fees
Annual Taxes
$10,260
Amenities
front porch
private deck
basement laundry
walk-out lower level
Building Details
Building Size
2,262 SF
Year Built
1925
Listing Agency:
V & E Realty
Listed By:
Derek Wong · License #455500324
(617) 290-8289
Source:
Classifiedrealtygroup
Added: Jul 25
Changed: Oct 4
Last Checked: Oct 5 at 3:51PM
Displayed information is deemed reliable but is not guaranteed and should be independently verified. All listing content including descriptions, pricing, images are the copyrighted material of V & E Realty
Investment Insights
Based on property information with market context.
A beautifully maintained two-family duplex featuring a first-floor unit with 5 rooms, including 3 bedrooms and a spacious eat-in kitchen, and a second-floor unit with 6 rooms, including 4 bedrooms. Both units offer well-designed layouts with eat-in kitchens, granite countertops, ample cabinetry, and gas cooking. Additional features include ceramic tile floors, vinyl siding, and a walk-up attic that provides extra storage with potential for future expansion.
The home is located just steps to Wollaston T Station and is close to shopping, dining, schools, and everyday conveniences. Outdoor living includes a welcoming front porch and a private deck for the second-floor unit.
Additional improvements and practicality include a large basement with laundry and an easy walk-out lower level with direct access from the driveway. Parking is exceptional, with a huge double-width paved driveway accommodating up to six vehicles and an additional paved side driveway on the left for even more parking.
The home is located just steps to Wollaston T Station and is close to shopping, dining, schools, and everyday conveniences. Outdoor living includes a welcoming front porch and a private deck for the second-floor unit.
Additional improvements and practicality include a large basement with laundry and an easy walk-out lower level with direct access from the driveway. Parking is exceptional, with a huge double-width paved driveway accommodating up to six vehicles and an additional paved side driveway on the left for even more parking.
Key Highlights
- Two‑family home built in 1925 with two separate units featuring eat‑in kitchens and gas cooking
- First‑floor unit: 5 rooms with 3 bedrooms and a spacious eat‑in kitchen
- Second‑floor unit: 6 rooms with 4 bedrooms plus open‑concept kitchen, dining area, and living room
Financial Insights
Estimated NOI and Cap Rate
NOI / Yr
$38,196
Cap Rate
3.21%
Suggested Prices Based on Cap Rates
Cap Rate 5%
$763,920
$763.9K
Cap Rate 7%
$545,657
$545.7K
Cap Rate 9%
$424,400
$424.4K
Market Conditions
NOI Build-Up for 2,262 SF
Gross rent
$58.4K $25.80/SF
− Vacancy
−$3.8K −$1.68/SF
EGI
$54.6K $24.12/SF
− OpEx
−$16.4K −$7.24/SF
NOI
$38.2K $16.89/SF
Area
Quincy, MA
Vacancy
6.50%
Lease Rate
$25.80 /SF/Yr
Expense Ratio
30.00%
Simulate Cap Rate and NOI
Suggested Prices Based on Cap Rates
Cap Rate 5%
$763,920
Cap Rate 7%
$545,657
Cap Rate 9%
$424,400
Alternative Uses
Best Use
Multifamily LT 5
$545.7K
$477.5K – $636.6K
NOI $38,196 @ 7.0% cap · market cap 3.21%
Second Best
Apartment 5plus
$501.2K
$438.6K – $584.7K
NOI $35,084 @ 7.0% cap · market cap 2.95%
Theoretical Best
Office A
$1.34M
$1.17M – $1.56M
NOI $93,593 @ 7.0% cap · market cap 7.87%
Zoning and permitted uses should be independently verified with authorities.
Property Analytics
Unlock full access to Insights
Subscribe to Realmo Intelligence
Open Analytics
Current Use
Lease Details
2
Residential units
Location Intelligence
Trade Area within ½ mile
1,151
Businesses Nearby
Explore this area
Business Placement
Demographics for 02170, MA
19,950
Population
8,471
Households
2.4
Avg Household Size
39
Median Age
46%
College-Educated
86%
High-School Grad
2.1 sq mi
ZIP Area
9,500
Density / Sq Mi
$101,840
Median Household Income
$54,561
Median Earnings
$1,801
Median Rent
$661,800
Median Home Value
Check the figures for this property
Cap Rate, Value Estimation, Potential NOI and more
View Realmo Analytics
Market
Vacancy Rate% for Multifamily in Northeast region

Questions? Ask Rey
Realmo’s AI knows this listing — price, zoning, demand, history. Ask anything.


Frequently Asked Questions
What type of property is this?
Duplex - Two units with eat-in kitchens, gas cooking, basement laundry, and generous parking with double-width paved drive.
Where is this duplex located?
The property is located at 40 Woodbine St Quincy, MA.
What is the asking price?
The asking price for this property is $1,189,000.
What are key features of this property?
This property features: Two‑family home built in 1925 with two separate units featuring eat‑in kitchens and gas cooking; First‑floor unit: 5 rooms with 3 bedrooms and a spacious eat‑in kitchen; Second‑floor unit: 6 rooms with 4 bedrooms plus open‑concept kitchen, dining area, and living room


