Restaurant With Owner
For Sale
$349,000
4 Lancaster St, Cherry Valley, NY 13320
Residential Income, Cherry Valley, NY
Property Size2,600 SF
Lot Size0.35 Acres
Price / SF$134.23
Days on Market107
Property Features for 4 Lancaster St
General Information
Property type
Residential Multi Family
Property subtype
Other
High school district
CHERRY VALLEY-SPRINGFIELD CENTRAL SCHOOL DISTRICT
Standard status
Active
APN
362401-058.014-0001-054.000
Lot size
0.35 Acres
Taxes and HOA fees
Tax Year
2026
Tax Annual Amount
5852
Utilities
Sewer type
Septic Tank
Heating system
Forced Air, Propane (Heating), Oil
Water source
Public
Building Details
Year built
1900
Flooring type
Vinyl, Carpet, Linoleum, Hardwood
Building materials
Stone
Roof type
Asphalt
Listing Agency:
Keller Williams Upstate NY Properties · Keller Williams Realty
(607) 435-0014
Listed By:
Linda Flynn · License #10401360399
Added: Jul 2
Changed: Sep 17
Last Checked: Oct 16 at 6:06AM
MLS# 11866776
Copyright © 2026 My State MLS. All rights reserved. All information provided by the listing agent/broker is deemed reliable but is not guaranteed and should be independently verified.

Ask AI about this property
Review the available facts, identify missing information and prepare questions for the agent.
Investment Insights
Based on property information with market context.
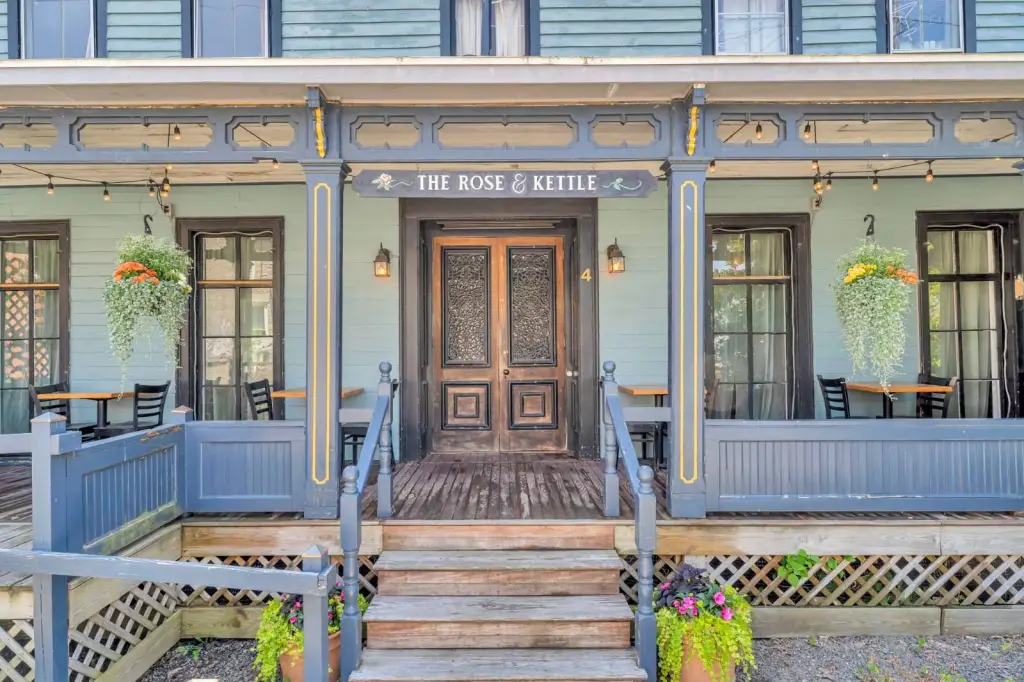
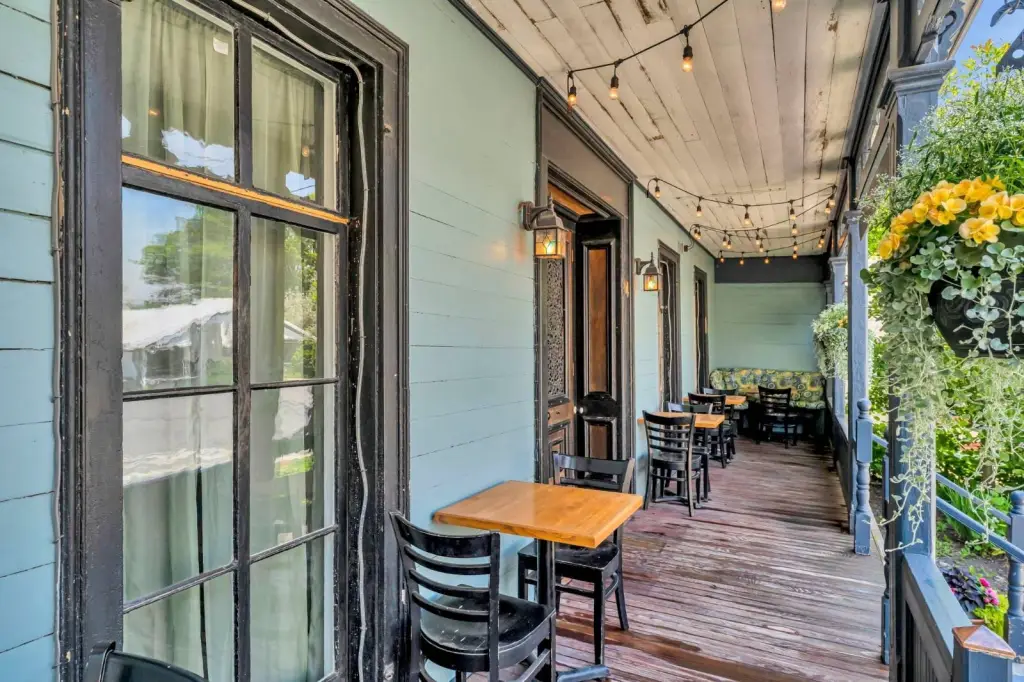
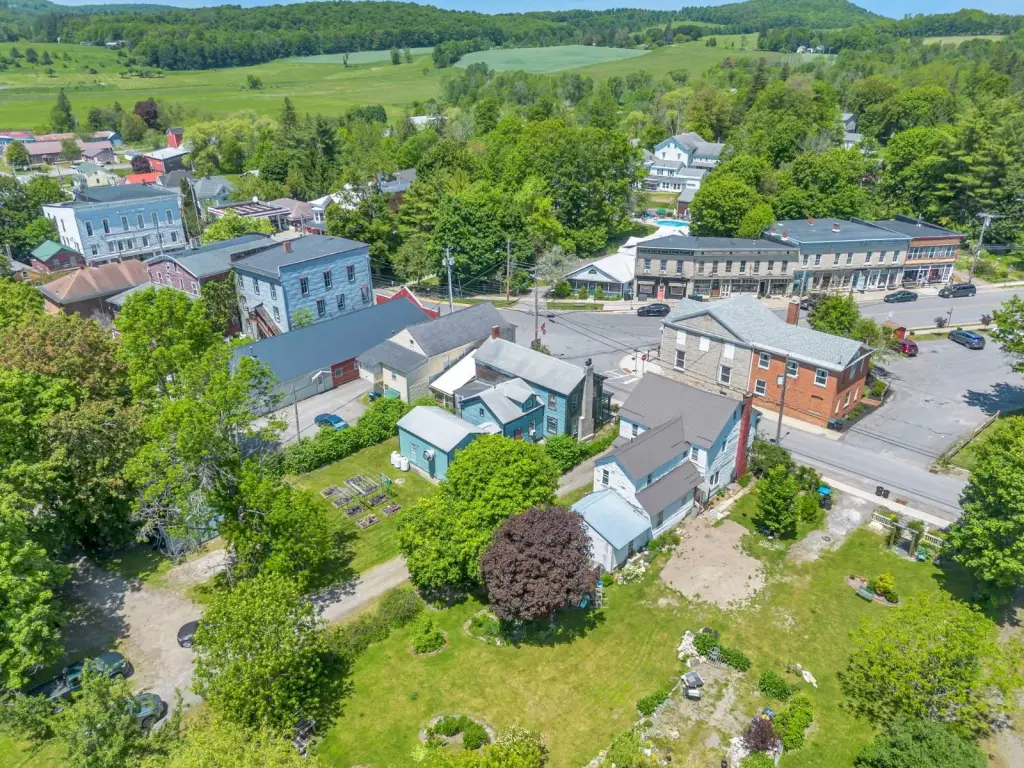
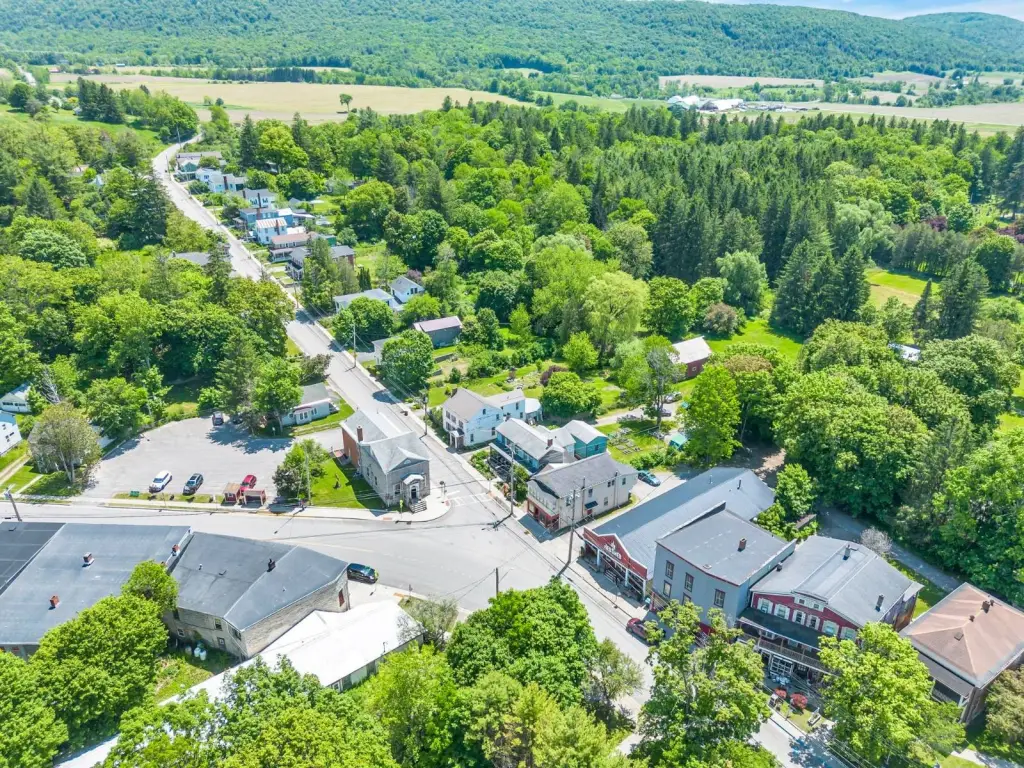
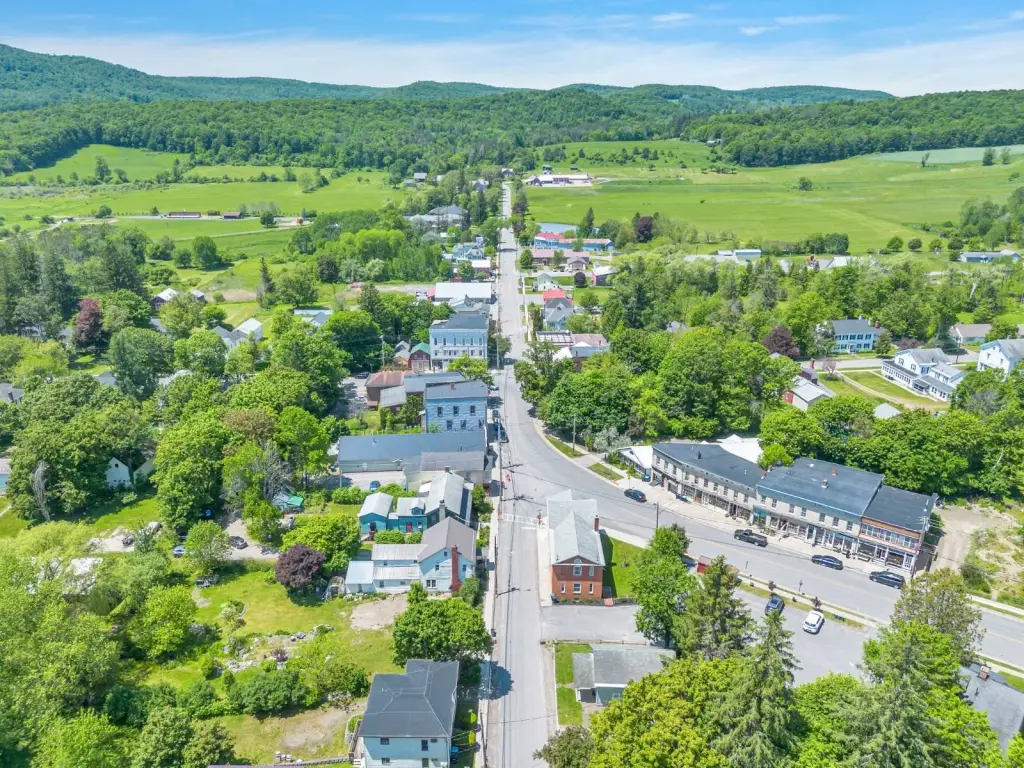
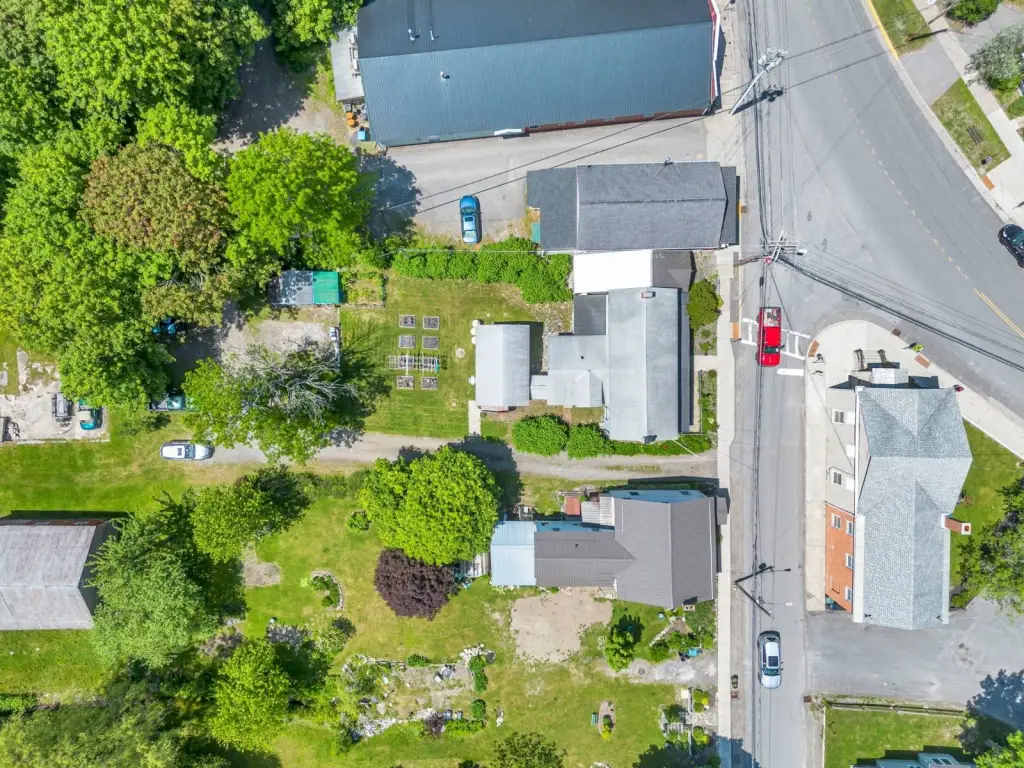
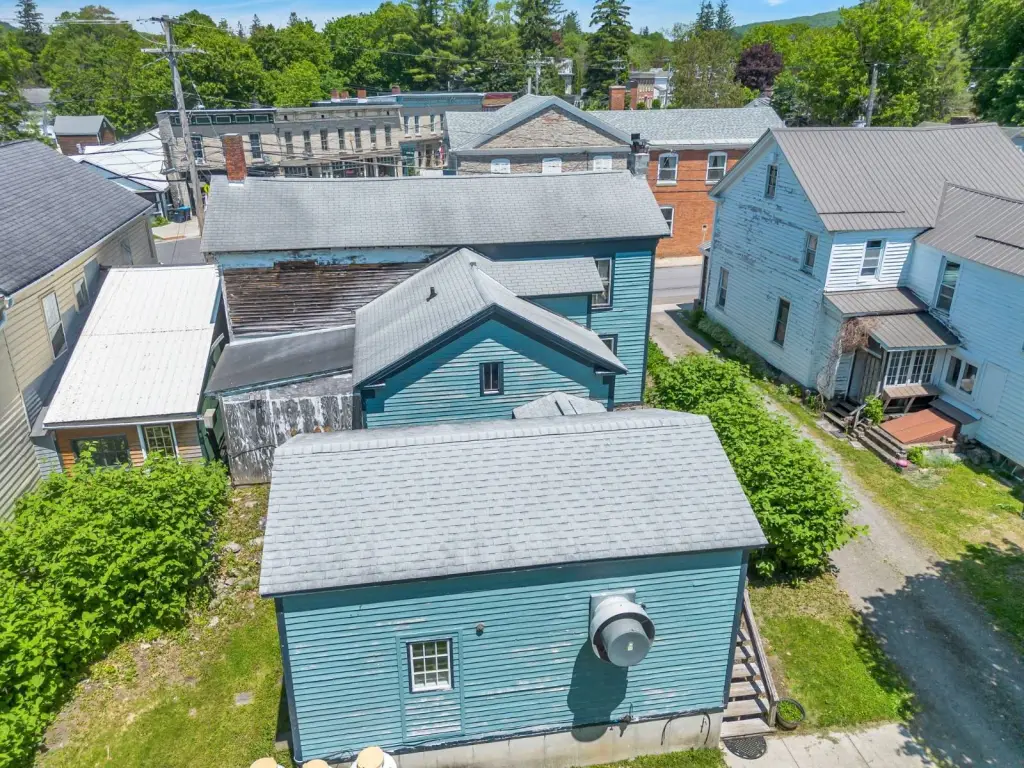
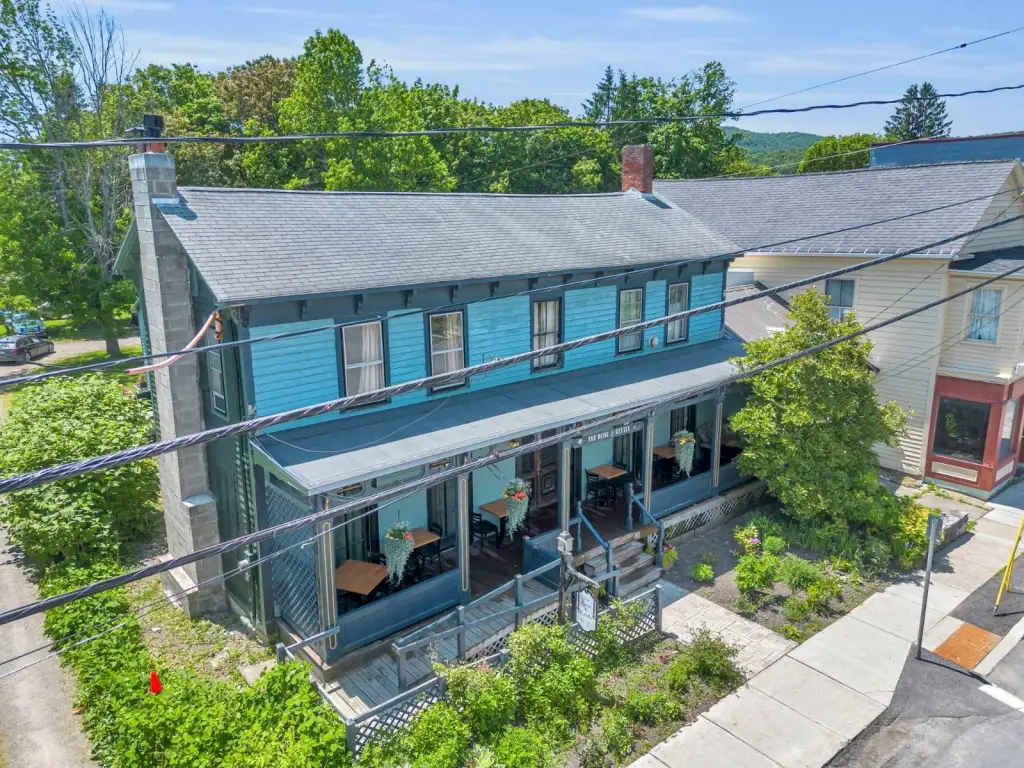
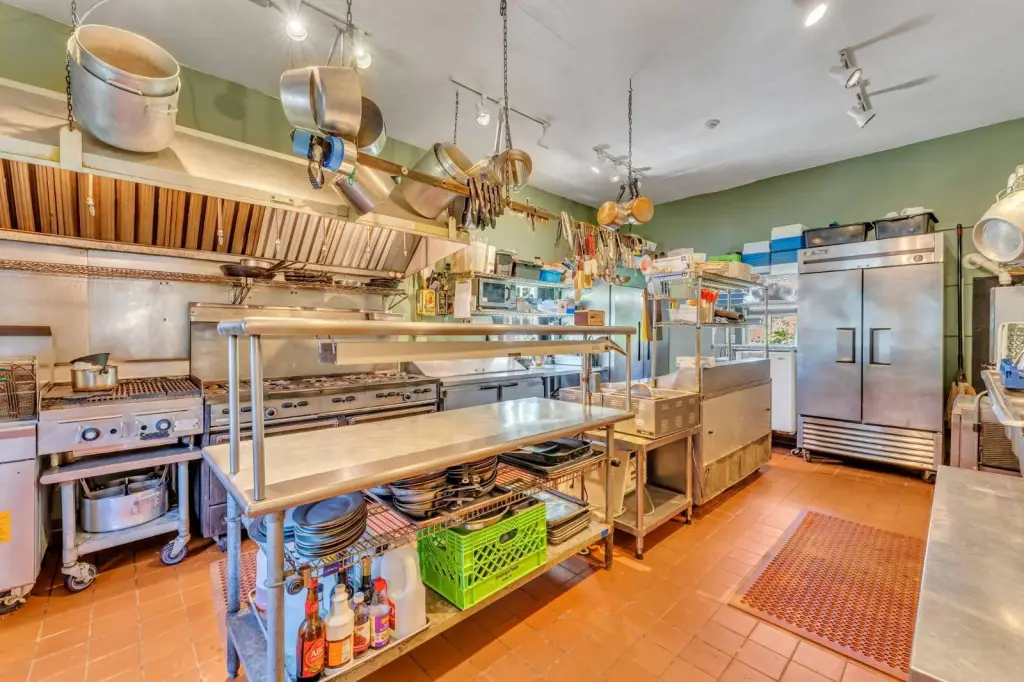
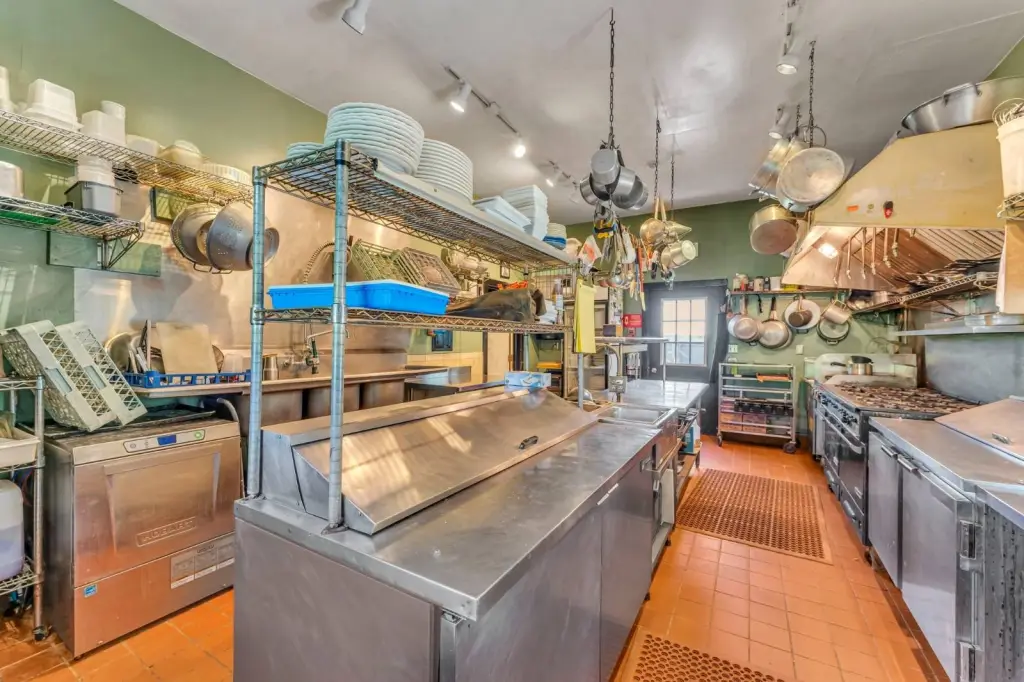
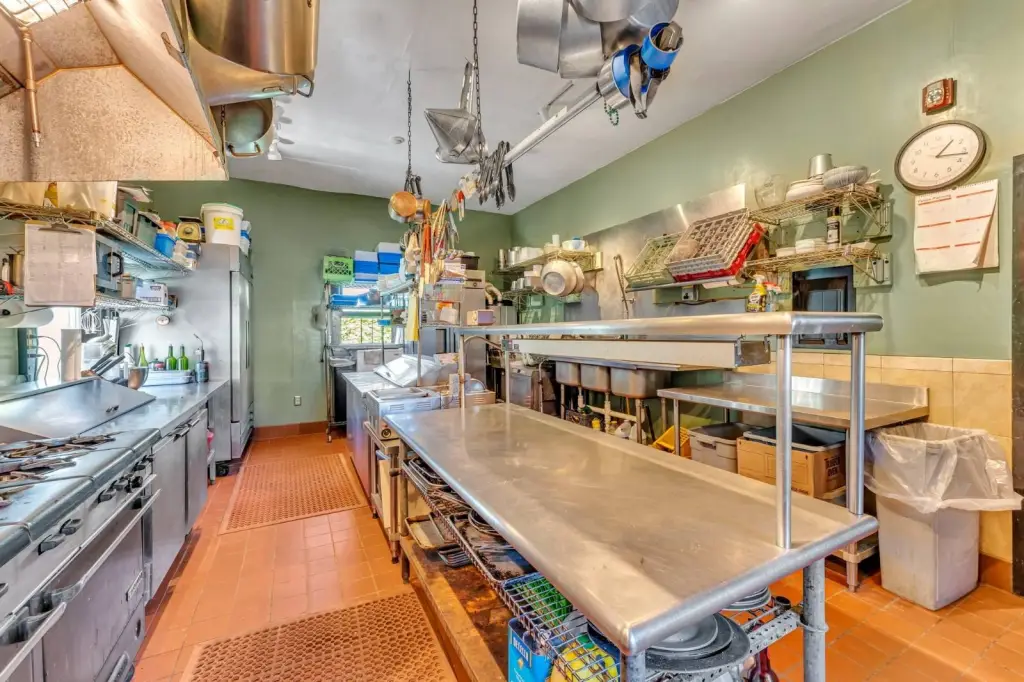
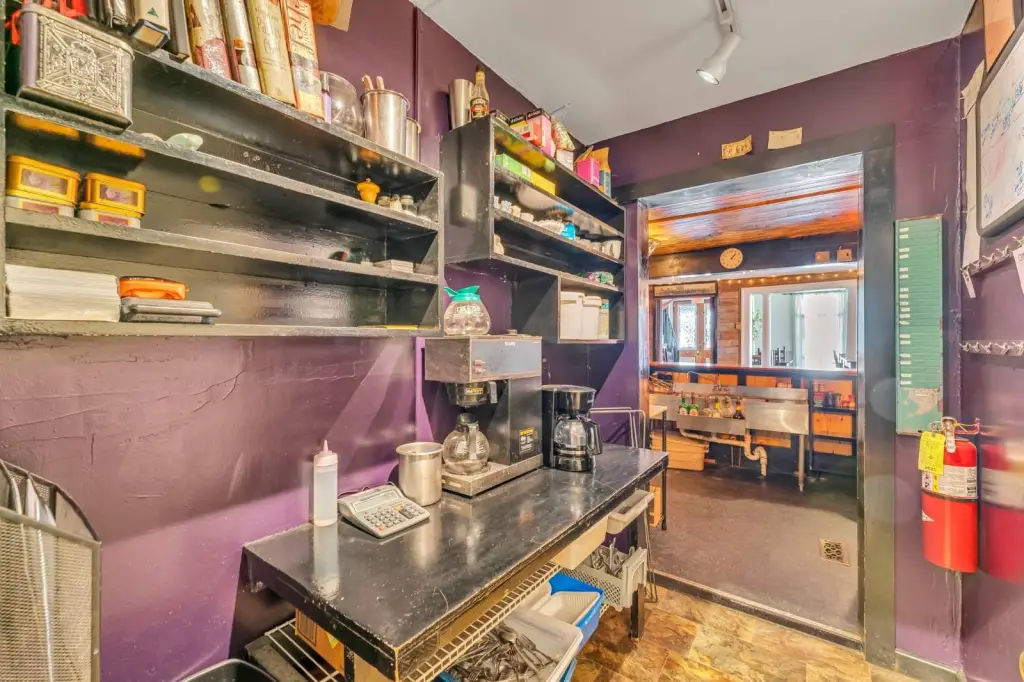
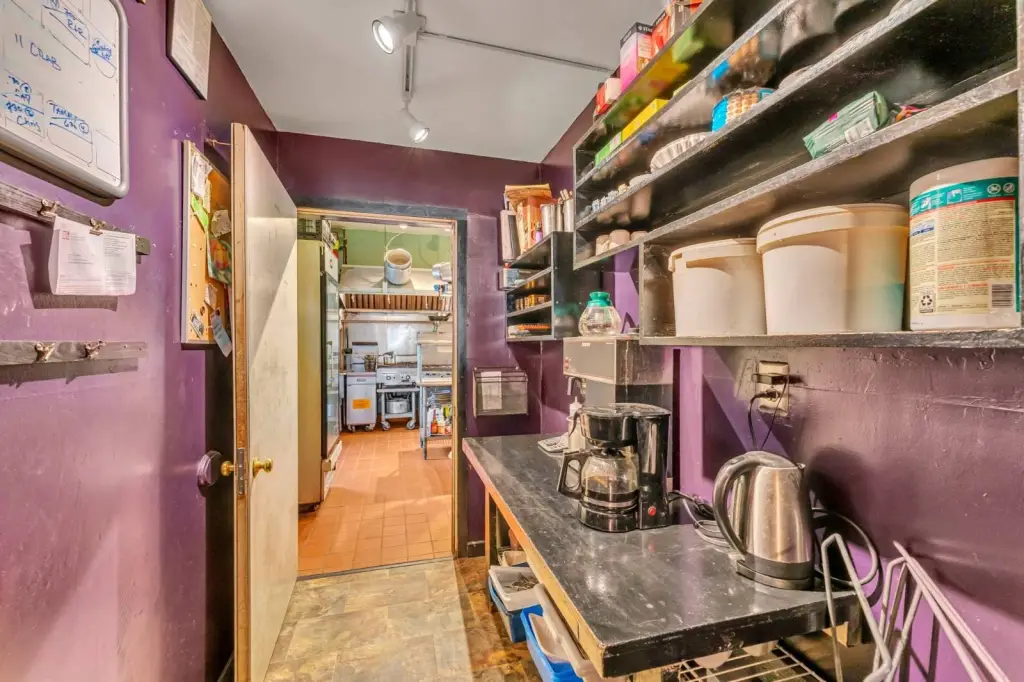
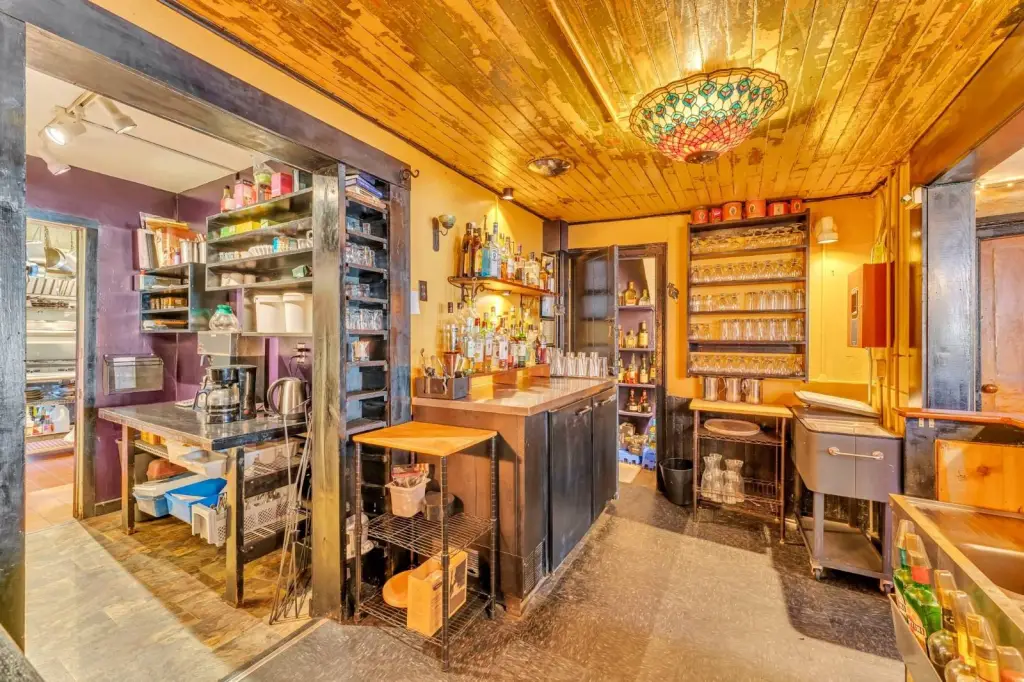
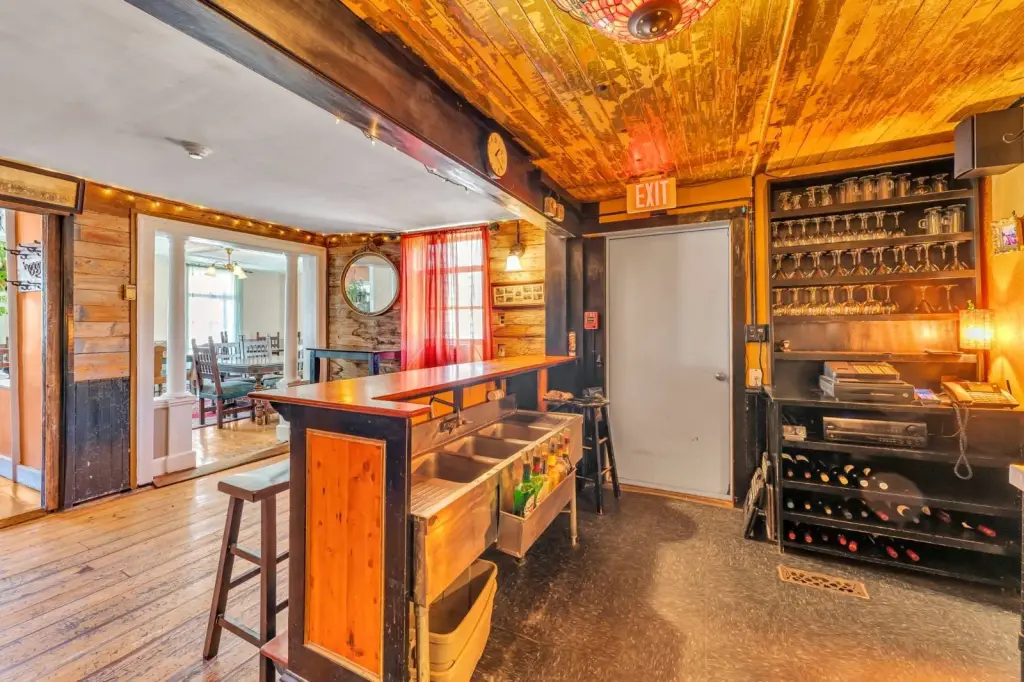
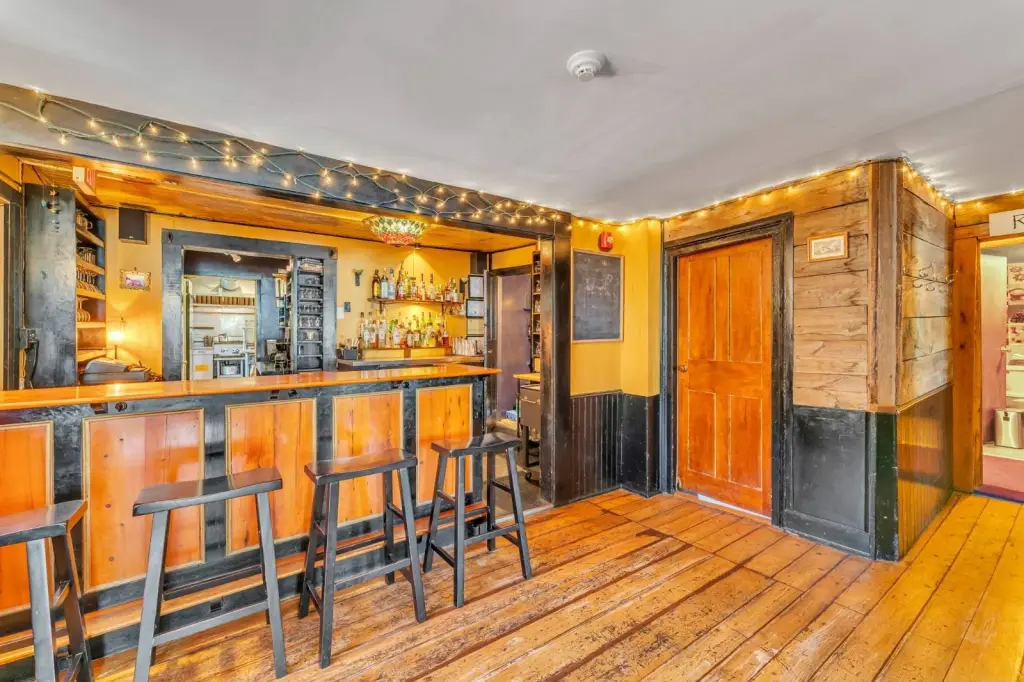
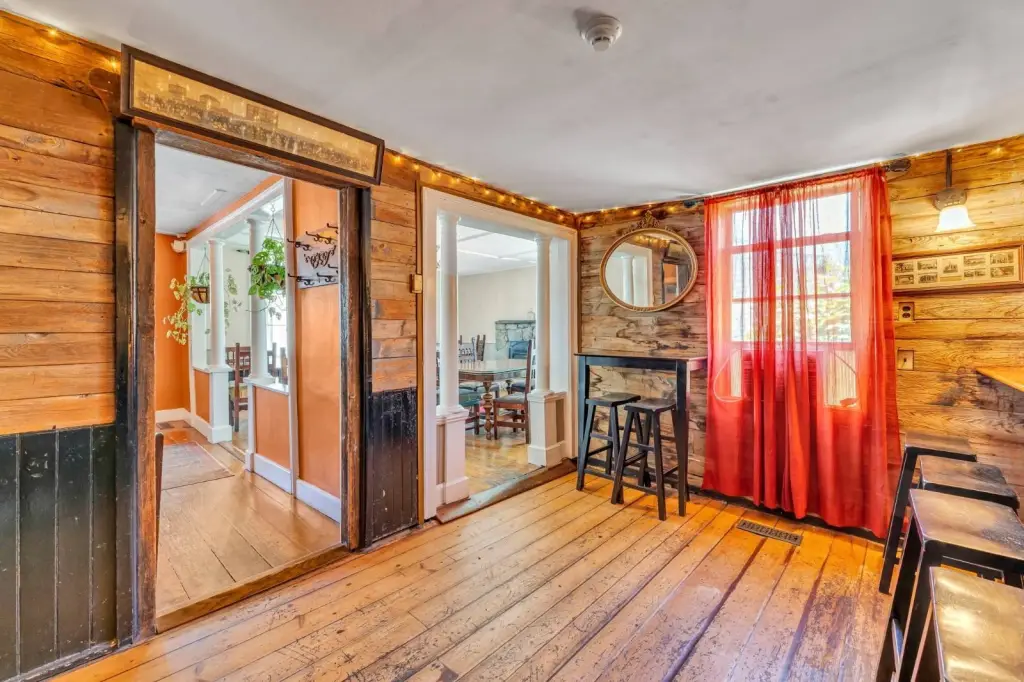
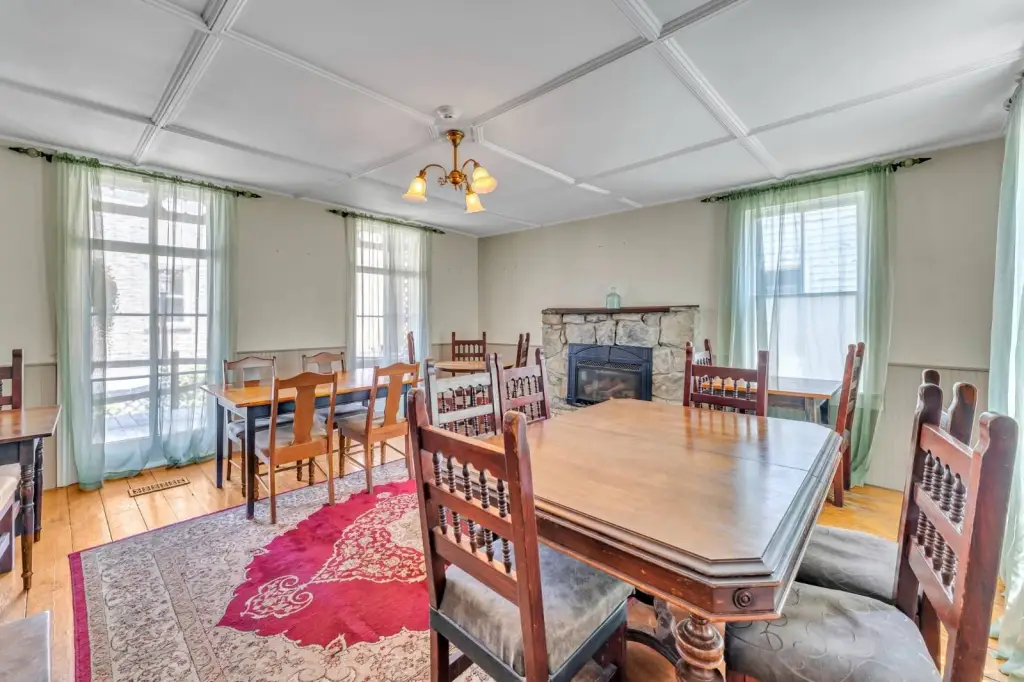
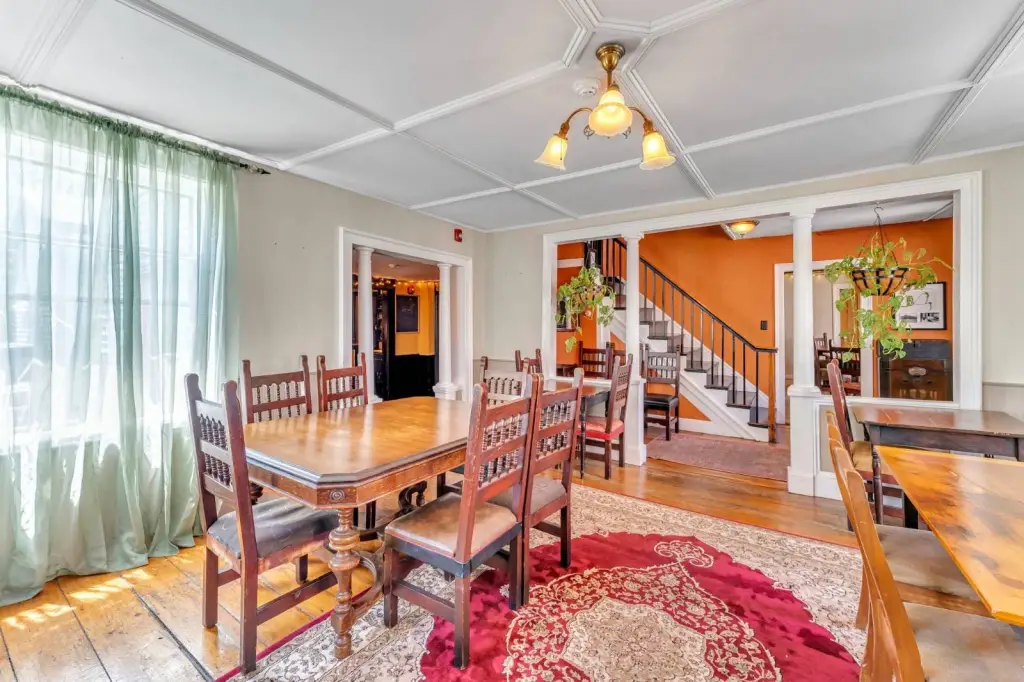
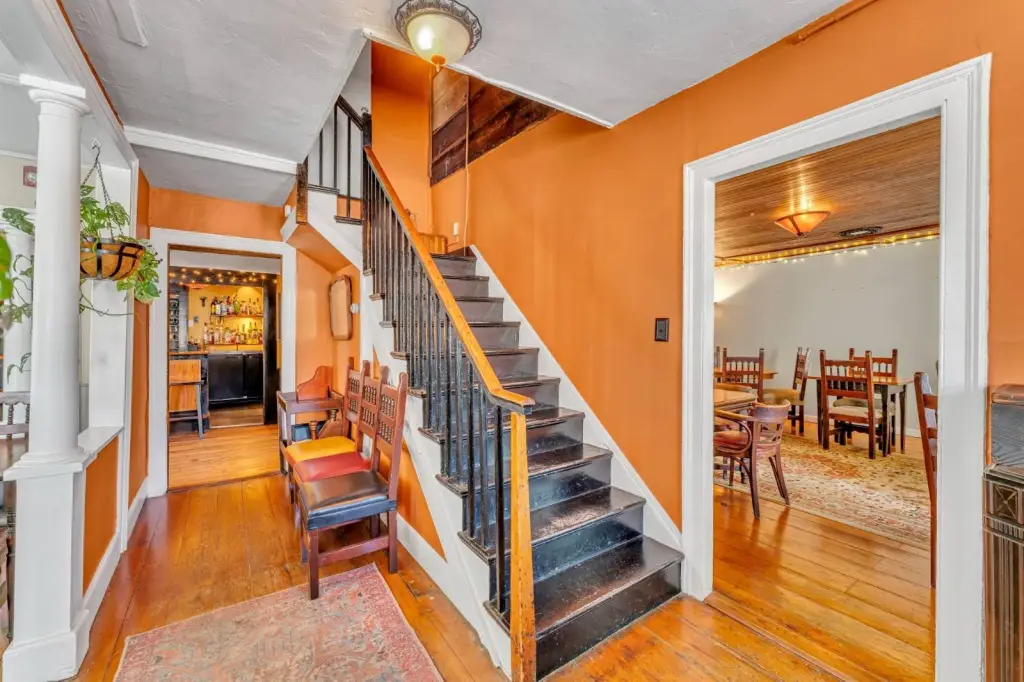
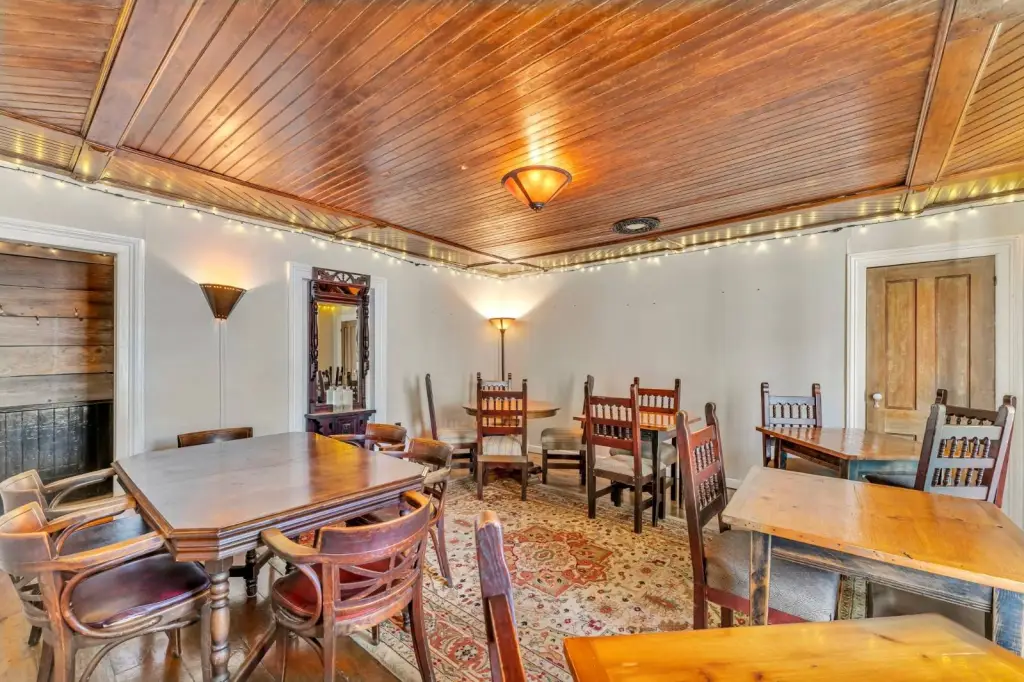
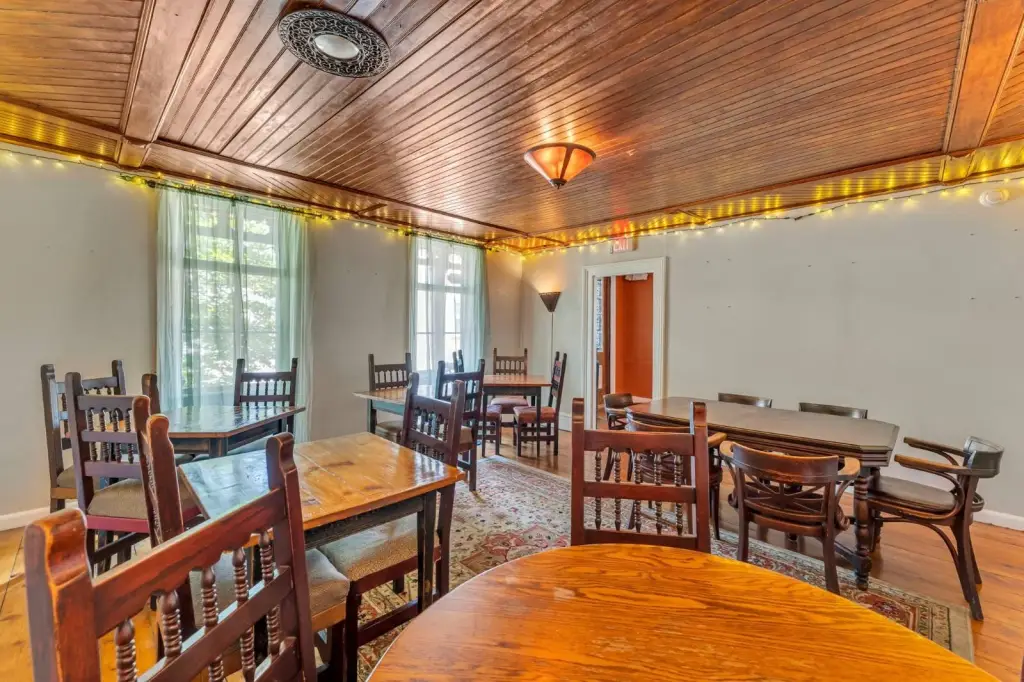
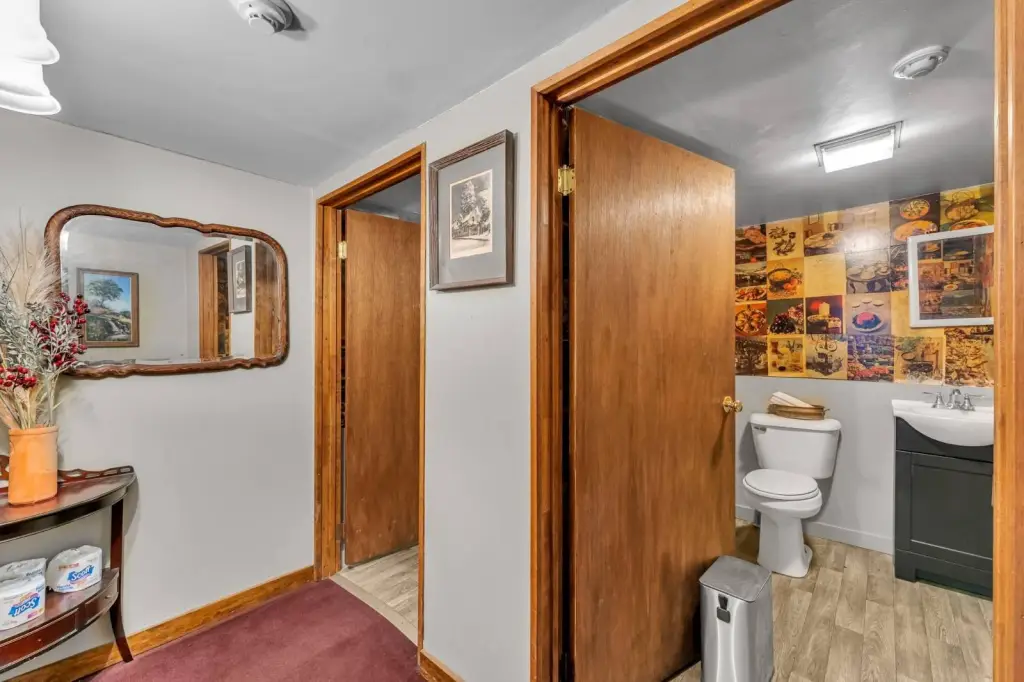
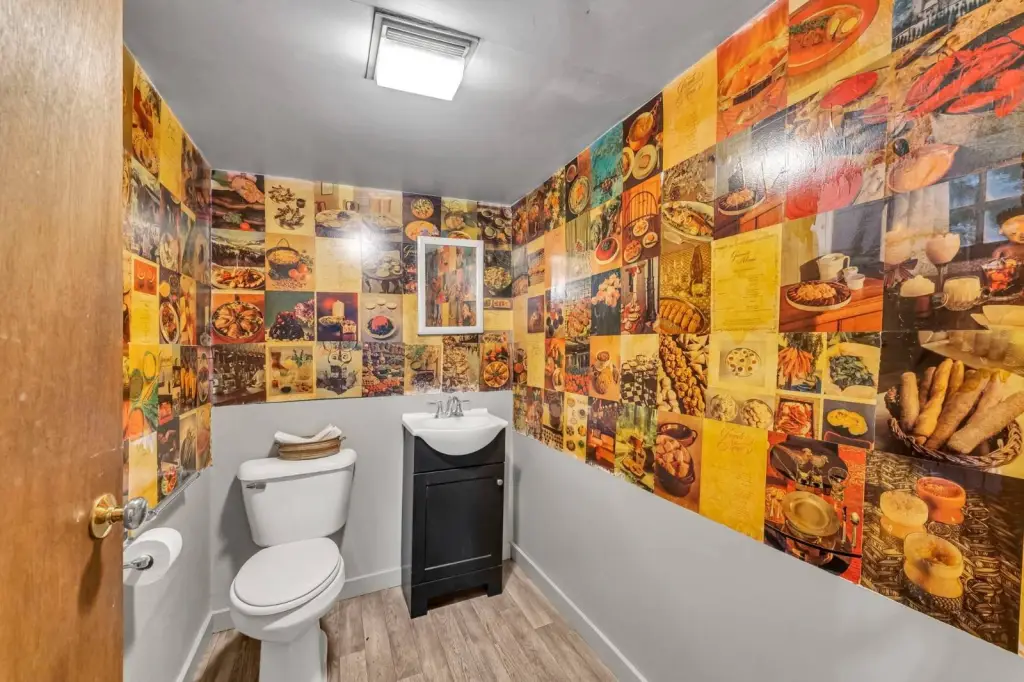
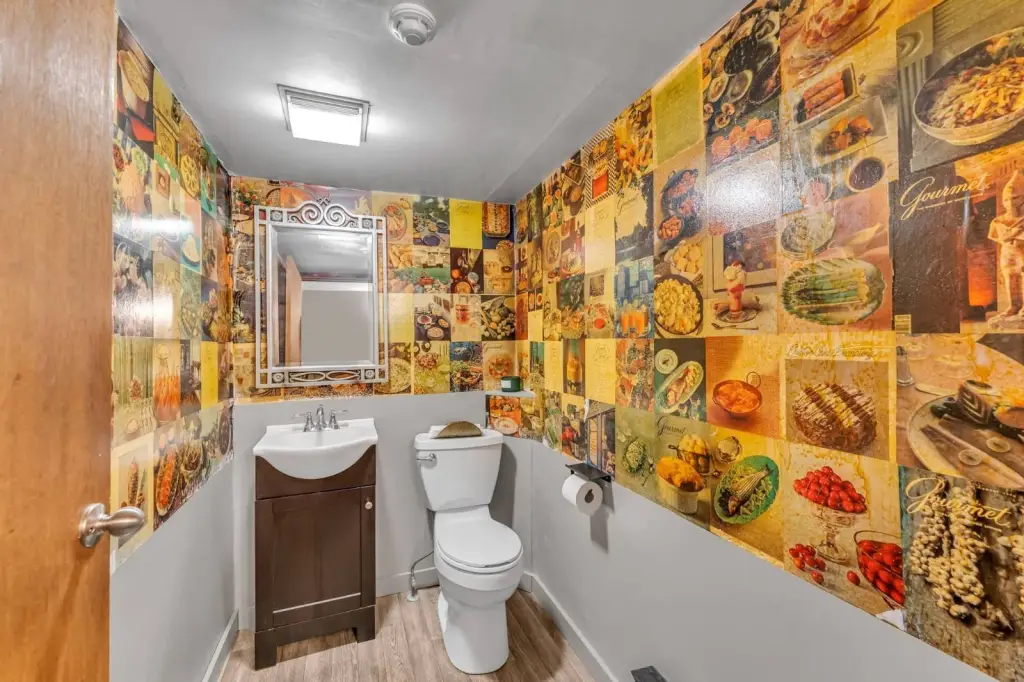
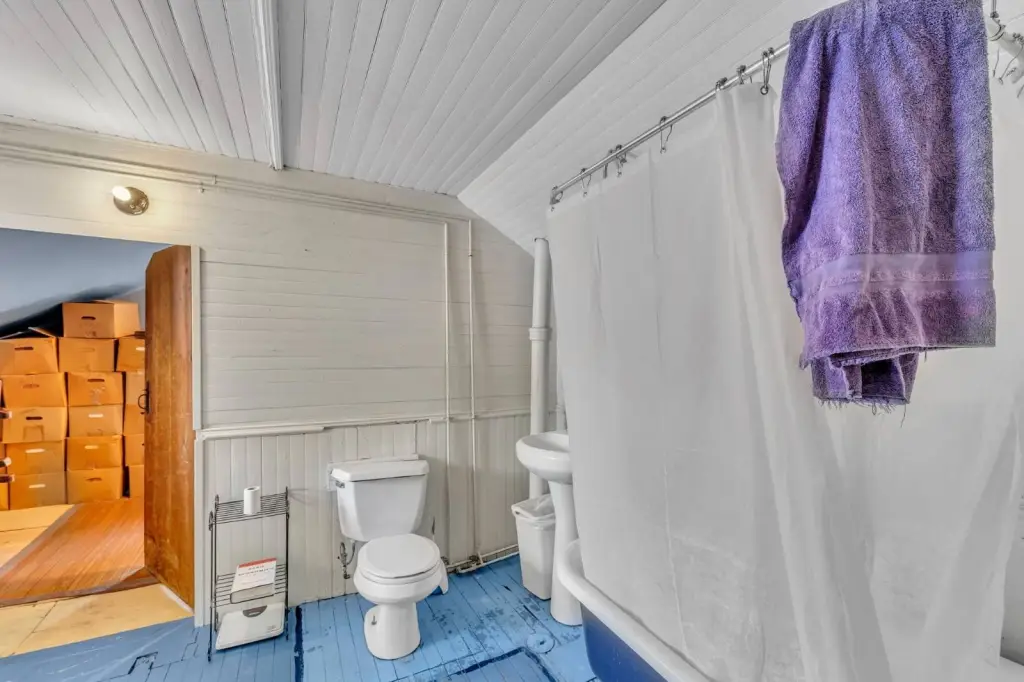
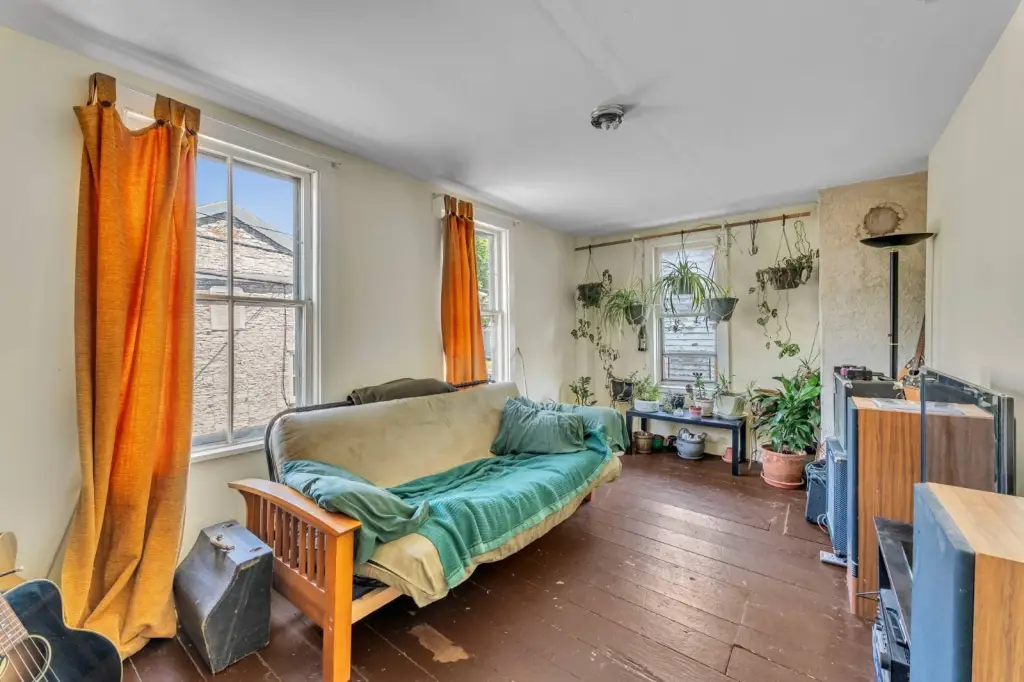
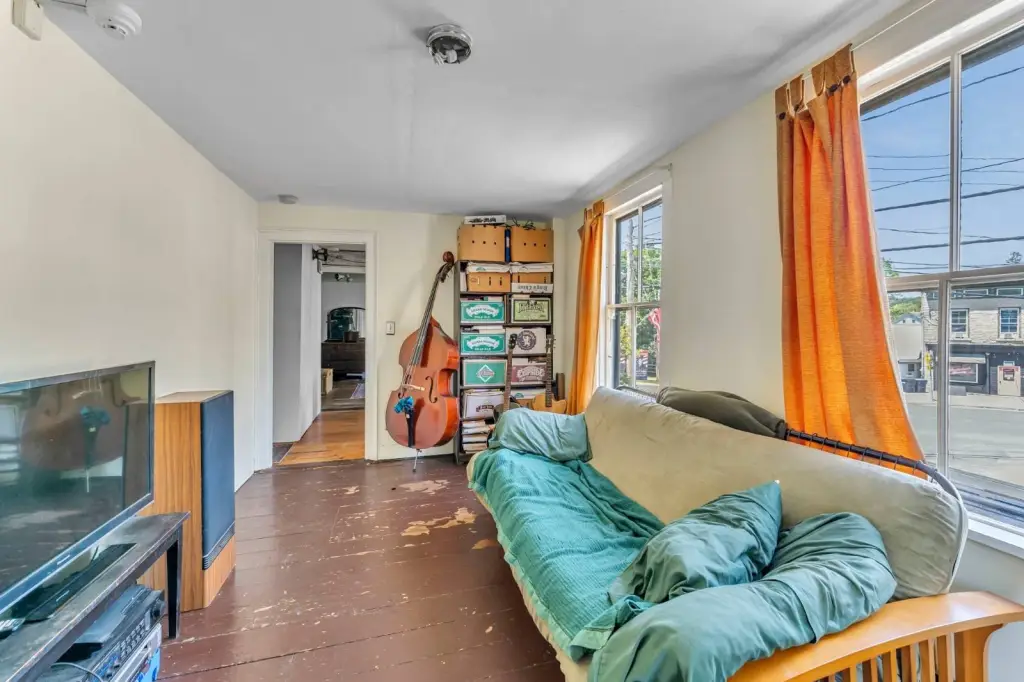
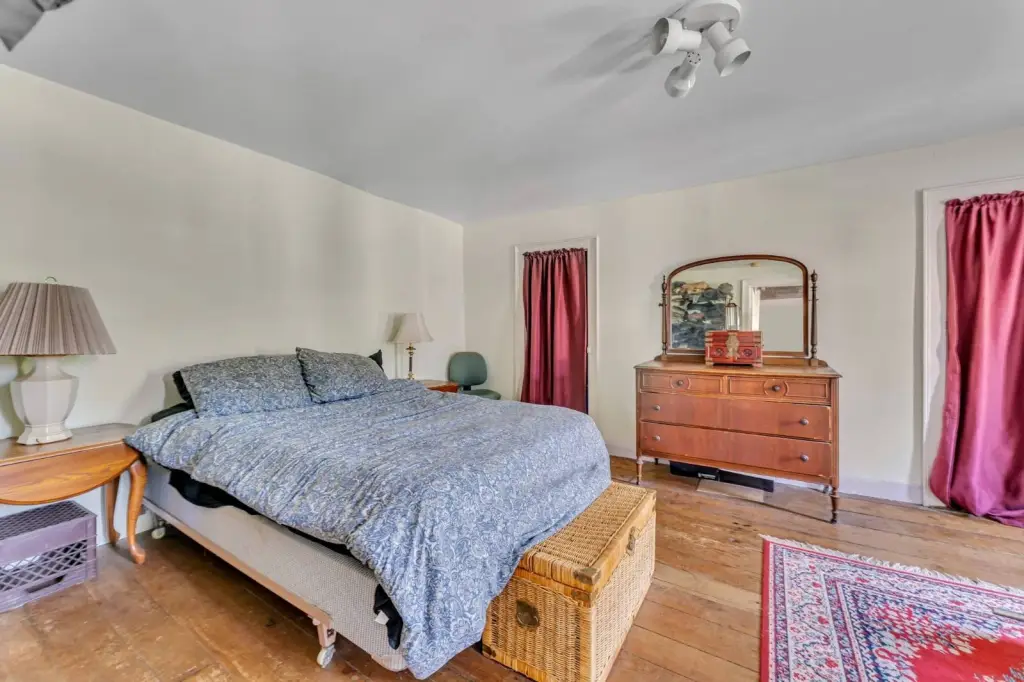
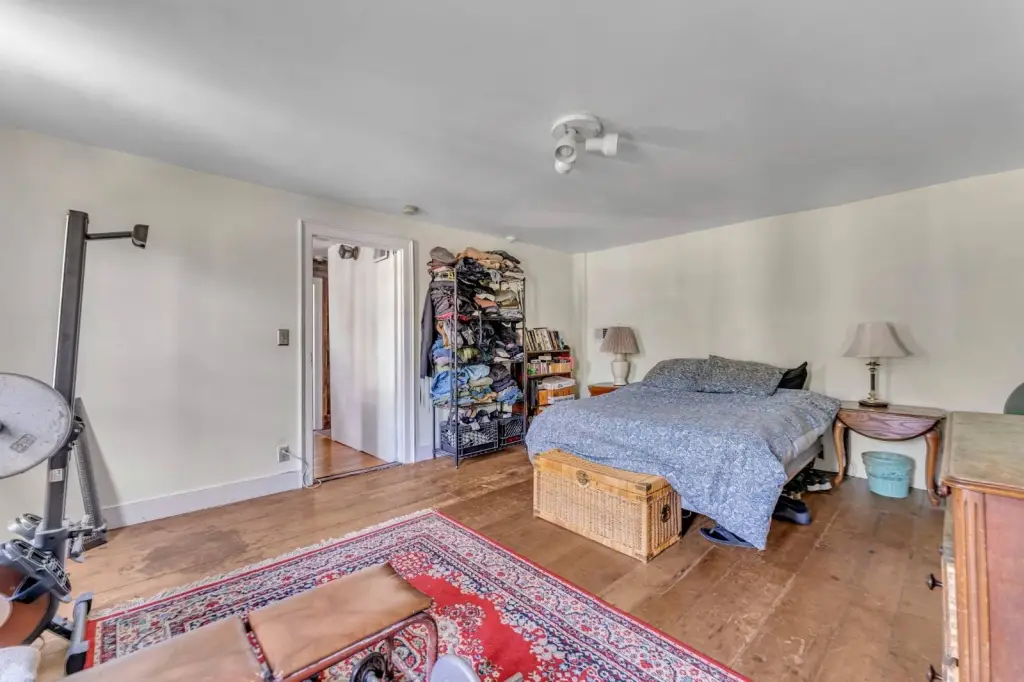
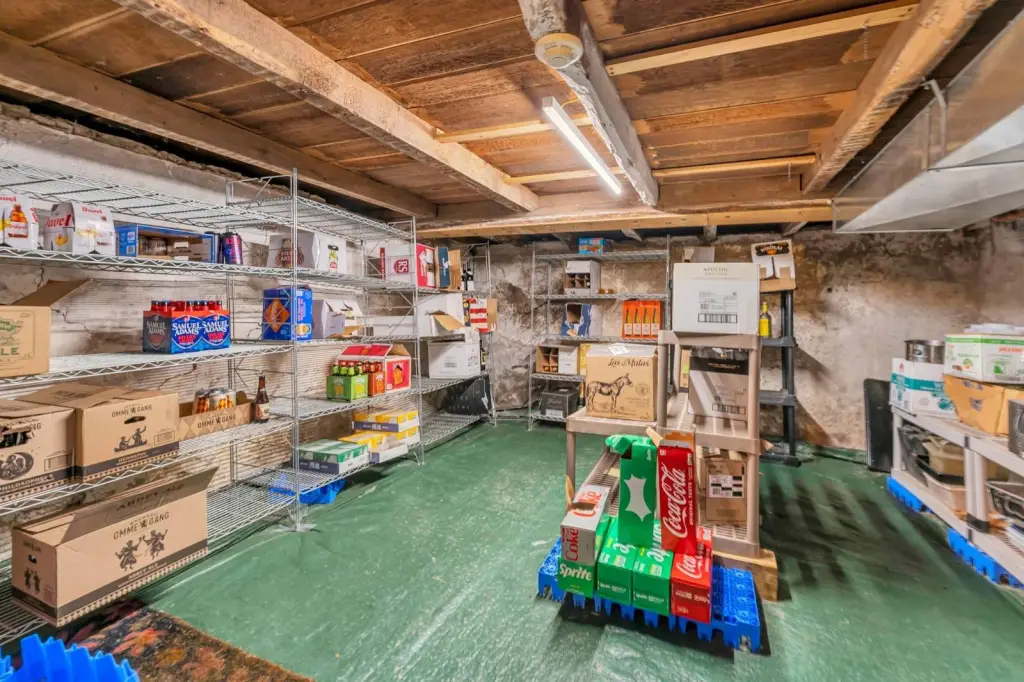
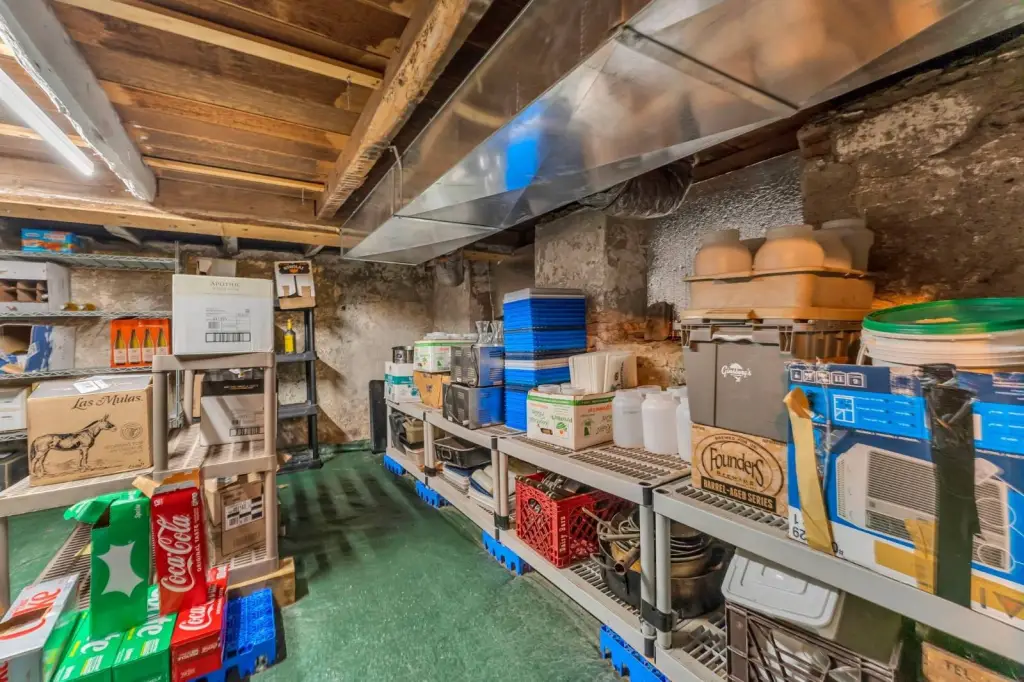
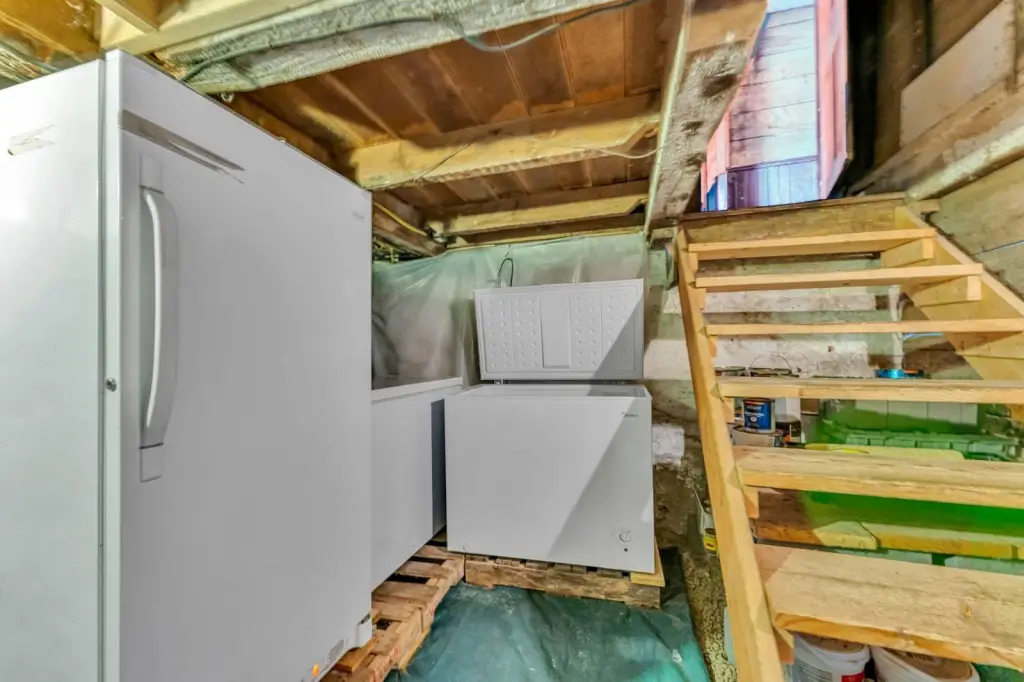
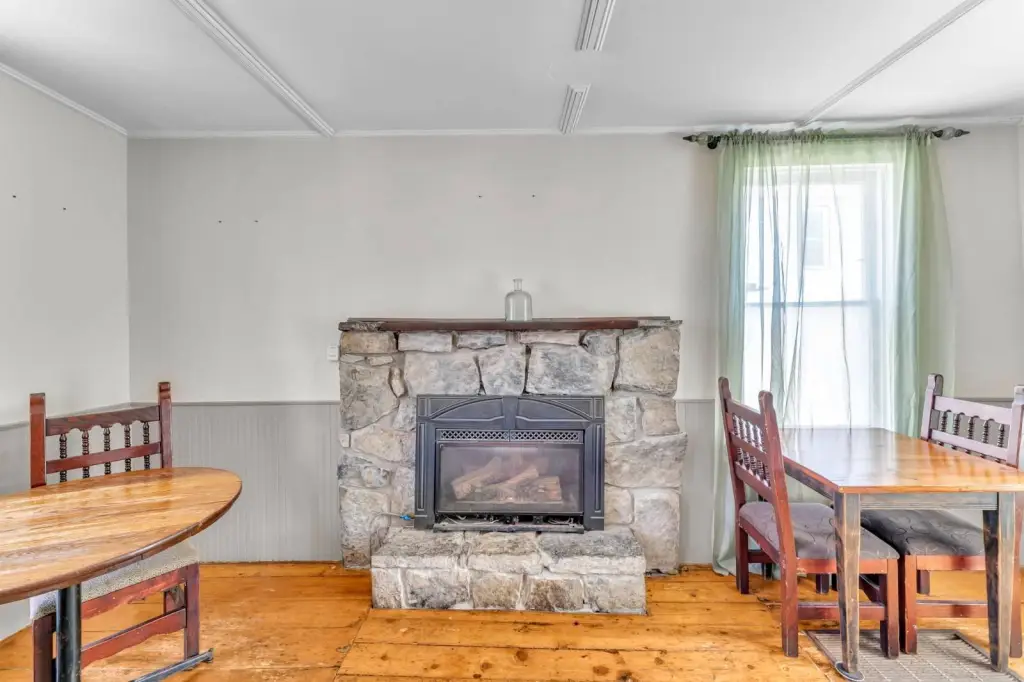
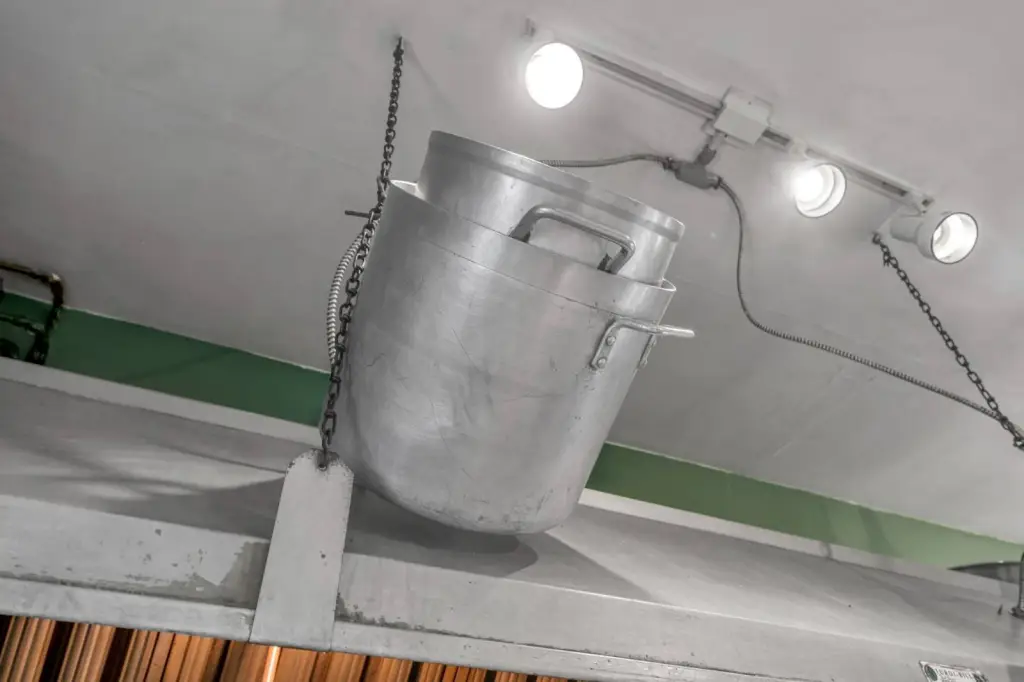
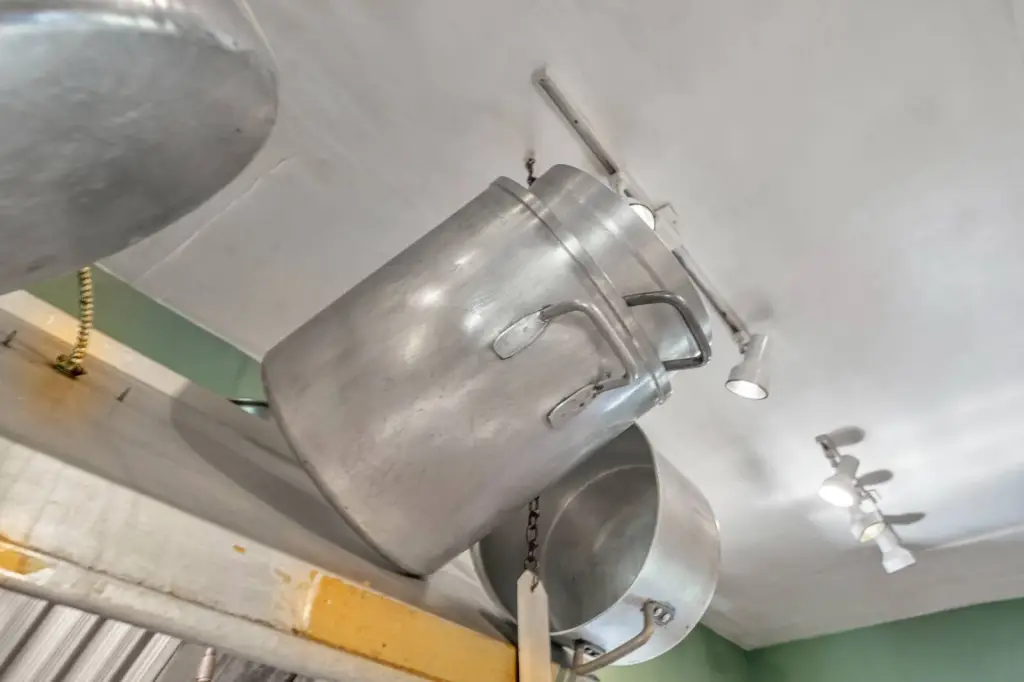
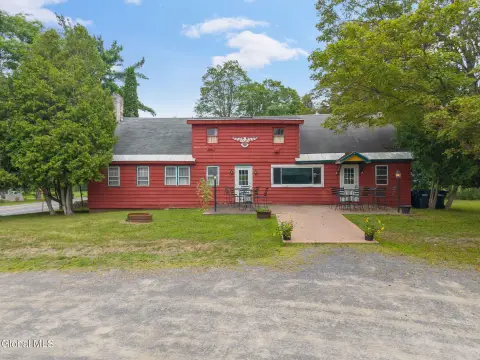
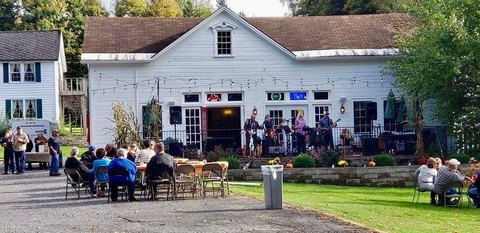
This approximately 2,600-square-foot restaurant occupies a 0.35-acre lot in the Village of Cherry Valley. The building provides indoor dining for approximately 50 guests, a 16-seat outdoor patio, off-street parking, and ADA-compliant access. Furnishings and restaurant equipment are included, supporting continued operation from the existing facility. Second-floor owner’s living quarters add an integrated residential component to the property.
Constructed in 1900 with stone construction, the building has hardwood, vinyl, linoleum, and carpet flooring, along with forced-air heating using propane and oil. Public water and a septic tank serve the property, and the roof is asphalt. Current health permits are in place, and an active New York State liquor license is subject to buyer application and approval. The restaurant has operated for more than 40 years and is located at 4 Lancaster St in Cherry Valley, NY.
Constructed in 1900 with stone construction, the building has hardwood, vinyl, linoleum, and carpet flooring, along with forced-air heating using propane and oil. Public water and a septic tank serve the property, and the roof is asphalt. Current health permits are in place, and an active New York State liquor license is subject to buyer application and approval. The restaurant has operated for more than 40 years and is located at 4 Lancaster St in Cherry Valley, NY.
Key Highlights
- Approximately 2,600‑square‑foot restaurant on 0.35 acres
- Indoor seating for approximately 50 guests plus a 16‑seat outdoor patio
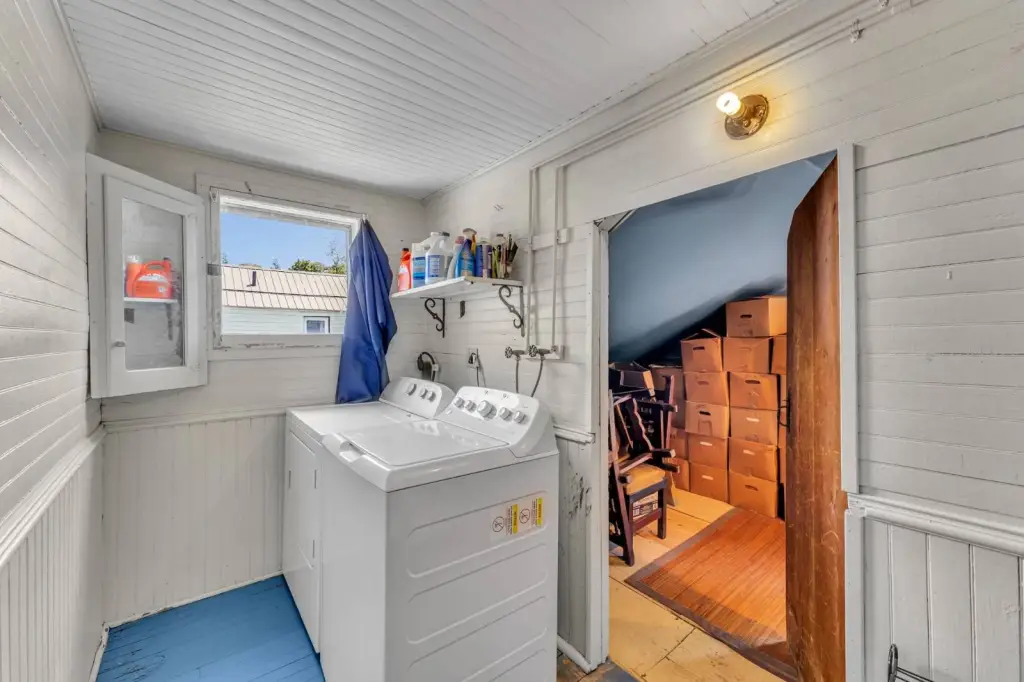
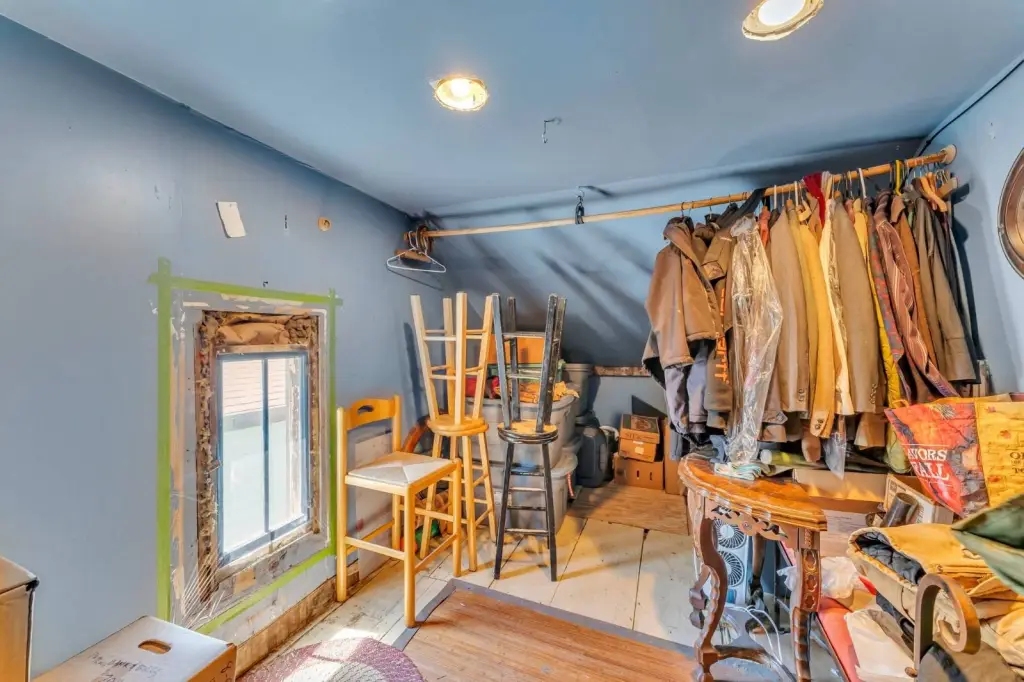
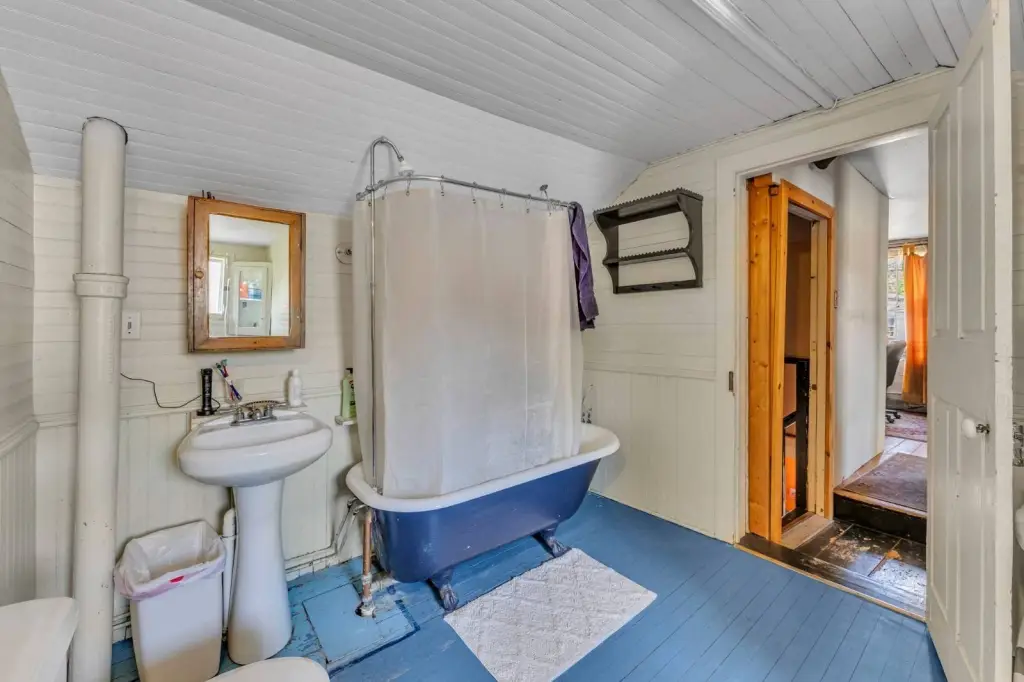
- Second‑floor owner’s living quarters
Financial Insights
Estimated NOI and Cap Rate
NOI / Yr
$22,308
Cap Rate
6.39%
Suggested Prices Based on Cap Rates
Cap Rate 5%
$446,160
$446.2K
Cap Rate 7%
$318,686
$318.7K
Cap Rate 9%
$247,867
$247.9K
Market Conditions
NOI Build-Up for 2,600 SF
Gross rent
$40.6K $15.60/SF
− Vacancy
−$4.9K −$1.87/SF
EGI
$35.7K $13.73/SF
− OpEx
−$13.4K −$5.15/SF
NOI
$22.3K $8.58/SF
Area
Otsego County, NY
Vacancy
12.00%
Lease Rate
$15.60 /SF/Yr
Expense Ratio
37.50%
Simulate Cap Rate and NOI
Suggested Prices Based on Cap Rates
Cap Rate 5%
$446,160
Cap Rate 7%
$318,686
Cap Rate 9%
$247,867
Alternative Uses
Best Use
Specialty Retail
$514.4K
$450.1K – $600.2K
NOI $36,011 @ 7.0% cap · market cap 10.32%
Second Best
Mixed Use
$318.7K
$278.9K – $371.8K
NOI $22,308 @ 7.0% cap · market cap 6.39%
Theoretical Best
Office A
$716.7K
$627.1K – $836.2K
NOI $50,170 @ 7.0% cap · market cap 14.38%
Zoning and permitted uses should be independently verified with authorities.
How Realmo checks its estimates
Property Analytics
Unlock full access to Insights
Subscribe to Realmo Intelligence
Open Analytics
Current Use
Lease Details
Turnkey business
Opportunity
Location Intelligence
Trade Area within ½ mile
106
Businesses Nearby
Well-served
Demand for This Use
Explore this area
Business Placement
Demographics for 13320, NY
2,068
Population
1,039
Households
2
Avg Household Size
48
Median Age
36%
College-Educated
93%
High-School Grad
79.0 sq mi
ZIP Area
26
Density / Sq Mi
$80,956
Median Household Income
$37,386
Median Earnings
$805
Median Rent
$191,600
Median Home Value
Check the figures for this property
Cap Rate, Value Estimation, Potential NOI and more
View Realmo Analytics
Market
Vacancy Rate% for Retail in Northeast region

Frequently Asked Questions
What type of property is this?
Conventional restaurant - Operating restaurant with furnished equipment, guest dining, patio seating, and second-floor living space in Cherry Valley.
Where is this conventional restaurant located?
The property is located at 4 Lancaster St Cherry Valley, NY.
What is the asking price?
The asking price for this property is $349,000.
What are key features of this property?
This property features: Approximately 2,600‑square‑foot restaurant on 0.35 acres; Indoor seating for approximately 50 guests plus a 16‑seat outdoor patio; Second‑floor owner’s living quarters


