Mixed-Use Property with Covered
For Sale
$2,800,000
3989 North Graham Rd, College Station, TX 77845
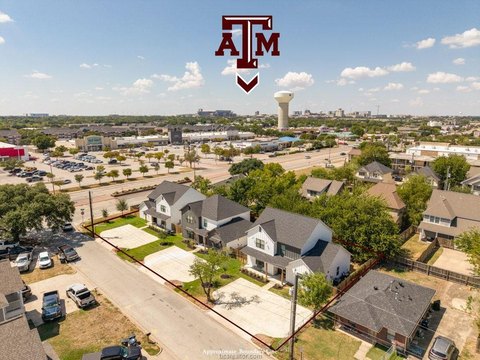
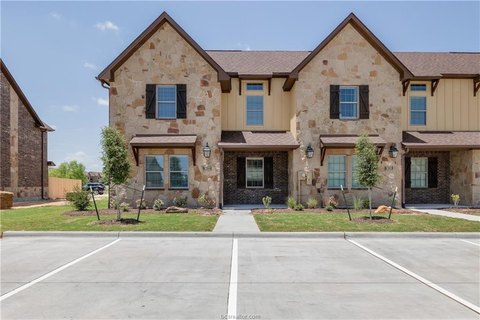
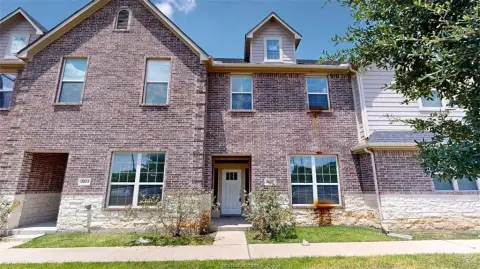
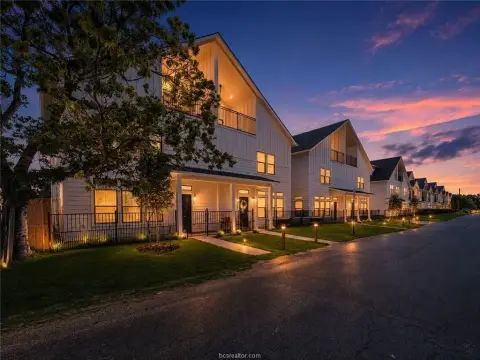
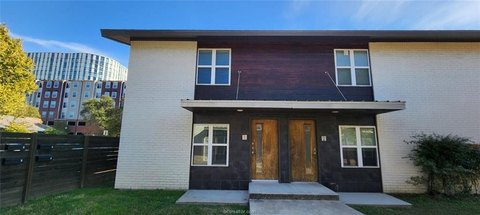
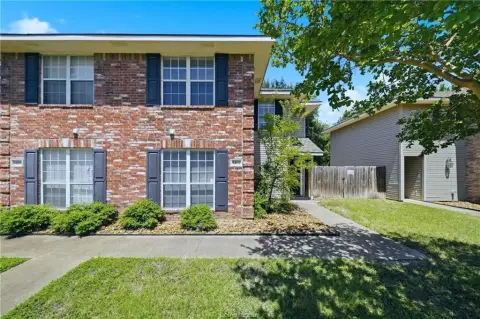
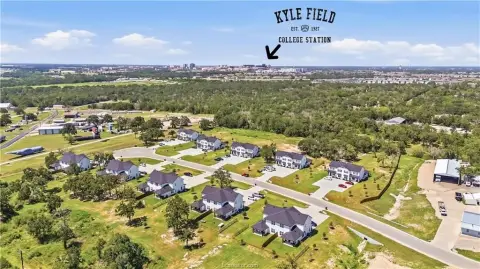
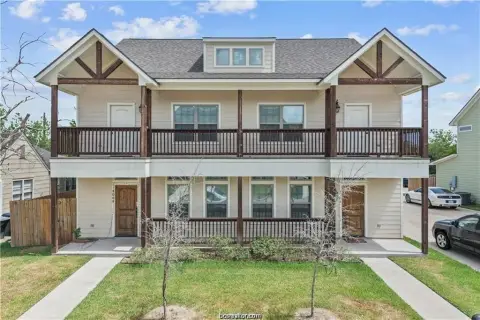
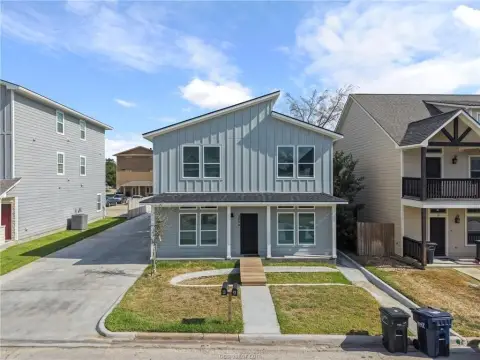
The site includes three residential buildings, a covered pavilion, and a concrete parking area.
Property Size7,595 SF
Lot Size7.52 Acres
Price / SF$368.66
Days on Market78
Property Features for 3989 North Graham Rd
General Information
Standard status
Active
Size
7,595 SF
Total Parking Spaces
130
Lot size
7.52 Acres
Additional Details
Gross Income
$252,000
Amenities
covered basketball court
covered pavilion
Building Details
Year Built
1981
Buildings
3
Tenancy
Single
Listing Agency:
SRA Strategic Realty Advisors
Listed By:
Robert Young · License #0517625
(979) 431-5566
Source:
Doorstephomegroup
Added: Jul 31
Changed: Sep 2
Last Checked: Sep 29 at 1:37PM
Displayed information is deemed reliable but is not guaranteed and should be independently verified. All listing content including descriptions, pricing, images are the copyrighted material of SRA Strategic Realty Advisors

Ask AI about this property
Review the available facts, identify missing information and prepare questions for the agent.
Investment Insights
Based on property information with market context.
This mixed-use property comprises three separate residential buildings and a covered basketball court across approximately 7.52 acres. The primary two-story residence, built in 1981, contains five bedrooms, four and a half bathrooms, three living areas, two dining areas, and a full kitchen. The other two-story buildings also provide kitchens and living quarters. A concrete parking area accommodates approximately 130 vehicles.
The property is near Texas A&M University, off Holleman and Rock Prairie, and sits outside the College Station city limits. The covered court measures approximately 40' x 120', includes a three-sided enclosed section, provides approximately 20' of clear height, and has fluorescent lighting. The property is occupied by a local fraternity under a lease with escalations.
The property is near Texas A&M University, off Holleman and Rock Prairie, and sits outside the College Station city limits. The covered court measures approximately 40' x 120', includes a three-sided enclosed section, provides approximately 20' of clear height, and has fluorescent lighting. The property is occupied by a local fraternity under a lease with escalations.
Key Highlights
- Approximately 7.52 acres with three separate residential buildings and a covered basketball court
- Main two‑story residence built in 1981 with five bedrooms and four and a half bathrooms
- Approximately 130‑space concrete parking lot
Financial Insights
Estimated NOI and Cap Rate
NOI / Yr
$82,937
Cap Rate
2.96%
Suggested Prices Based on Cap Rates
Cap Rate 5%
$1,658,740
$1.7M
Cap Rate 7%
$1,184,814
$1.2M
Cap Rate 9%
$921,522
$921.5K
Market Conditions
NOI Build-Up for 7,595 SF
Gross rent
$145.8K $19.20/SF
− Vacancy
−$13.1K −$1.73/SF
EGI
$132.7K $17.47/SF
− OpEx
−$49.8K −$6.55/SF
NOI
$82.9K $10.92/SF
Area
College Station, TX
Vacancy
9.00%
Lease Rate
$19.20 /SF/Yr
Expense Ratio
37.50%
Simulate Cap Rate and NOI
Suggested Prices Based on Cap Rates
Cap Rate 5%
$1,658,740
Cap Rate 7%
$1,184,814
Cap Rate 9%
$921,522
Alternative Uses
Best Use
Mixed Use
$1.18M
$1.04M – $1.38M
NOI $82,937 @ 7.0% cap · market cap 2.96%
Second Best
Apartment 5plus
$1.04M
$910.8K – $1.21M
NOI $72,860 @ 7.0% cap · market cap 2.60%
Theoretical Best
Office A
$1.87M
$1.64M – $2.18M
NOI $130,913 @ 7.0% cap · market cap 4.68%
Zoning and permitted uses should be independently verified with authorities.
How Realmo checks its estimates
Property Analytics
Unlock full access to Insights
Subscribe to Realmo Intelligence
Open Analytics
Current Use
Lease Details
Single-tenant
Tenancy
Location Intelligence
Trade Area within ½ mile
35
Businesses Nearby
Explore this area
Business Placement
Demographics for 77845, TX
70,108
Population
31,464
Households
2.2
Avg Household Size
30
Median Age
61%
College-Educated
96%
High-School Grad
142.5 sq mi
ZIP Area
492
Density / Sq Mi
$90,434
Median Household Income
$46,532
Median Earnings
$1,384
Median Rent
$349,900
Median Home Value
Check the figures for this property
Cap Rate, Value Estimation, Potential NOI and more
View Realmo Analytics



Frequently Asked Questions
What type of property is this?
Mixed-use property - The site includes three residential buildings, a covered pavilion, and a concrete parking area.
Where is this mixed-use property located?
The property is located at 3989 North Graham Rd College Station, TX.
What is the asking price?
The asking price for this property is $2,800,000.
What are key features of this property?
This property features: Approximately 7.52 acres with three separate residential buildings and a covered basketball court; Main two‑story residence built in 1981 with five bedrooms and four and a half bathrooms; Approximately 130‑space concrete parking lot


