Former Cheese Manufacturing
3941 State Highway 28 Milford, NY 13807
For Sale
$599,900
COMMERCIAL - Milford, NY
Property Size8,612 SF
Lot Size2.96 Acres
Price / SF$69.66
Days on Market48
Property Features for 3941 State Highway 28
General Information
- Property type
- Commercial Sale
- Property subtype
- Other
- Zoning
- 710 Manuf
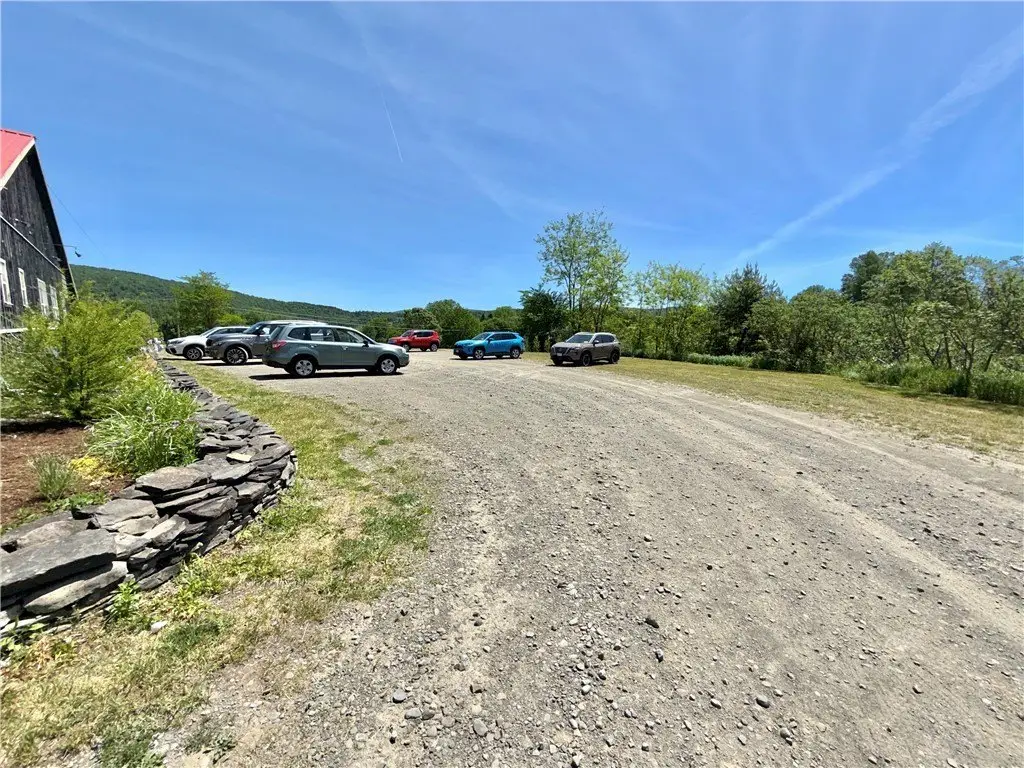
- Parking
- 35
- Parking features
- Driveway
- Standard status
- Active
- APN
- 194.00-2-44.02
- Size
- 8,612 SF
- Lot size
- 2.96 Acres
Taxes and HOA fees
- Tax Annual Amount
- 14144
Utilities
- Sewer type
- Septic Tank
- Heating system
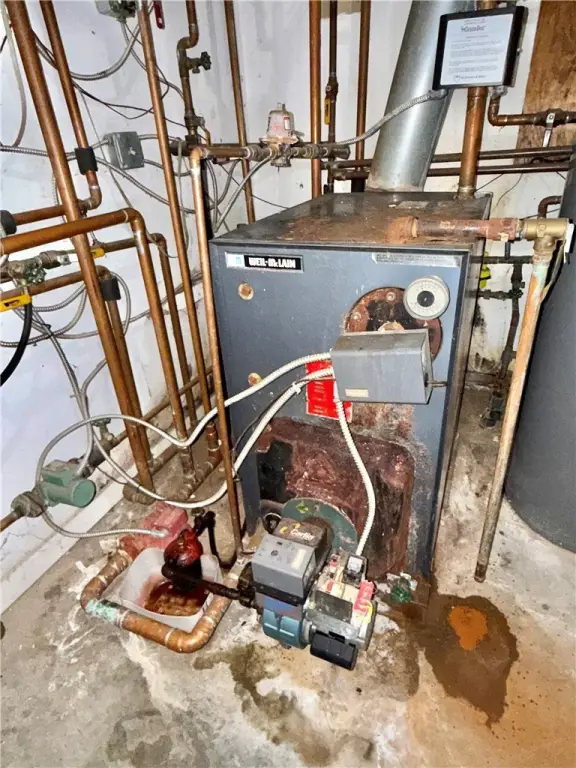
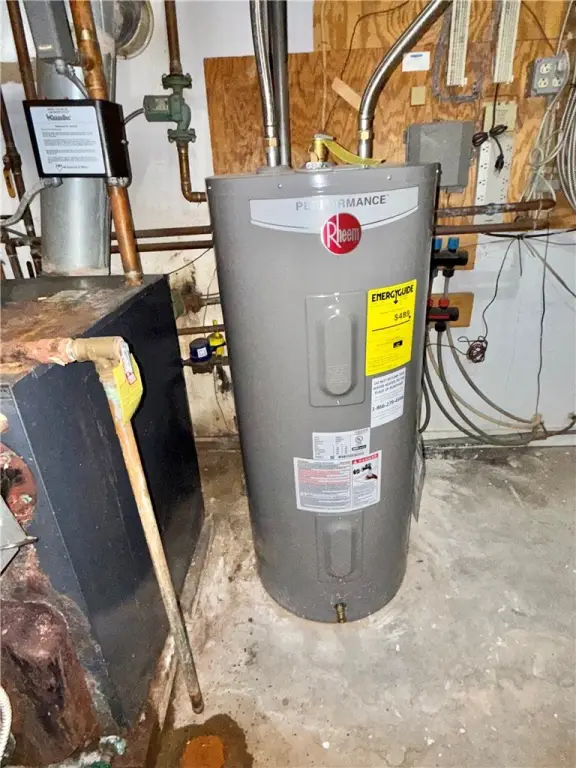
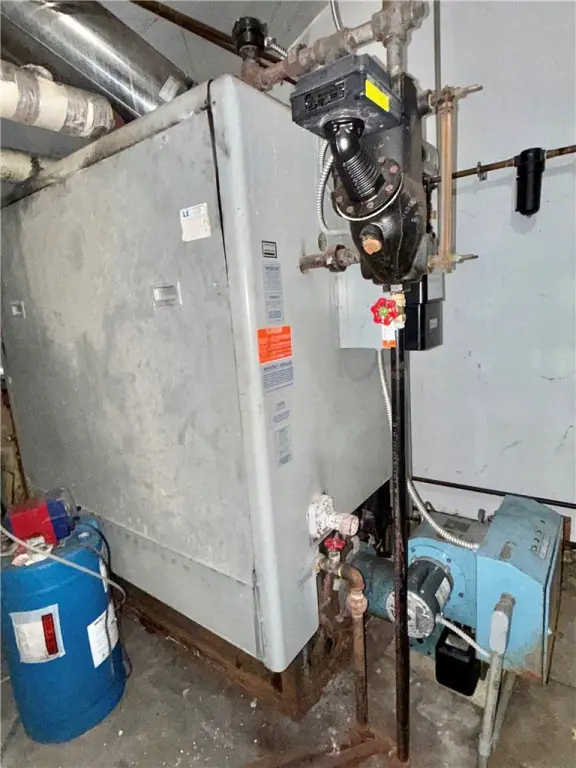
- Radiant, Oil, Steam
Building Details
- Year built
- 2000
- Floors in Building
- 1
- Flooring type
- Concrete
- Building materials
- Frame
- Roof type
- Metal
Listing Agency:
Benson Agency Real Estate LLC
(607) 432-4391
Listed By:
Rodger B Moran · License #30MO0797197
(607) 287-1559
Added: Jun 8
Changed: Jul 12
Last Checked: Jul 25 at 7:06PM
MLS# R1688947
Copyright © 2026 New York State Alliance of MLSs, LLC. All rights reserved. All information provided by the listing agent/broker is deemed reliable but is not guaranteed and should be independently verified.
Investment Insights
Based on property information with market context.
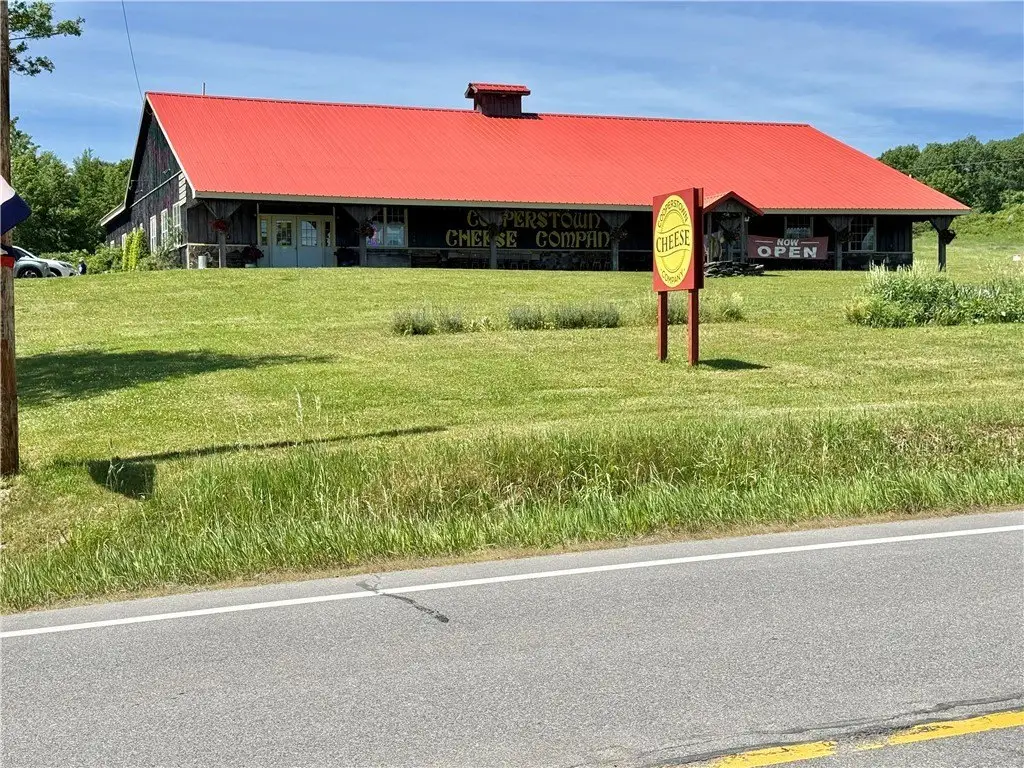
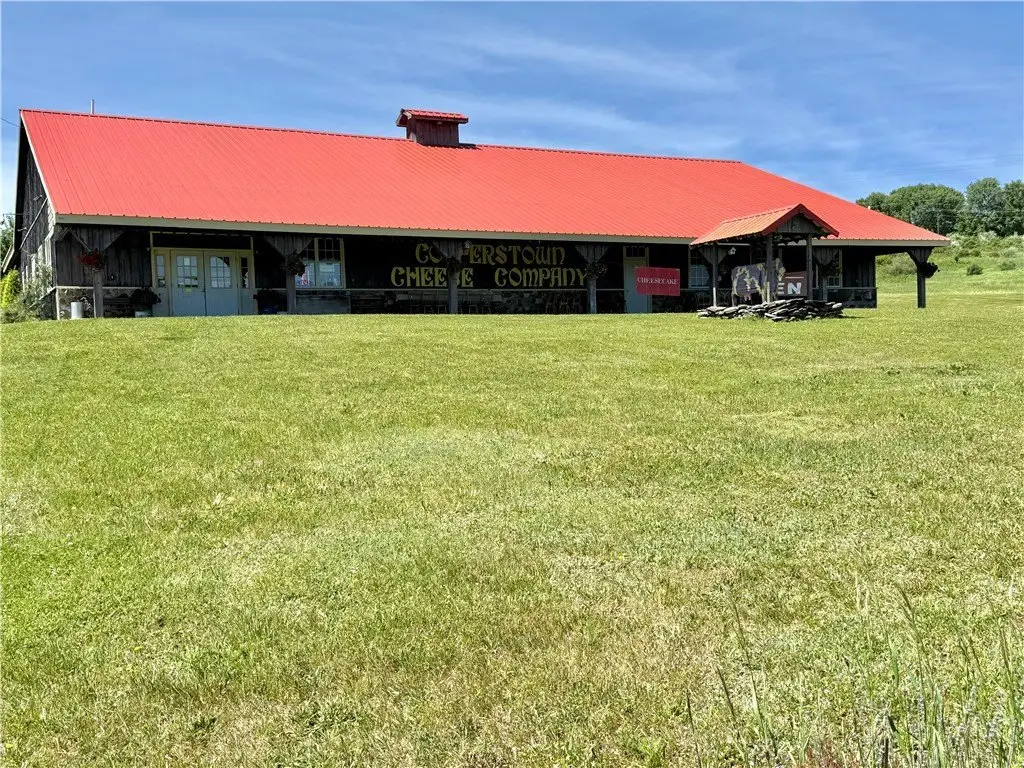
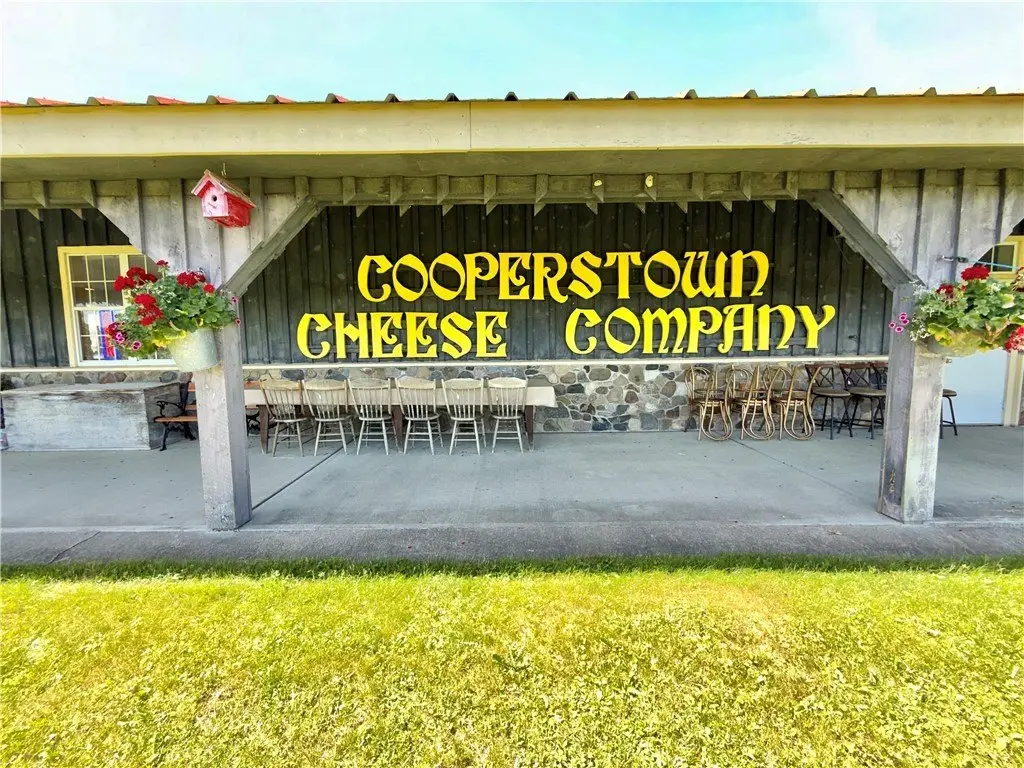
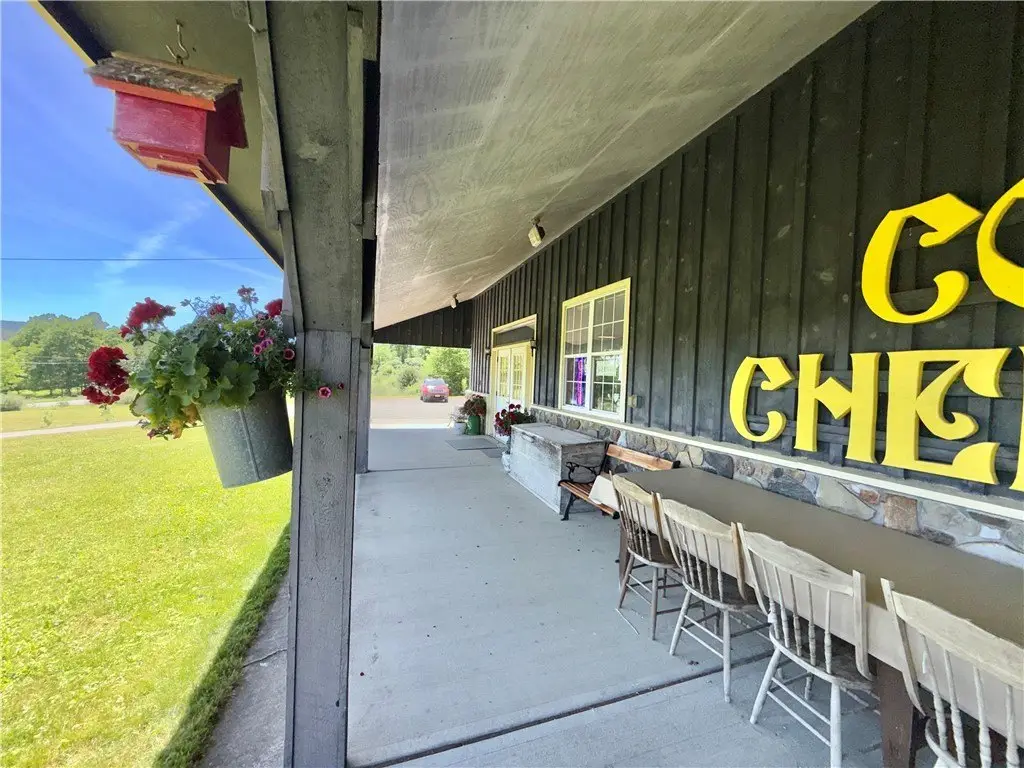
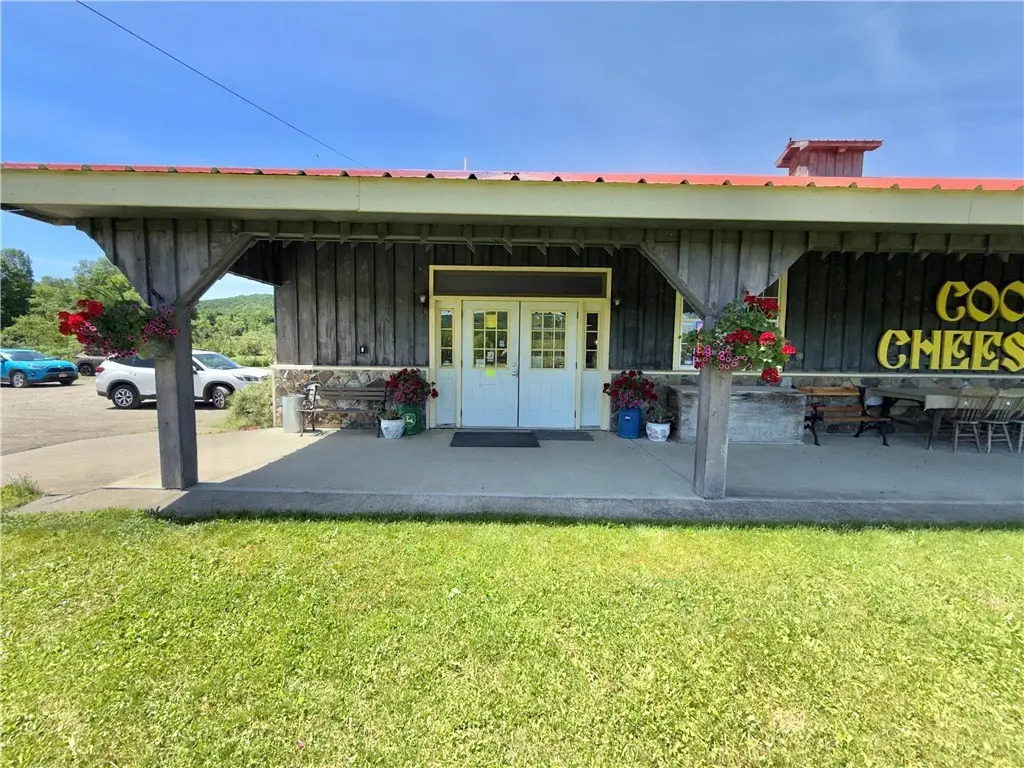
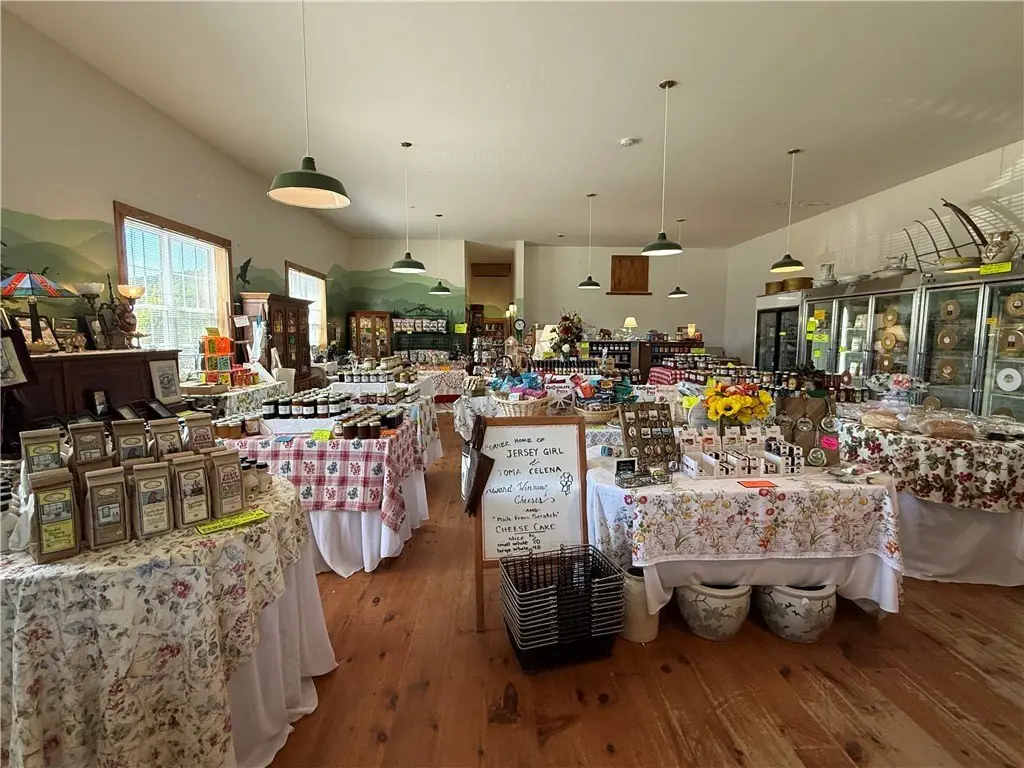
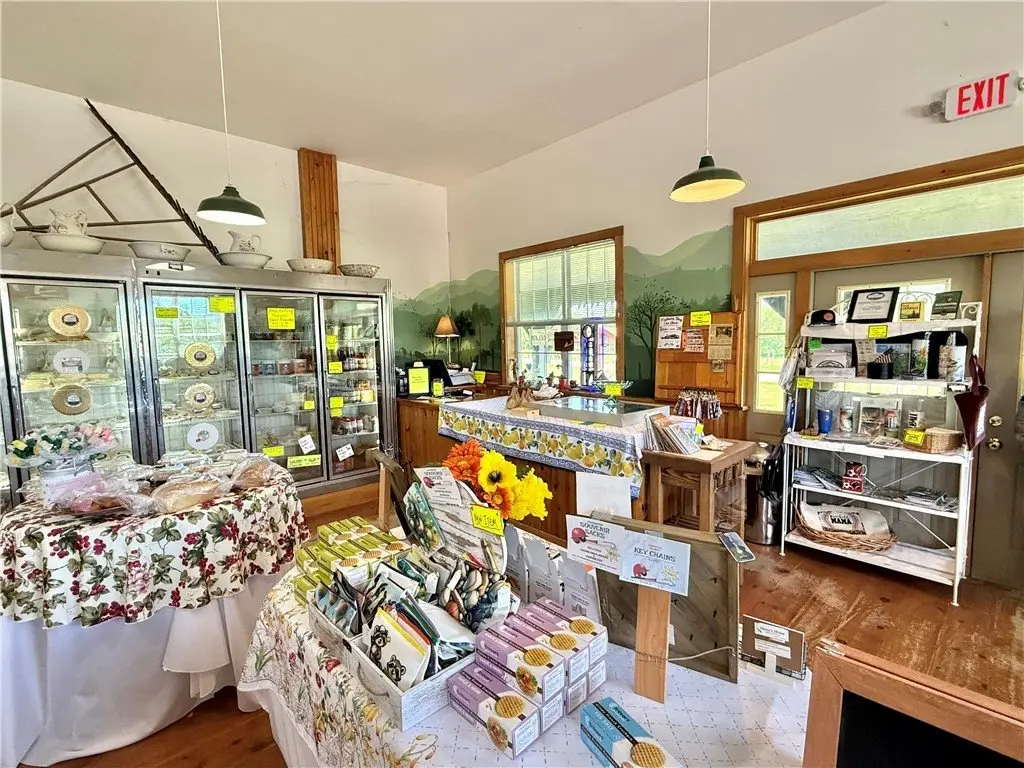
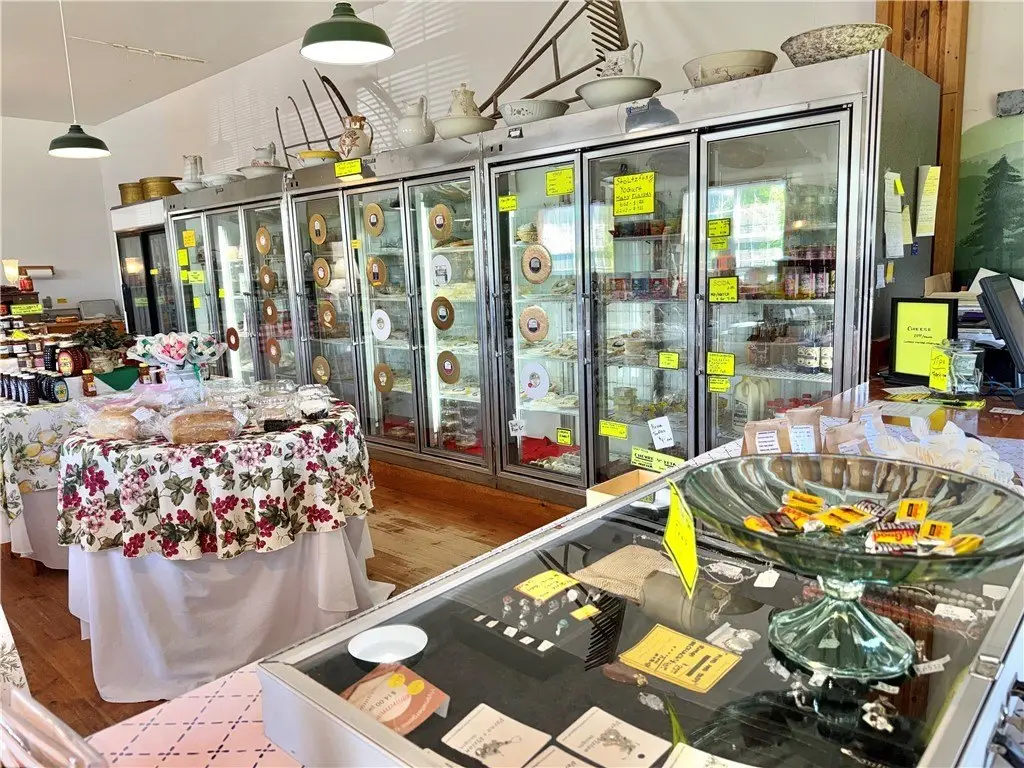
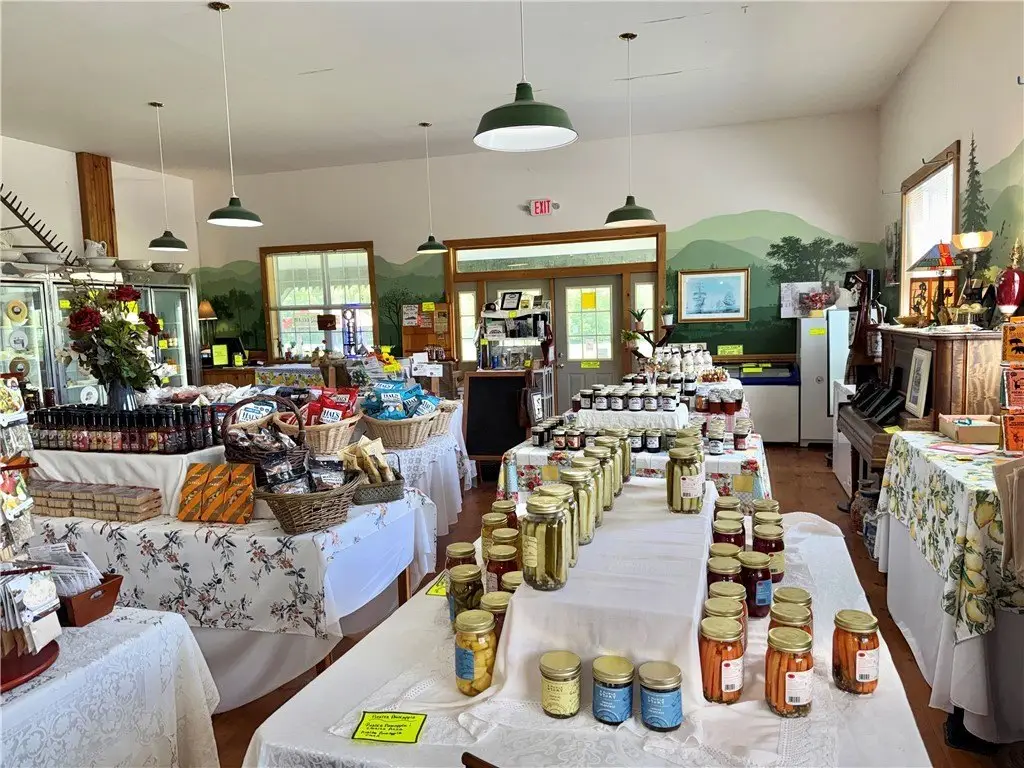
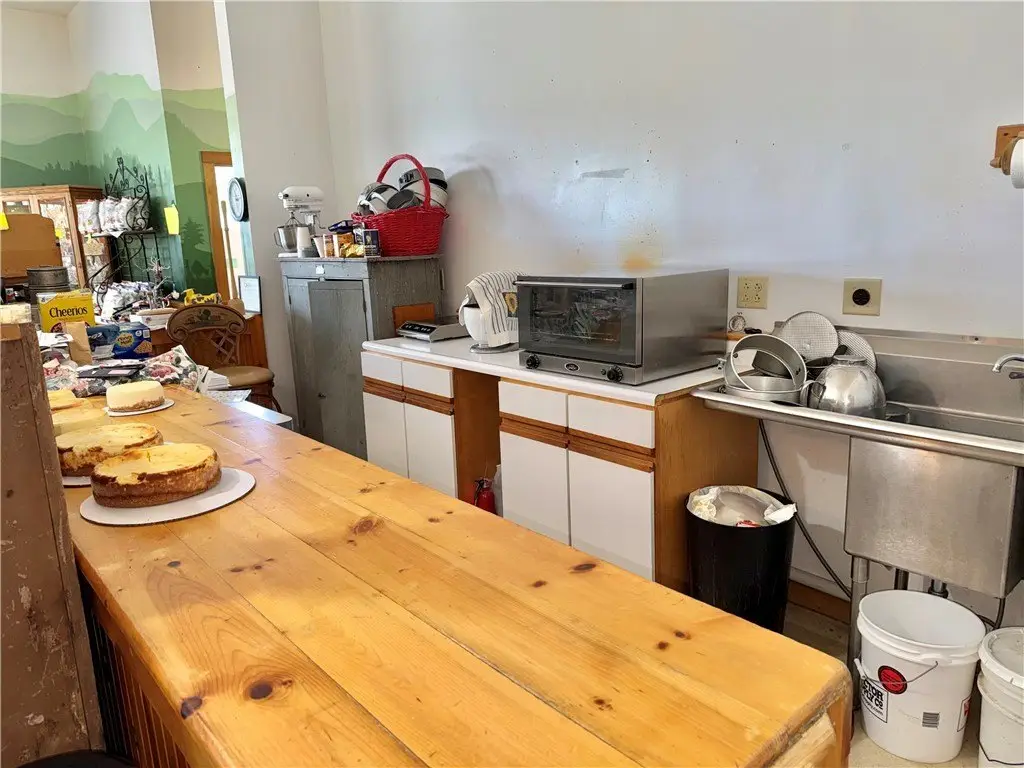
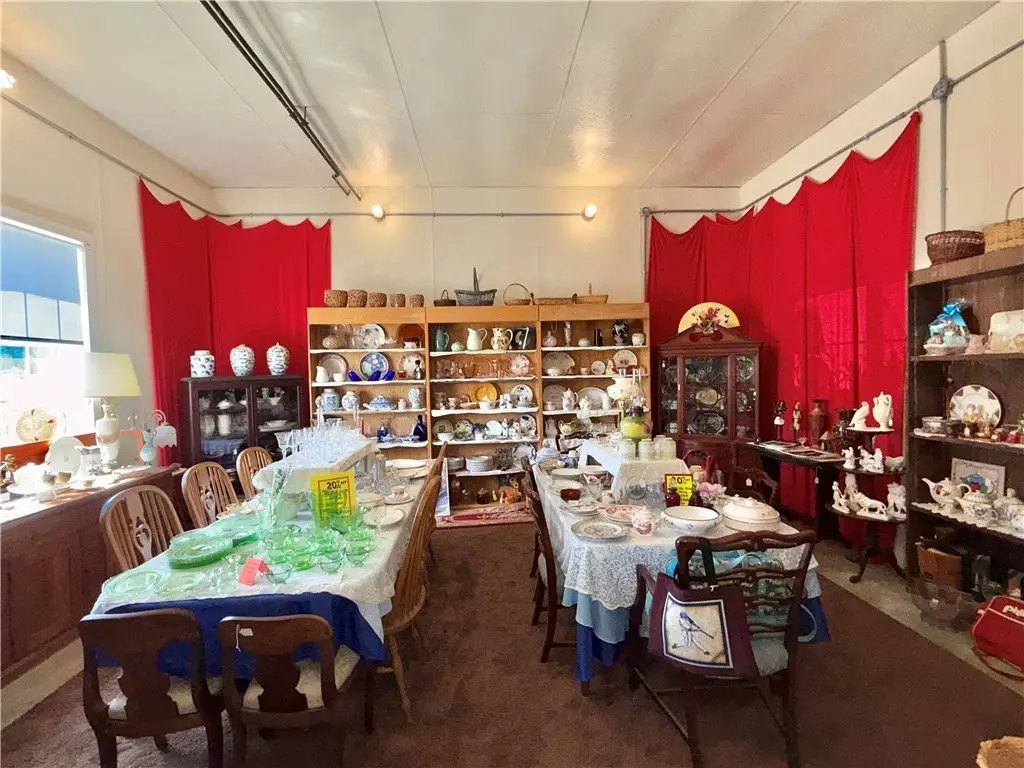
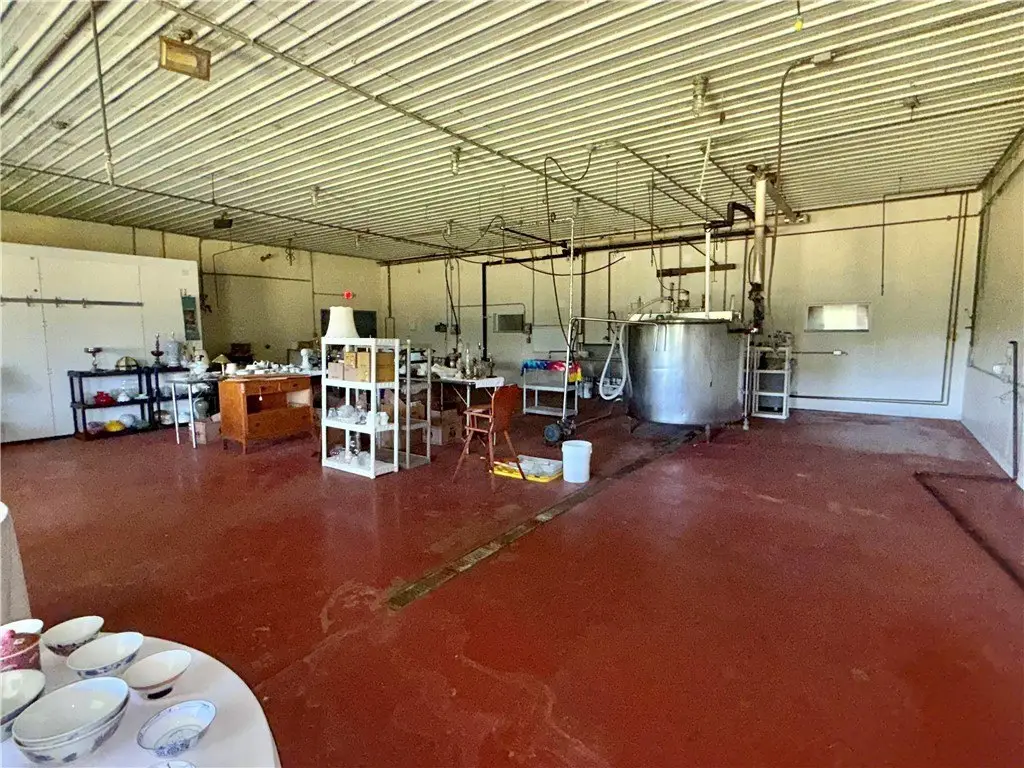
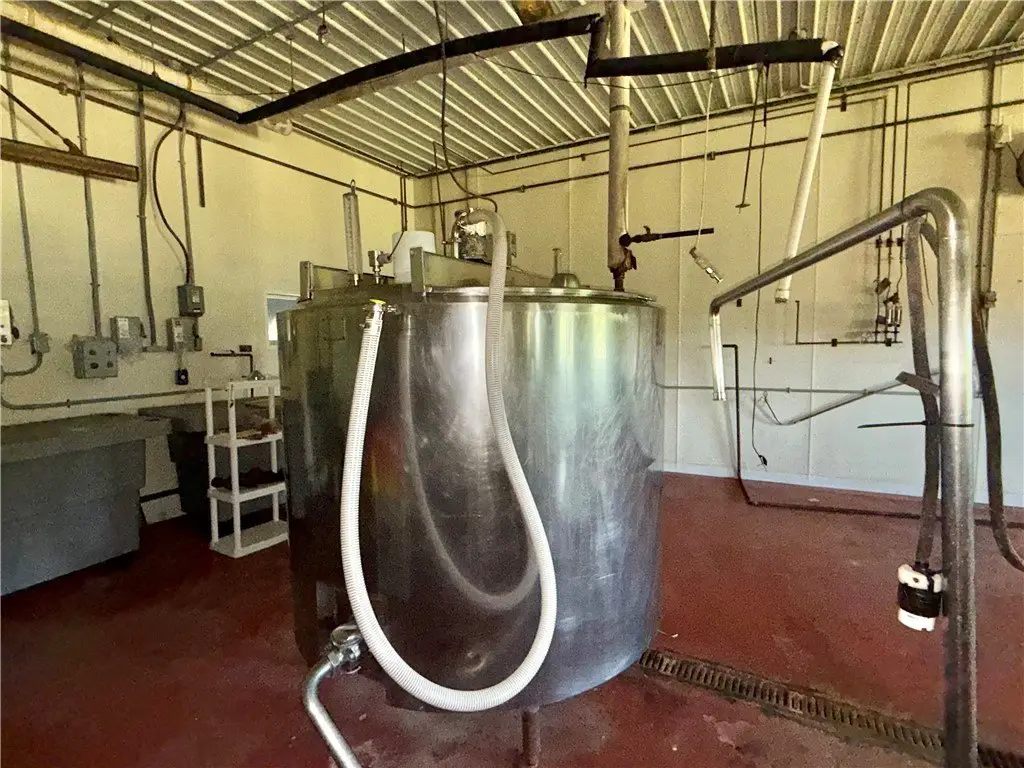
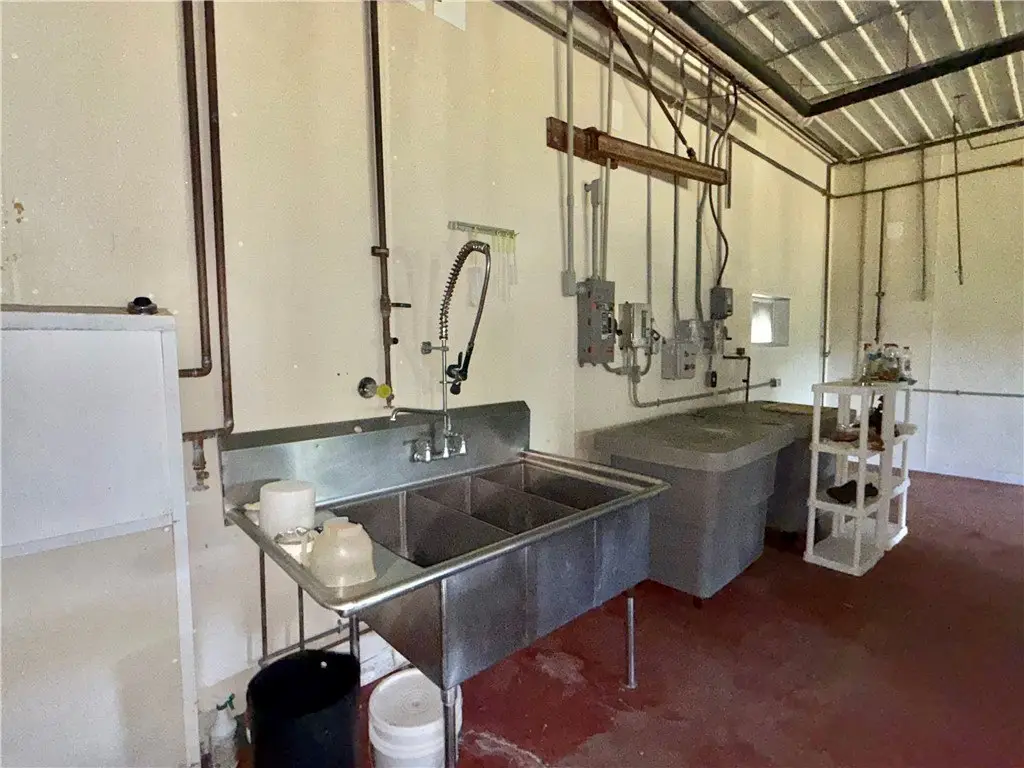
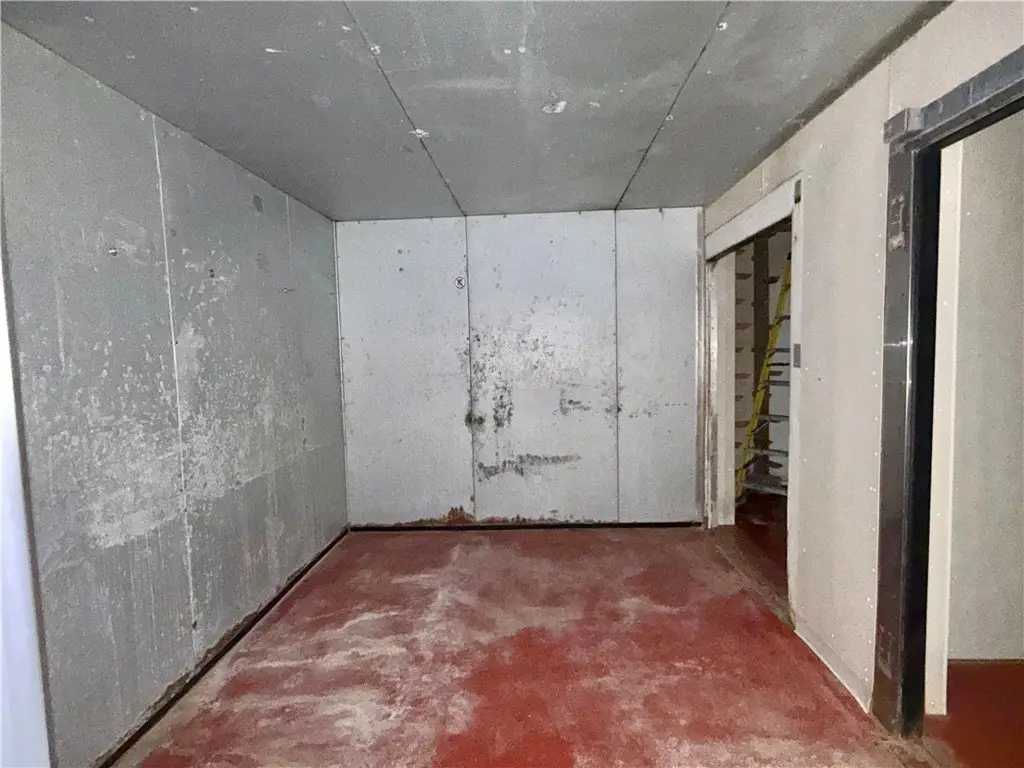
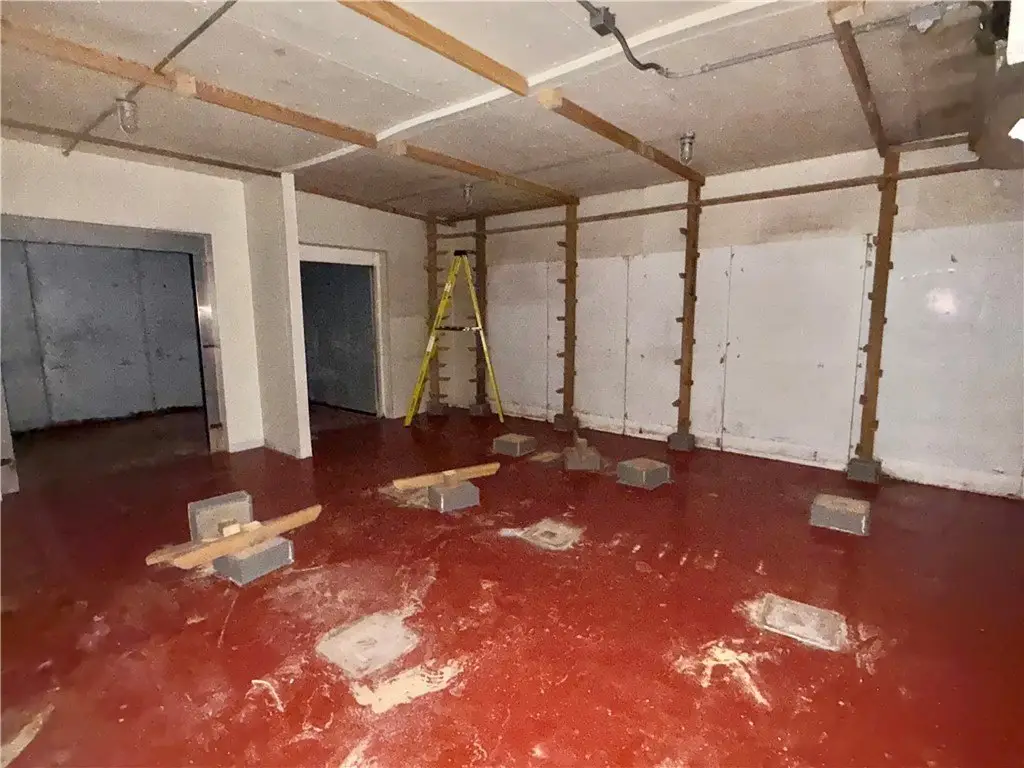
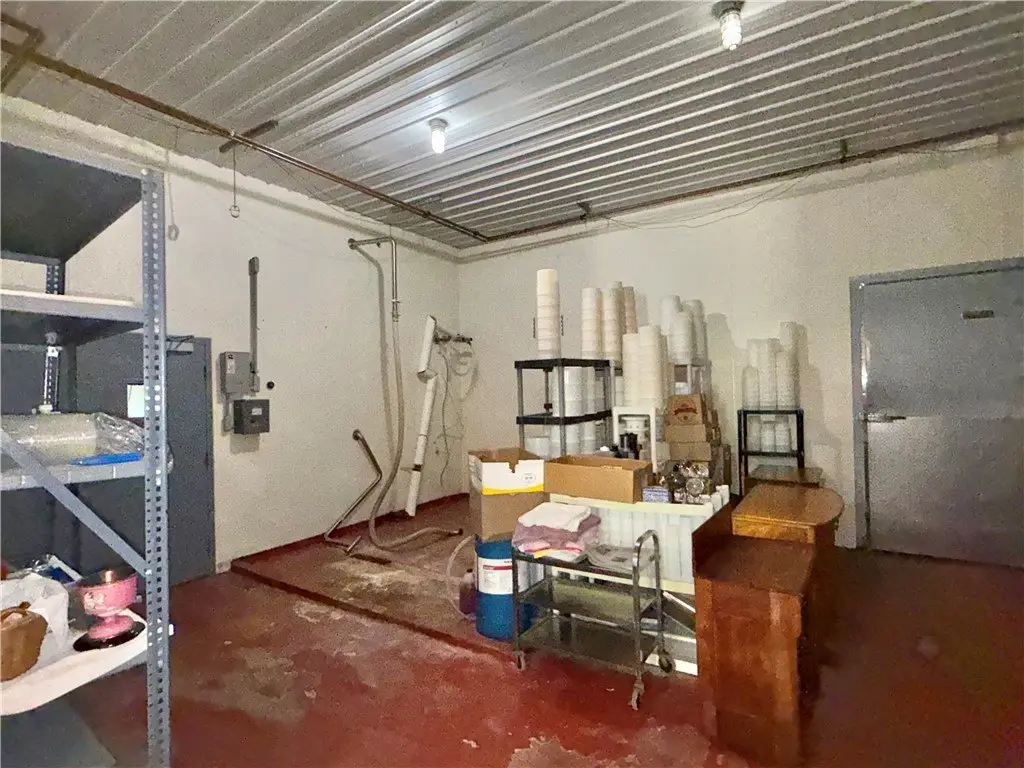
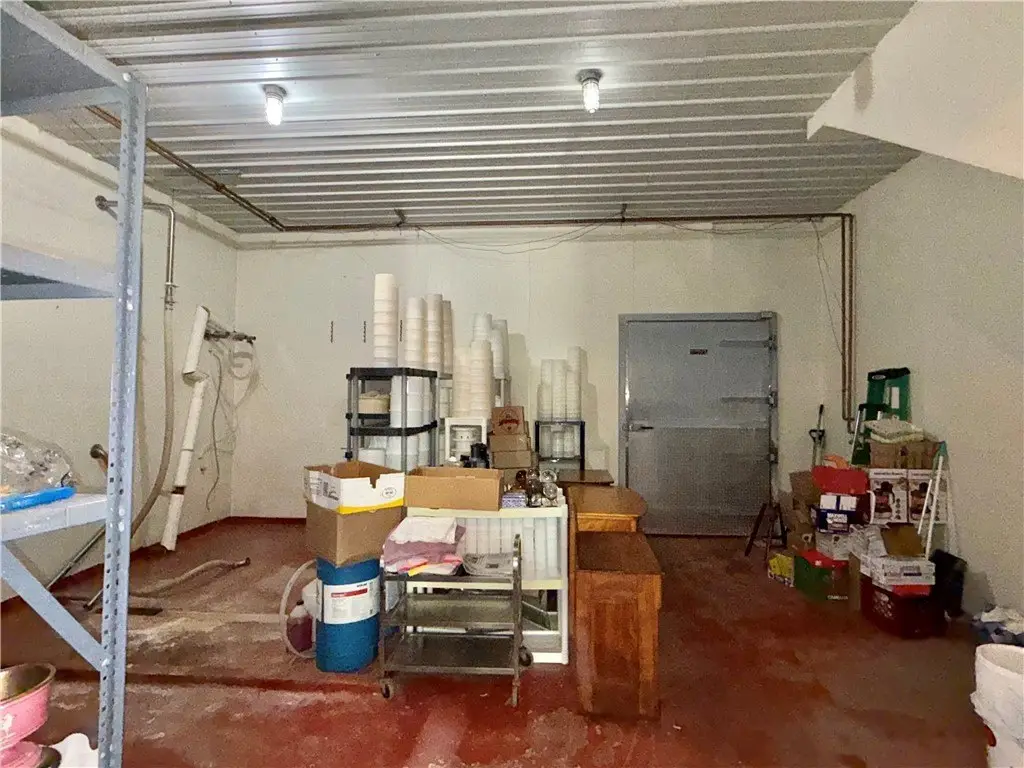
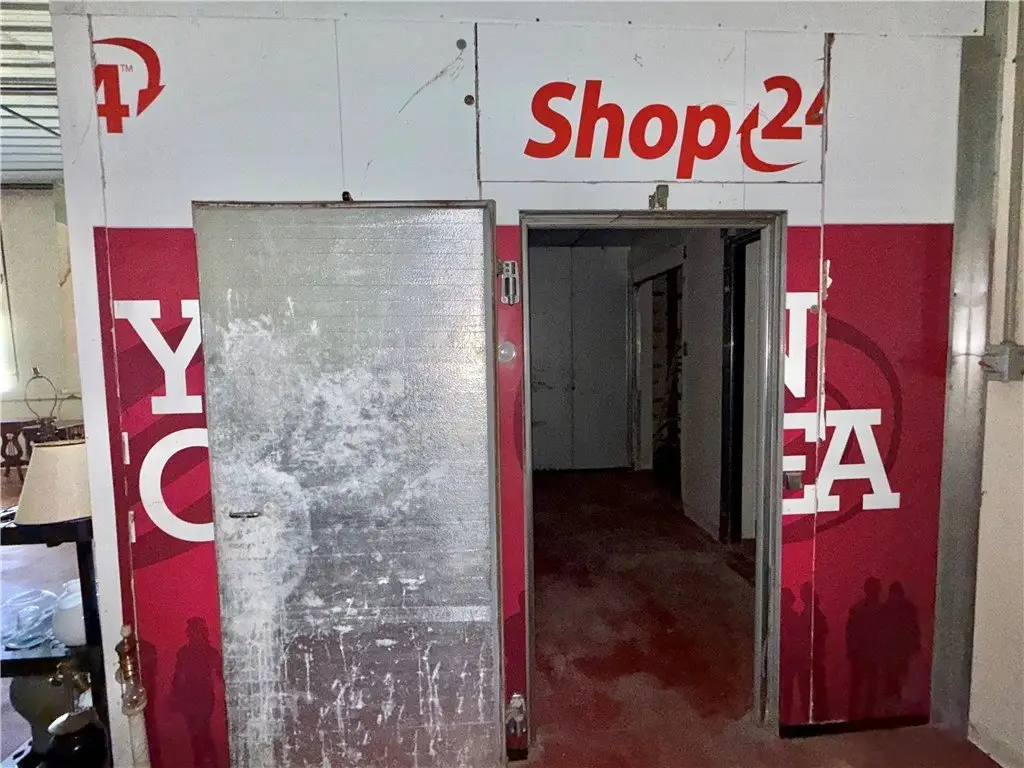
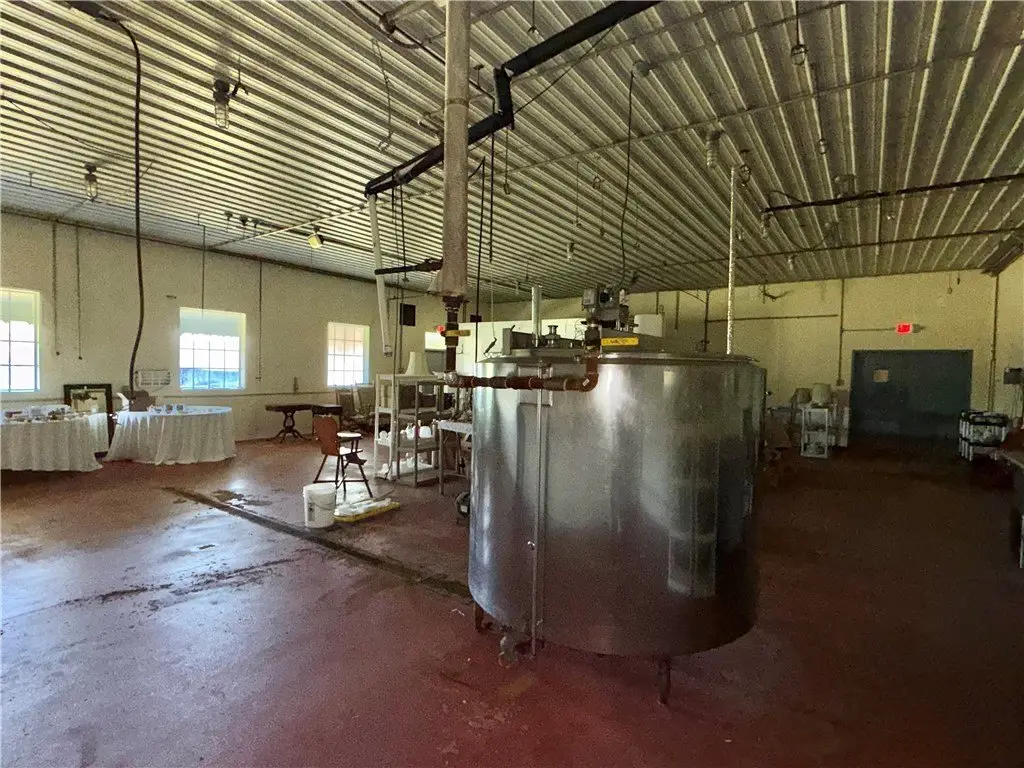
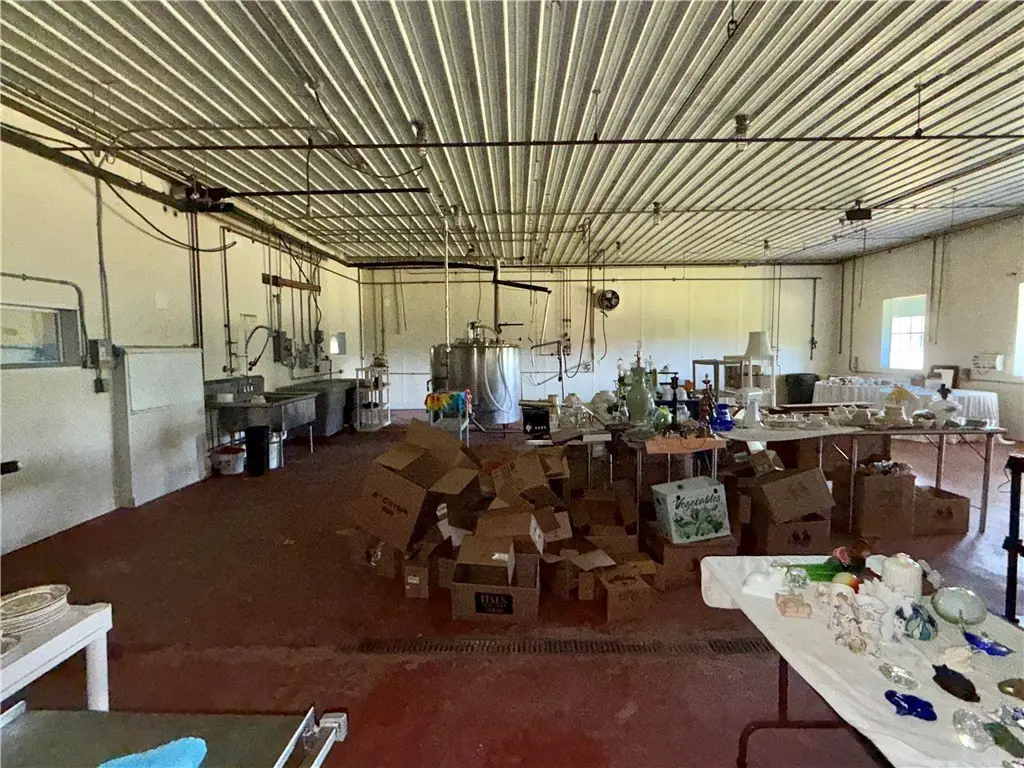
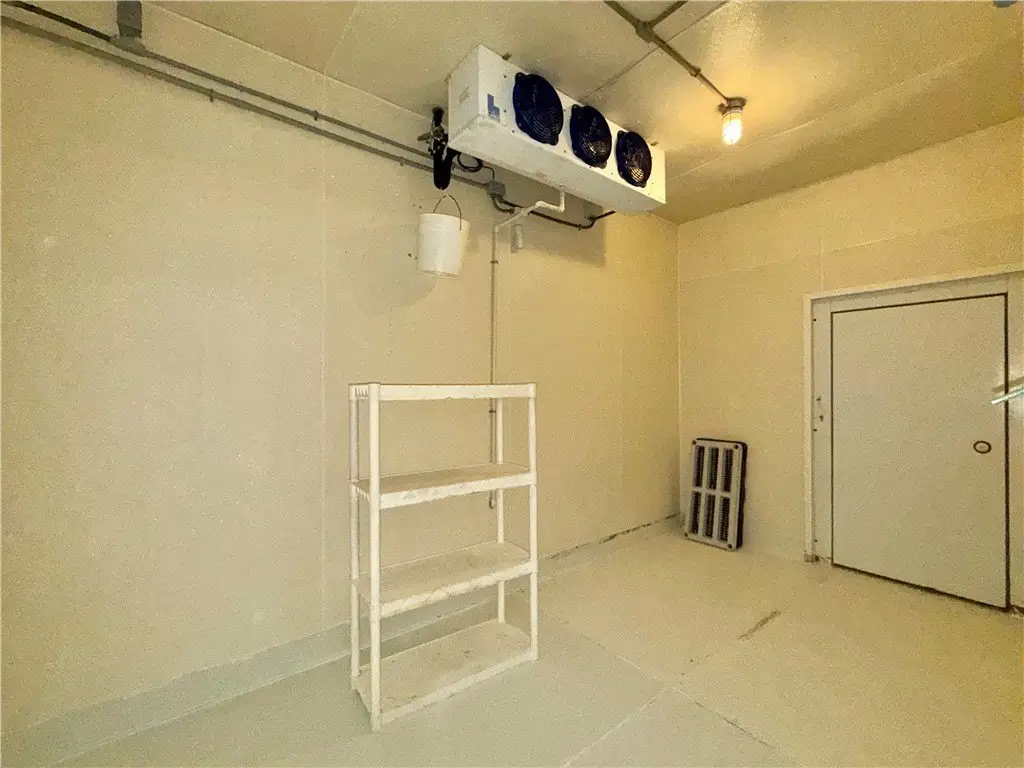
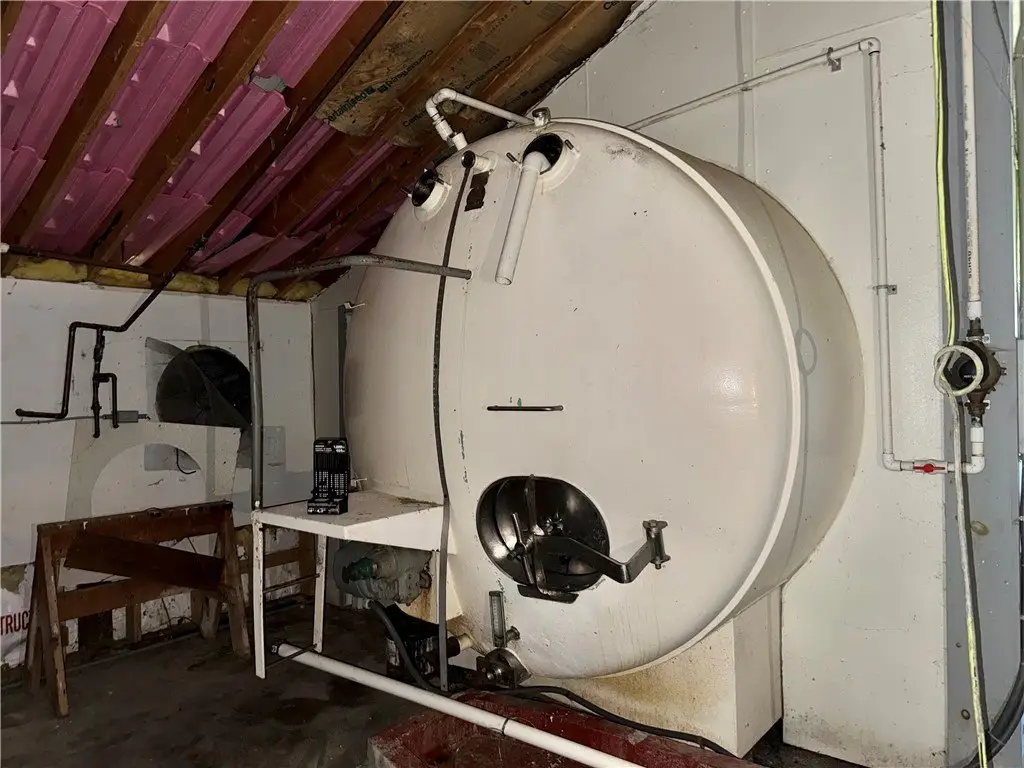
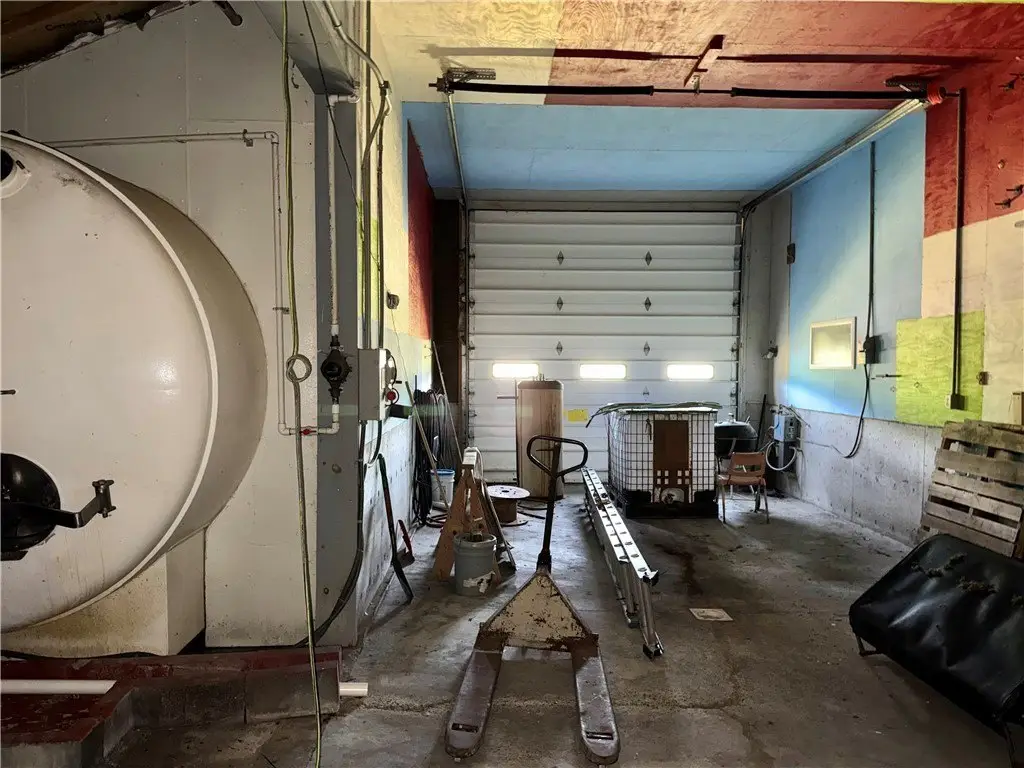
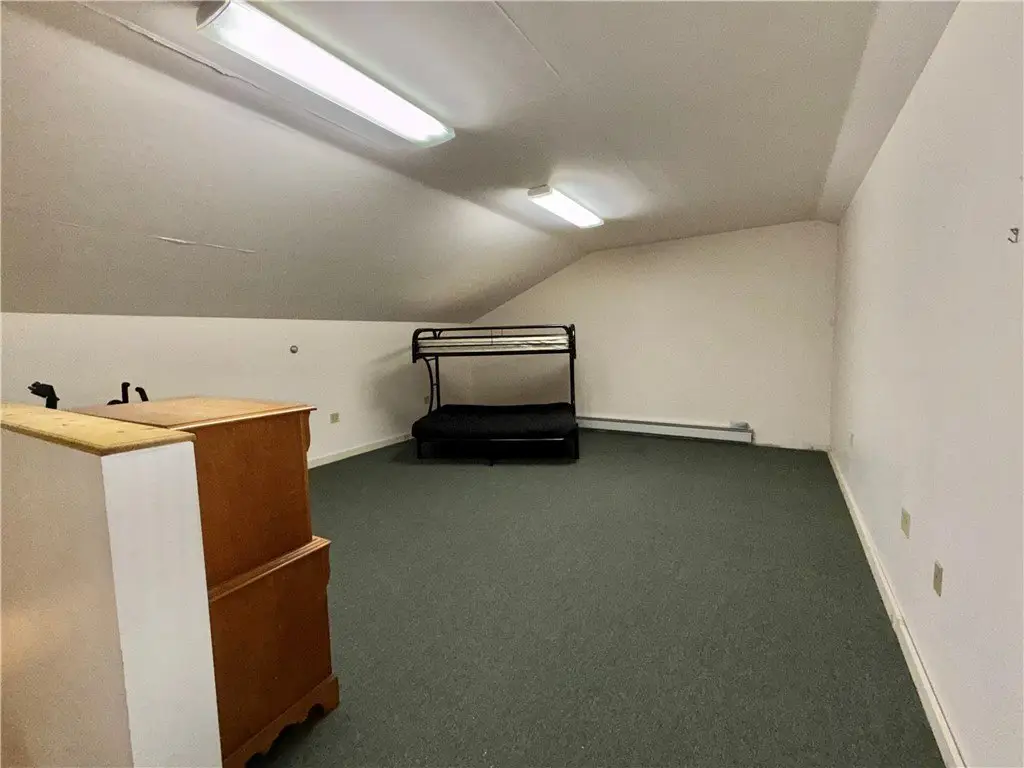
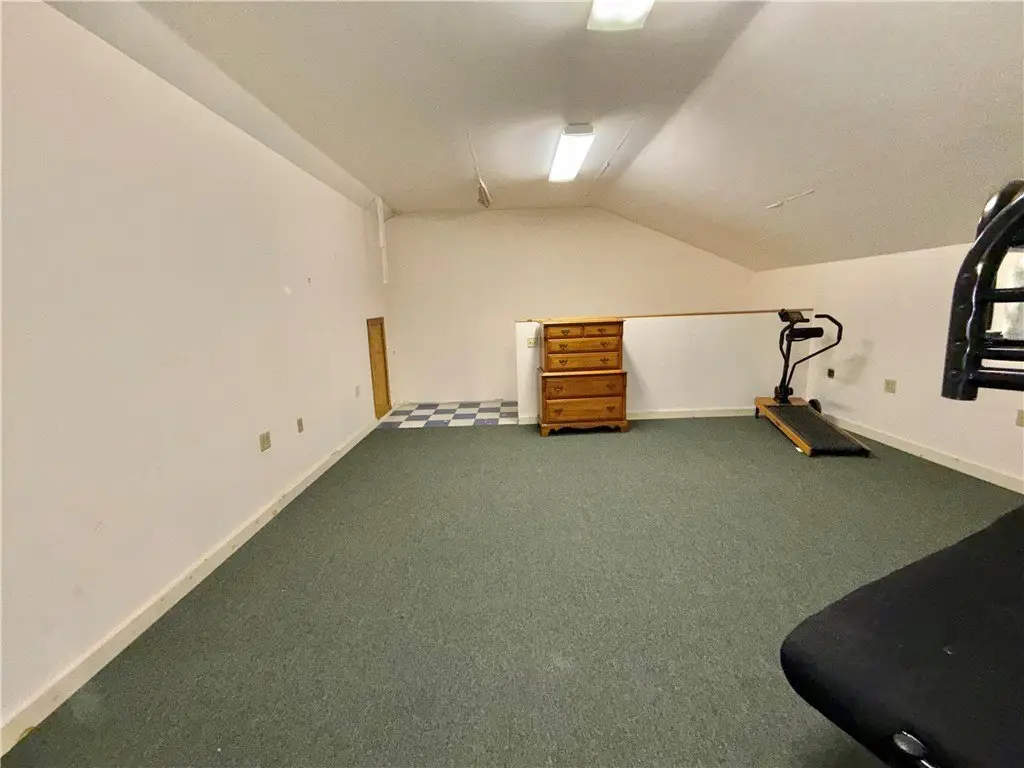
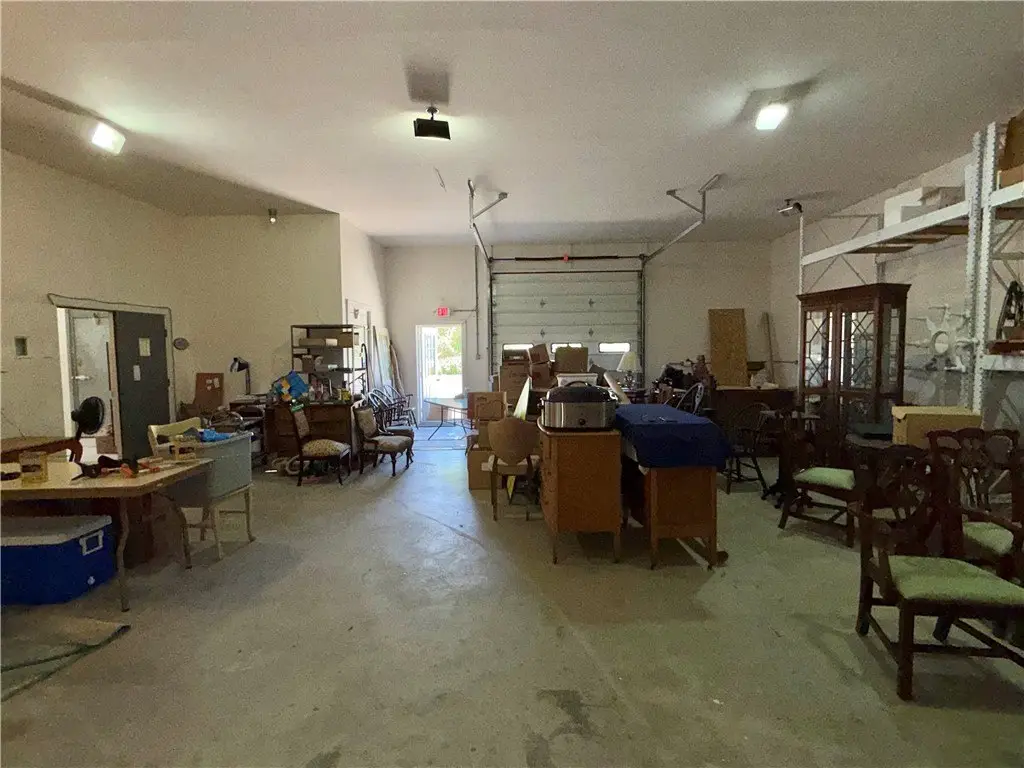
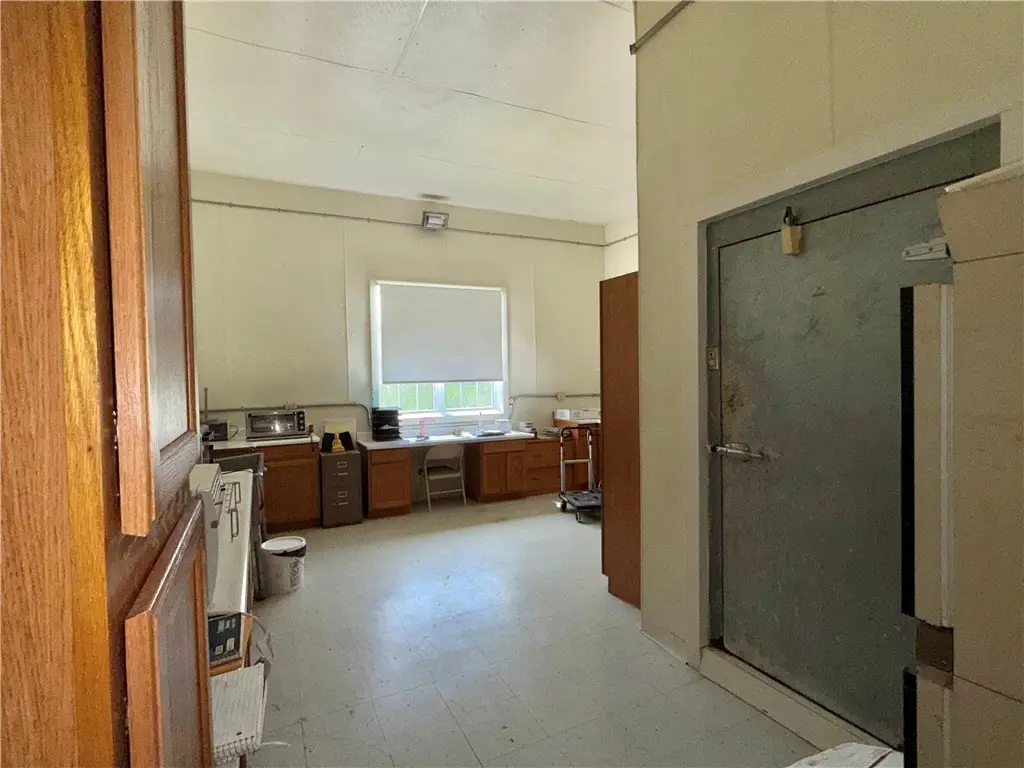
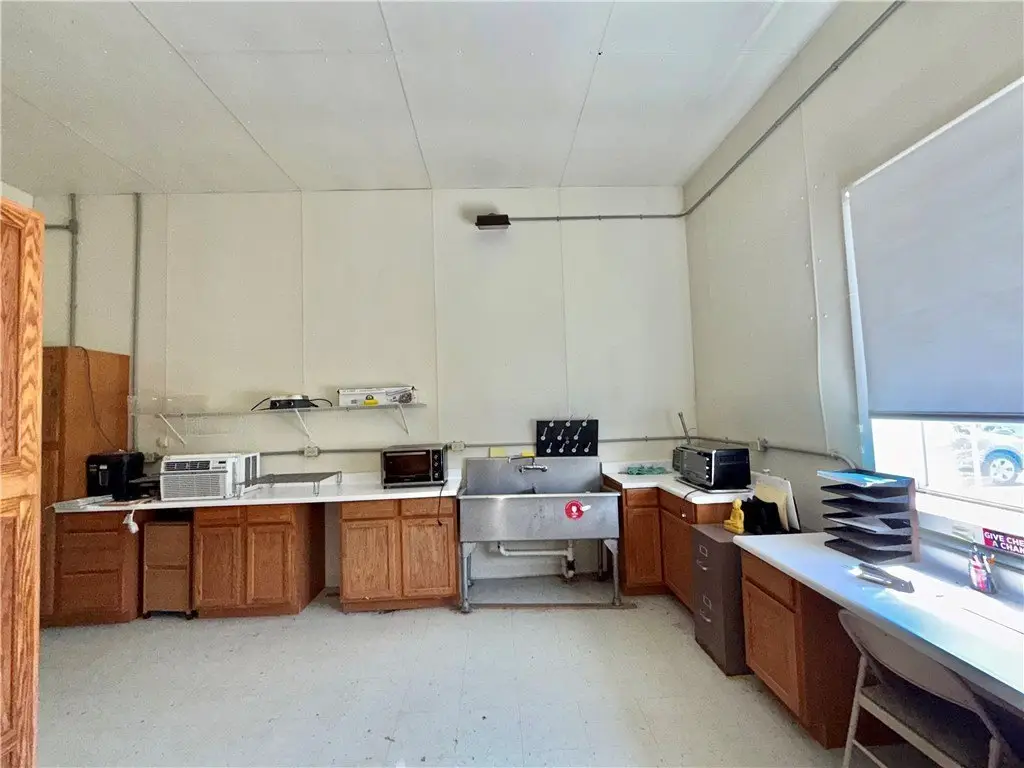
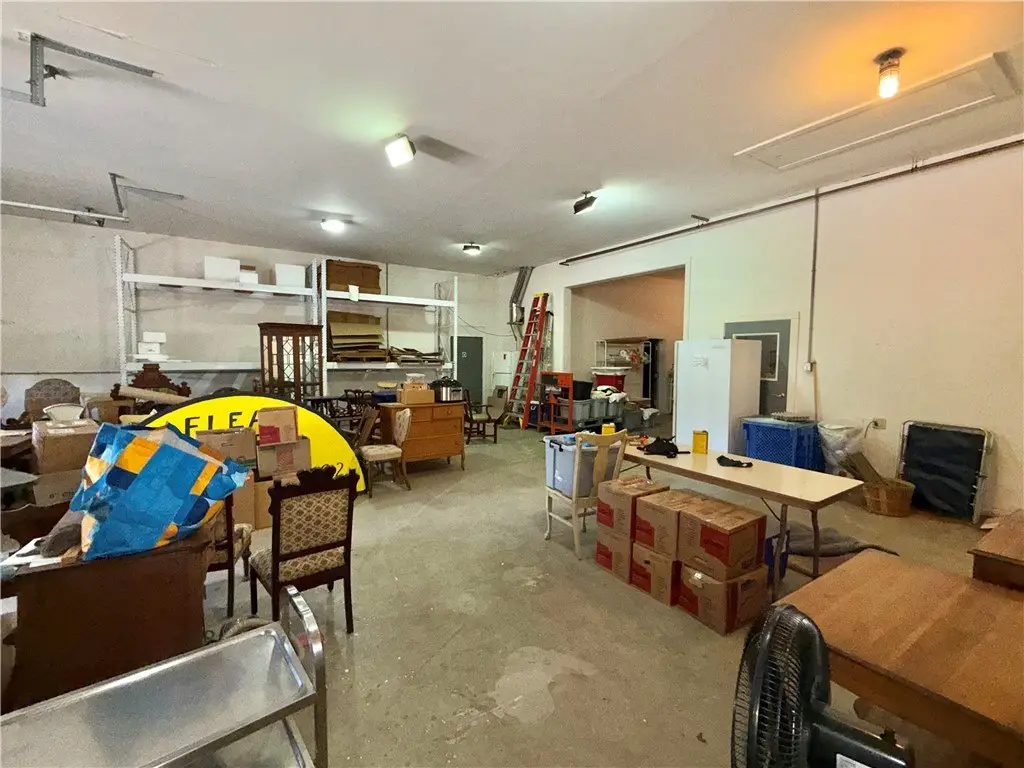
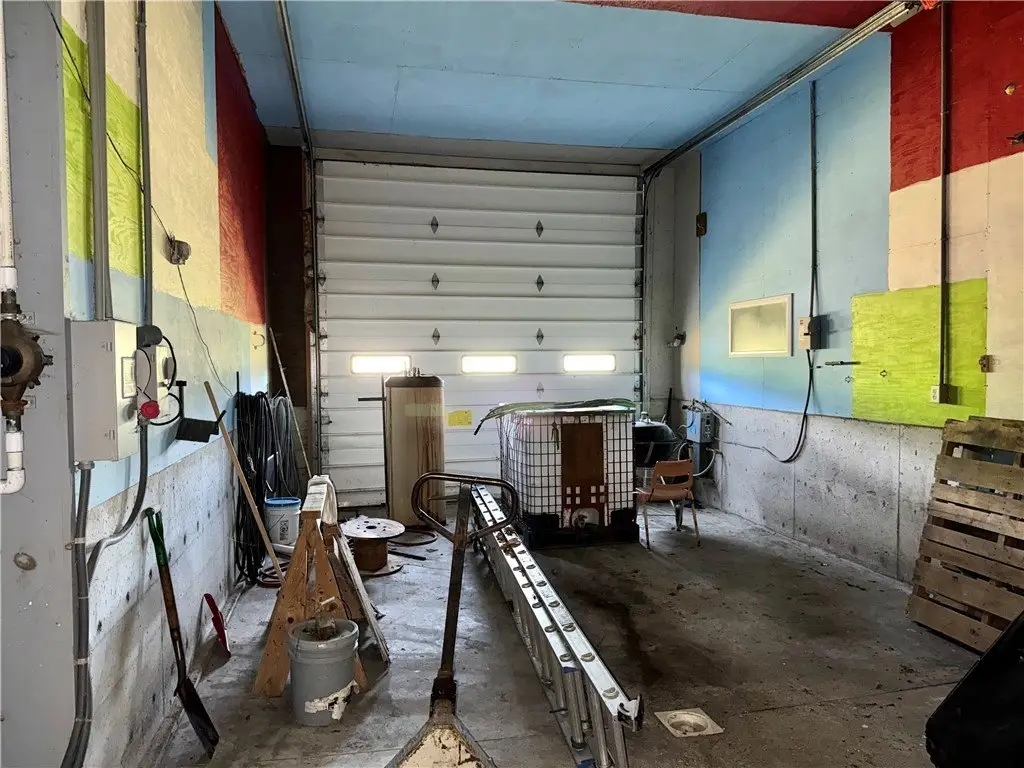
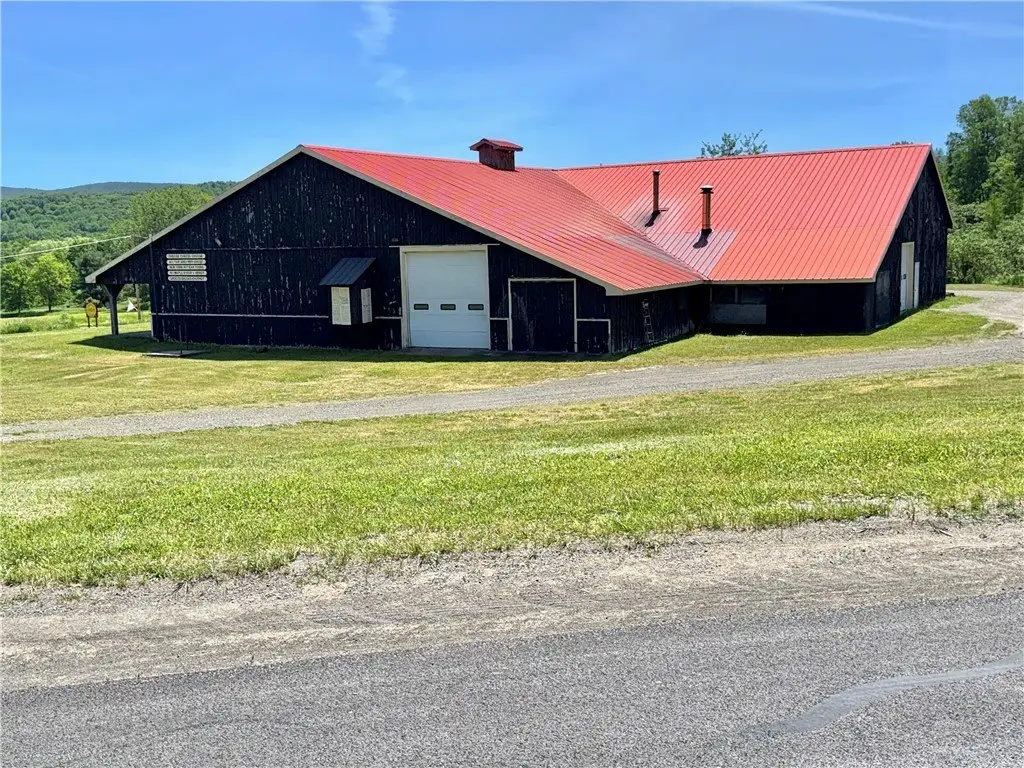
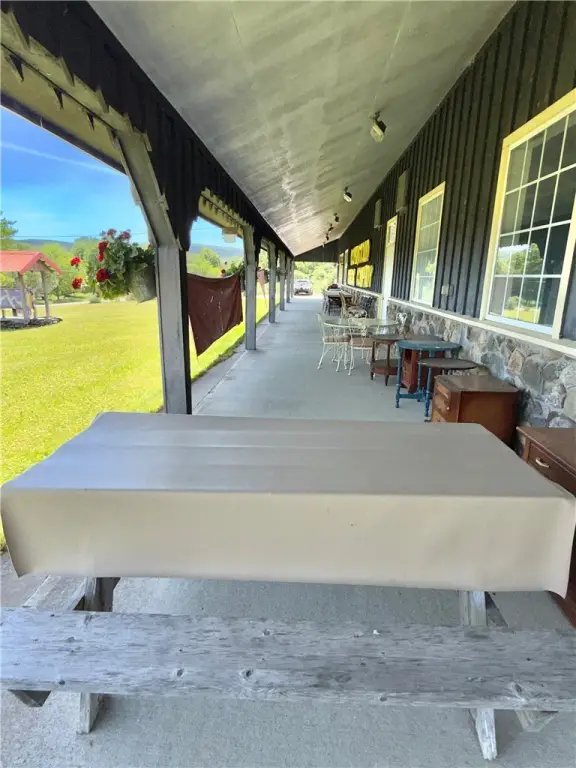
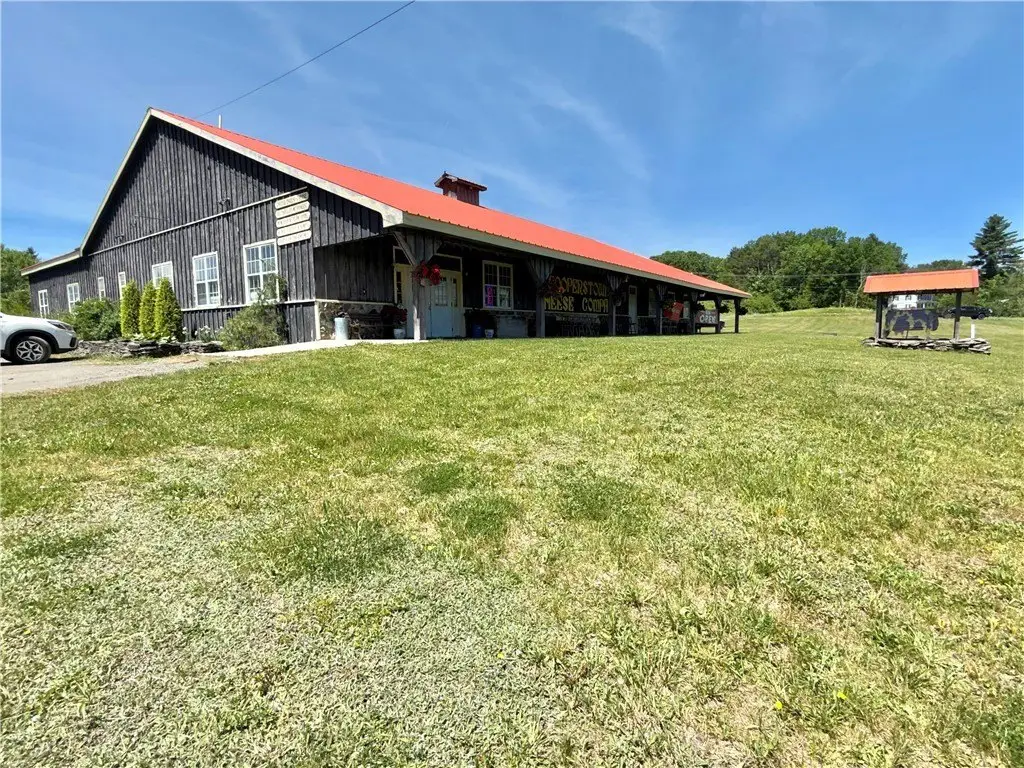
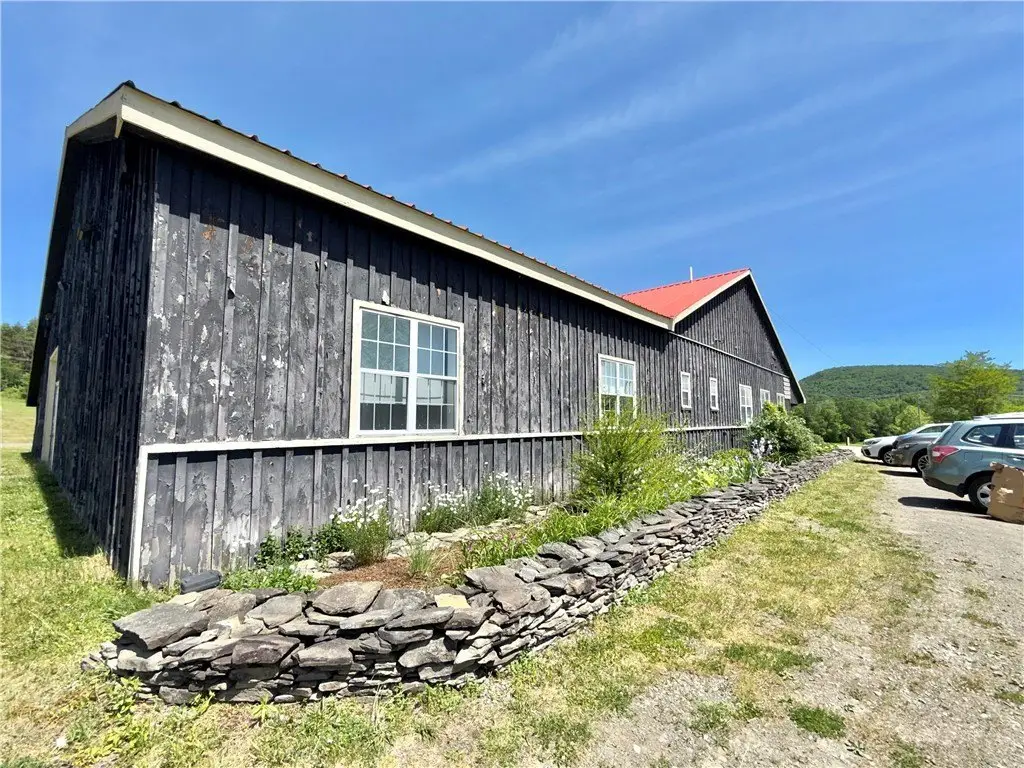
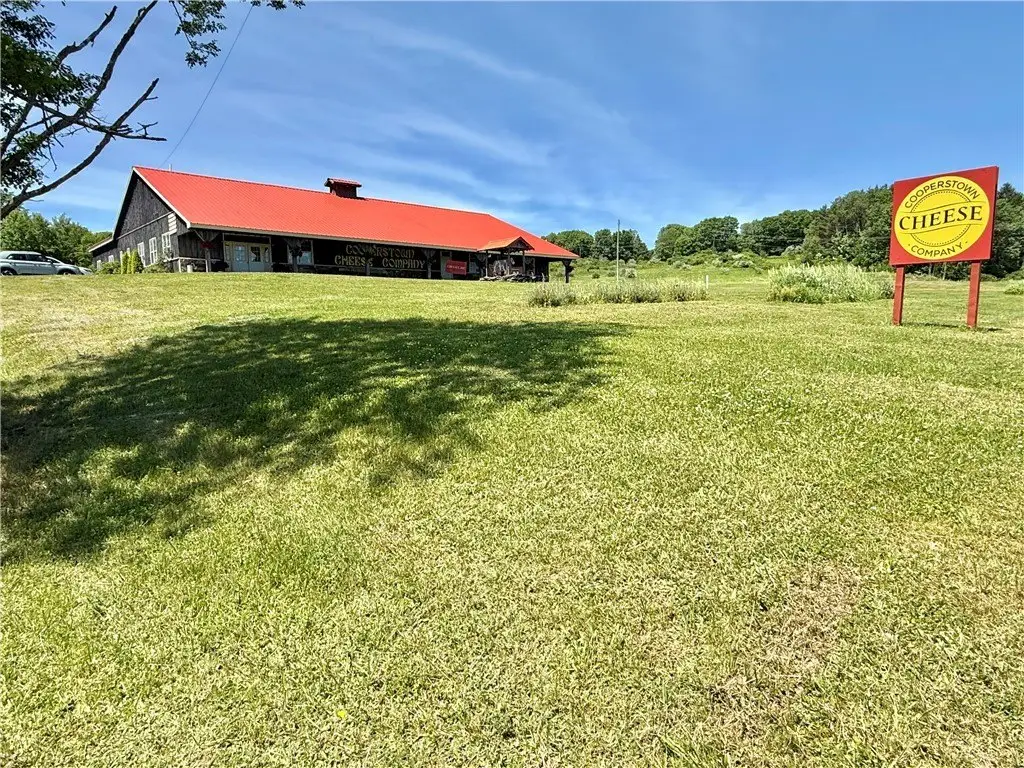
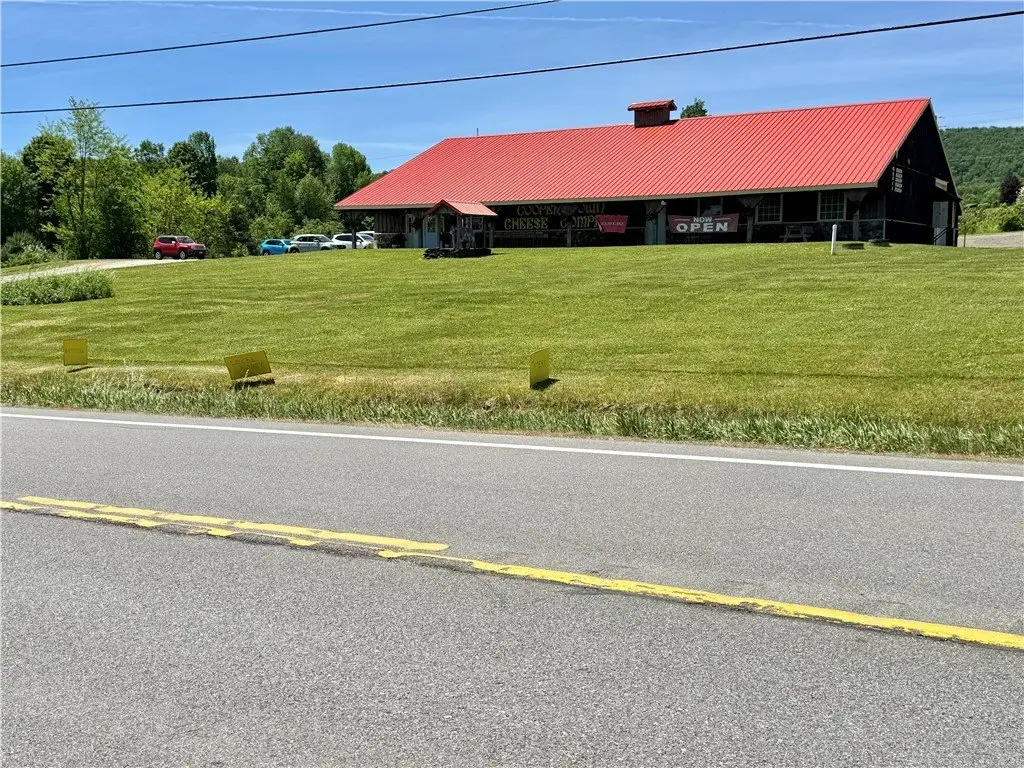
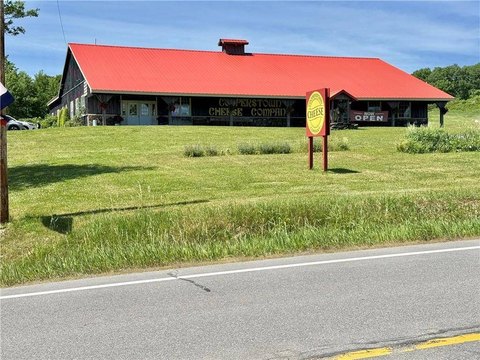
Former cheese manufacturing facility originally operated by Cooperstown Cheese Company, built in 2000 and offered for sale as an approximately 8,612-square-foot building on 2.96 acres. The property includes equipment remnants on-site, including a 500-gallon stainless evaporator and pasteurizer, along with three walk-in coolers, one measuring 25 by 28. A finished retail area is in place with rustic knotty pine and multiple door coolers, and it currently includes a short-term lease tenant. The property is supported by two heating systems, an oil-fired hot water boiler with radiant heat and a steam boiler. A second-floor loft area could potentially be converted to living space, subject to local code requirements.
The facility is located at 3941 State Highway 28 in Milford, NY, on a corner lot. Public remarks describe the setting as a prime gateway to Cooperstown Dreams Park and the National Baseball Hall of Fame, with proximity described as only minutes to the summer destination.
This building may fit buyers seeking to revitalize an existing food production footprint or pivot to light manufacturing combined with on-site retail, using the established refrigerated improvements as part of the overall operating layout. The presence of the finished retail area and existing coolers can be useful for users looking to support product handling and customer-facing space within the same facility.
The facility is located at 3941 State Highway 28 in Milford, NY, on a corner lot. Public remarks describe the setting as a prime gateway to Cooperstown Dreams Park and the National Baseball Hall of Fame, with proximity described as only minutes to the summer destination.
This building may fit buyers seeking to revitalize an existing food production footprint or pivot to light manufacturing combined with on-site retail, using the established refrigerated improvements as part of the overall operating layout. The presence of the finished retail area and existing coolers can be useful for users looking to support product handling and customer-facing space within the same facility.
Key Highlights
- Former Cooperstown cheese manufacturing facility with 8,000+ sqft of space built in 2000
- 2.96‑acre corner lot on the gateway to Cooperstown Dreams Park and the National Baseball Hall of Fame
- Includes three walk‑in coolers, including a 25x28 walk‑in, plus 9 door and 2 door coolers in the retail area
Financial Insights For Industrial
Simulate Cap Rate and NOI
NOI Build-Up
- Vacancy
- income lost from leasable area expected to sit empty during the year — subtracted from gross rent.
- EGI (Effective Gross Income)
- gross rent minus vacancy losses — the realistic income before paying operating costs.
- OpEx (Operating Expenses)
- recurring costs to operate the property (property tax, insurance, utilities, maintenance, management) — excludes financing and capital improvements.
- NOI (Net Operating Income)
- income a property generates after operating costs but before financing and taxes.
| Component | $ | $/SF |
|---|---|---|
| Gross rent | $81.6k | $9.48 |
| − Vacancy | −$5.6k | −$0.64 |
| EGI | $76.1k | $8.84 |
| − OpEx | −$22.8k | −$2.65 |
| NOI | $53.3k | $6.18 |
8,612 SF · lease $9.48/SF/yr · vacancy 6.80% · expense 30.00%
Alternative Uses
Best Use
Retail
$1.19M
$1.04M – $1.39M
NOI $83,163 @ 7.0% cap · market cap 13.86%
Second Best
Industrial
$760.9K
$665.8K – $887.7K
NOI $53,263 @ 7.0% cap · market cap 8.88%
Theoretical Best
Office A
$2.37M
$2.08M – $2.77M
NOI $166,177 @ 7.0% cap · market cap 27.70%
Zoning and permitted uses should be independently verified with local authorities.
Property Analytics
Property Profile
Location Intelligence
Current Use by Public Records
Manufacturing properties






FAQs
What type of property is this?
Manufacturing property - Former cheese manufacturing facility with multiple walk-in coolers and a finished retail space for potential mixed use.
Where is this manufacturing property located?
The property is located at 3941 State Highway 28 Milford, NY.
What is the asking price?
The asking price for this property is $599,900.
What are key features of this property?
This property features: Former Cooperstown cheese manufacturing facility with 8,000+ sqft of space built in 2000; 2.96‑acre corner lot on the gateway to Cooperstown Dreams Park and the National Baseball Hall of Fame; Includes three walk‑in coolers, including a 25x28 walk‑in, plus 9 door and 2 door coolers in the retail area


