Highland Plaza Shopping
For Sale
Contact for pricing
3901 Hixson Pike, Chattanooga, TN 37415
Established commercial center serving the Chattanooga market since 1989.
Property Size129,071 SF
Price / SF$100.87
Days on Market53
Property Features for 3901 Hixson Pike
General Information
Standard status
Active
Size
129,071 SF
Property subtype
Retail
Occupancy
100%
Lease Type
NNN
Net Operating Income
$976,485
Building Details
Year Built
1989
Stories
1
Listing Agency:
Marcus & Millichap - Atlanta
Listed By:
Zachary Taylor · License #GA 266327
(678) 808-2780
Source:
Crexi
Added: Aug 27
Changed: Oct 16
Last Checked: Oct 16 at 6:03AM
Displayed information is deemed reliable but is not guaranteed and should be independently verified. All listing content including descriptions, pricing, images are the copyrighted material of Marcus & Millichap - Atlanta

Ask AI about this property
Review the available facts, identify missing information and prepare questions for the agent.
Investment Insights
Based on property information with market context.
Highland Plaza is a shopping center located at 3901 Hixson Pike in Chattanooga, Tennessee. The property was built in 1989 and is identified for sale as a commercial retail asset.
Its location places the center within ZIP code 37415 and the Chattanooga MSA, providing a defined address for retail ownership and leasing consideration.
Its location places the center within ZIP code 37415 and the Chattanooga MSA, providing a defined address for retail ownership and leasing consideration.
Key Highlights
- Shopping center at 3901 Hixson Pike, Chattanooga, TN 37415
- Built in 1989
- Located within the Chattanooga MSA
Financial Insights
Estimated NOI and Cap Rate
NOI / Yr
$997,461
Cap Rate
7.66%
Suggested Prices Based on Cap Rates
Cap Rate 5%
$19,949,220
$19.9M
Cap Rate 7%
$14,249,443
$14.2M
Cap Rate 9%
$11,082,900
$11.1M
Market Conditions
NOI Build-Up for 129,071 SF
Gross rent
$1.55M $12.00/SF
− Vacancy
−$123.9K −$0.96/SF
EGI
$1.42M $11.04/SF
− OpEx
−$427.5K −$3.31/SF
NOI
$997.5K $7.73/SF
Area
Chattanooga, TN
Vacancy
8.00%
Lease Rate
$12.00 /SF/Yr
Expense Ratio
30.00%
Simulate Cap Rate and NOI
Suggested Prices Based on Cap Rates
Cap Rate 5%
$19,949,220
Cap Rate 7%
$14,249,443
Cap Rate 9%
$11,082,900
Alternative Uses
Best Use
Retail
$14.25M
$12.47M – $16.62M
NOI $997,461 @ 7.0% cap · market cap 7.66%
Second Best
—
—
no second resolved use
Theoretical Best
Office A
$28.51M
$24.94M – $33.26M
NOI $1,995,417 @ 7.0% cap · market cap 15.33%
Zoning and permitted uses should be independently verified with authorities.
How Realmo checks its estimates
Property Analytics
Unlock full access to Insights
Subscribe to Realmo Intelligence
Open Analytics
Current Use
Location Intelligence
Trade Area within ½ mile
430
Businesses Nearby
141k
Monthly Visits Nearby
Under-served
Demand for This Use
Explore this area
Business Placement
Foot Traffic Nearby
Shops & Services 41%
Groceries 29%
Dining 18%
Superstores 12%
Walmart Neighborhood Market
Groceries
40,370 visits/mo
0.1 miles
Weigel's
Shops & Services
20,530 visits/mo
0.3 miles
Big Lots
Superstores
17,309 visits/mo
0.1 miles
Five Below
Shops & Services
14,742 visits/mo
0.2 miles
Taco Bell
Dining
12,193 visits/mo
0.5 miles
Demographics for 37415, TN
23,580
Population
11,970
Households
2
Avg Household Size
38
Median Age
45%
College-Educated
95%
High-School Grad
17.5 sq mi
ZIP Area
1,347
Density / Sq Mi
$67,027
Median Household Income
$42,933
Median Earnings
$1,240
Median Rent
$261,900
Median Home Value
Check the figures for this property
Cap Rate, Value Estimation, Potential NOI and more
View Realmo Analytics
Market
Vacancy Rate% for Retail in South region


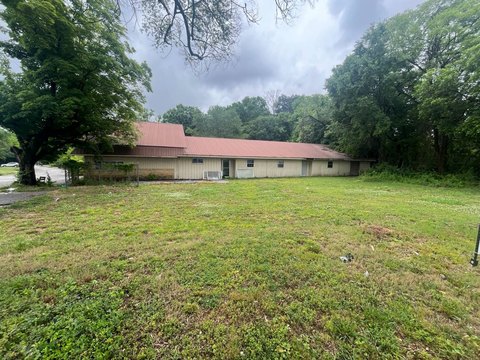


Similar Off Market Nearby
- Rivermont Shopping Center — 3600 Hixson Pike, Chattanooga, TN 37415
Frequently Asked Questions
What type of property is this?
Shopping center - Established commercial center serving the Chattanooga market since 1989.
Where is this shopping center located?
The property is located at 3901 Hixson Pike Chattanooga, TN.
What is the asking price?
The asking price for this property is $13,020,000.
What are key features of this property?
This property features: Shopping center at 3901 Hixson Pike, Chattanooga, TN 37415; Built in 1989; Located within the Chattanooga MSA


