Two-Unit Income
For Sale
$219,900
Pending
389 Lillian Ave, Syracuse, NY 13206
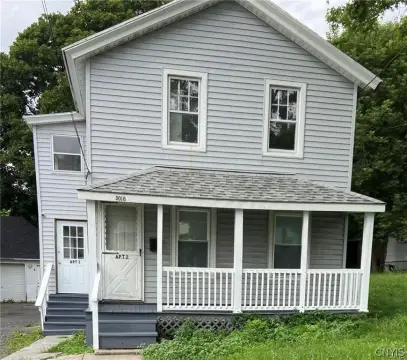
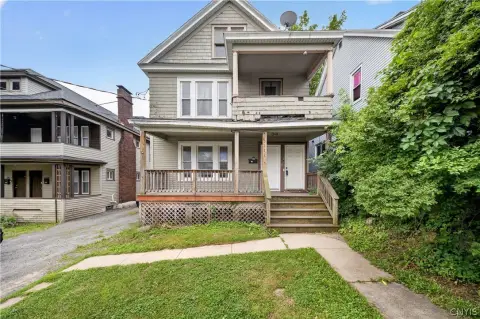
Two-unit duplex with one month-to-month tenant and an additional vacant unit plus backyard lots for parking.
Property Size2,080 SF
Days on Market143
Property Features for 389 Lillian Ave
General Information
Standard status
Pending
Size
2,080 SF
Property subtype
Multi Family
Additional Details
Multifamily Units
2
Taxes and HOA fees
Annual Taxes
$4,877
Building Details
Building Size
2,080 SF
Year Built
1930
Stories
2
Units
2
Tenancy
Multi
Listing Agency:
eXp Realty
Listed By:
Richard McCarron · License #10301210568
(888) 276-0630
Source:
Elliman
Added: Jun 1
Changed: Oct 19
Last Checked: Oct 20 at 10:13PM
Displayed information is deemed reliable but is not guaranteed and should be independently verified. All listing content including descriptions, pricing, images are the copyrighted material of eXp Realty

Ask AI about this property
Review the available facts, identify missing information and prepare questions for the agent.
Investment Insights
Based on property information with market context.
This two-unit income duplex includes a first-floor 3-bedroom, 1-bath apartment with a large eat-in kitchen and living room. The first-floor unit is currently rented on a month-to-month basis for $1,450. The second-floor unit offers two bedrooms, including one with a walk-in closet and the other with built-ins, along with a large eat-in kitchen, living room, and a full bath. The second-floor unit is currently vacant. The property is described as having more than 2,000 square feet of living space between the two apartments.
The property includes two backyard lots on Fobes Ave (250 and 258), which provide additional parking for the home. The provided mobility metrics indicate a BikeScore of 53, a WalkScore of 72, and a TransitScore of 36.
For buyers seeking a straightforward duplex structure, this asset provides immediate rental income from the month-to-month lower unit while also offering flexibility with a vacant second-floor unit that can be prepared for new occupancy. The added backyard lot parking can be a practical benefit for tenants using onsite space.
The property includes two backyard lots on Fobes Ave (250 and 258), which provide additional parking for the home. The provided mobility metrics indicate a BikeScore of 53, a WalkScore of 72, and a TransitScore of 36.
For buyers seeking a straightforward duplex structure, this asset provides immediate rental income from the month-to-month lower unit while also offering flexibility with a vacant second-floor unit that can be prepared for new occupancy. The added backyard lot parking can be a practical benefit for tenants using onsite space.
Key Highlights
- Two‑unit duplex built in 1930 with more than 2,000 SF of living space between the units
- First‑floor unit: 3 bed, 1 full bath, large eat‑in kitchen and living room; rented month‑to‑month for $1,450
- Second‑floor unit: 2 bed, 1 full bath with walk‑in closet and built‑ins; currently vacant (previously $1,300/month)
Financial Insights
Estimated NOI and Cap Rate
NOI / Yr
$19,639
Cap Rate
8.93%
Suggested Prices Based on Cap Rates
Cap Rate 5%
$392,780
$392.8K
Cap Rate 7%
$280,557
$280.6K
Cap Rate 9%
$218,211
$218.2K
Market Conditions
NOI Build-Up for 2,080 SF
Gross rent
$38.2K $18.36/SF
− Vacancy
−$2.5K −$1.19/SF
EGI
$35.7K $17.17/SF
− OpEx
−$16.1K −$7.72/SF
NOI
$19.6K $9.44/SF
Area
Syracuse, NY
Vacancy
6.50%
Lease Rate
$18.36 /SF/Yr
Expense Ratio
45.00%
Simulate Cap Rate and NOI
Suggested Prices Based on Cap Rates
Cap Rate 5%
$392,780
Cap Rate 7%
$280,557
Cap Rate 9%
$218,211
Alternative Uses
Best Use
Multifamily LT 5
$316.2K
$276.7K – $368.9K
NOI $22,132 @ 7.0% cap · market cap 10.06%
Second Best
Apartment 5plus
$280.6K
$245.5K – $327.3K
NOI $19,639 @ 7.0% cap · market cap 8.93%
Theoretical Best
Office A
$361.5K
$316.3K – $421.7K
NOI $25,303 @ 7.0% cap · market cap 11.51%
Zoning and permitted uses should be independently verified with authorities.
How Realmo checks its estimates
Property Analytics
Who owns this building?
See the owner, sales and loan history
Open Analytics
Lease Details
2
Residential units
Multi-tenant
Tenancy
Location Intelligence
Trade Area within ½ mile
1,045
Businesses Nearby
Explore this area
Business Placement
Demographics for 13206, NY
16,599
Population
8,460
Households
2
Avg Household Size
38
Median Age
27%
College-Educated
90%
High-School Grad
4.1 sq mi
ZIP Area
4,049
Density / Sq Mi
$60,314
Median Household Income
$40,429
Median Earnings
$952
Median Rent
$130,300
Median Home Value
Check the figures for this property
Cap Rate, Value Estimation, Potential NOI and more
View Realmo Analytics
Market
Vacancy Rate% for Multifamily in Northeast region



Frequently Asked Questions
What type of property is this?
Duplex - Two-unit duplex with one month-to-month tenant and an additional vacant unit plus backyard lots for parking.
Where is this duplex located?
The property is located at 389 Lillian Ave Syracuse, NY.
What is the asking price?
The asking price for this property is $219,900.
What are key features of this property?
This property features: Two‑unit duplex built in 1930 with more than 2,000 SF of living space between the units; First‑floor unit: 3 bed, 1 full bath, large eat‑in kitchen and living room; rented month‑to‑month for $1,450; Second‑floor unit: 2 bed, 1 full bath with walk‑in closet and built‑ins; currently vacant (previously $1,300/month)



