Turnkey Restored Brownstone
For Sale
$3,000,000
387 Manhattan Avenue, New York, NY 10026
Residential Income, New York, NY
Property Size2,900 SF
Price / SF$1,034
Days on Market175
Property Features for 387 Manhattan Avenue
General Information
Property type
Residential Multi Family
Property subtype
Other
Bedrooms
4
Bathrooms
3
Full bathrooms
3
Rooms
Bedroom 2, Bedroom 1, Bathroom 2, Bedroom 4, Bathroom 1, Bedroom 3, Bathroom 3
Subdivision
West Harlem
High school district
000000
Standard status
Active
Size
2,900 SF
Amenities
fireplace
roof deck
wine storage
private patio
smart home features
Building Details
Architectural style
Other
Listing Agency:
Compass
(646) 982-0353
Listed By:
Bahar Tavakolian
(212) 434-7062
Added: Apr 23
Changed: Oct 14
Last Checked: Oct 14 at 7:06PM
MLS# 11729278
Copyright © 2026 My State MLS. All rights reserved. All information provided by the listing agent/broker is deemed reliable but is not guaranteed and should be independently verified.
Investment Insights
Based on property information with market context.
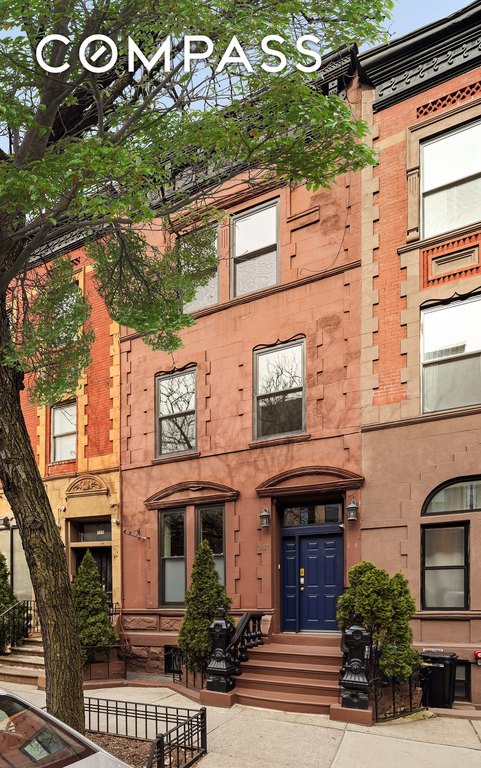
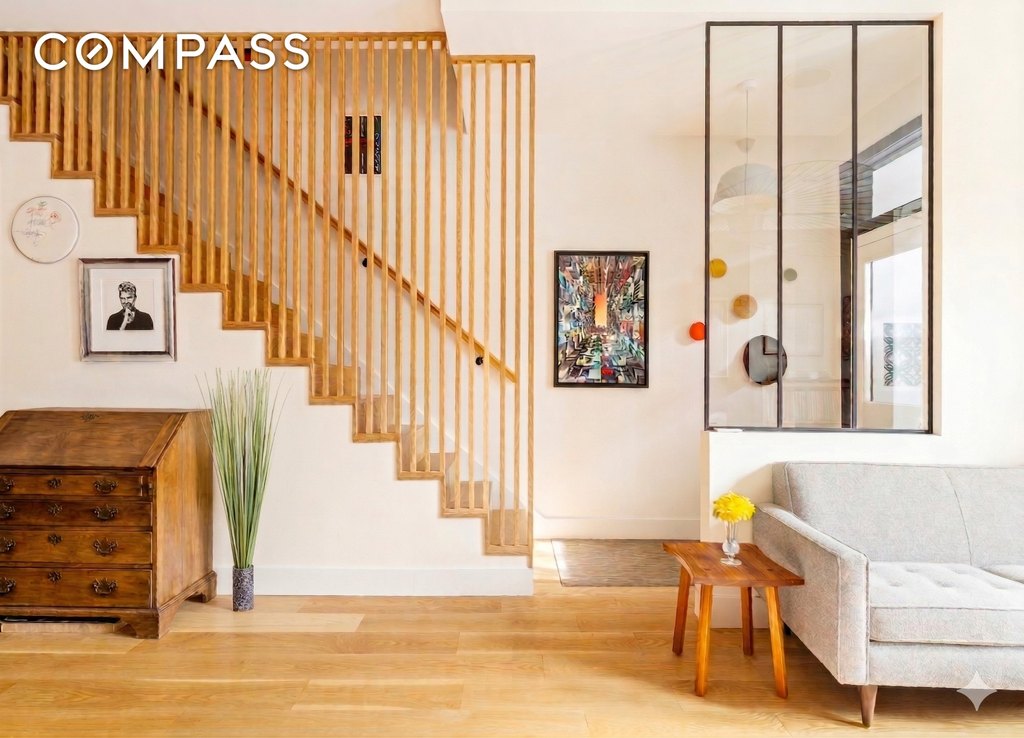
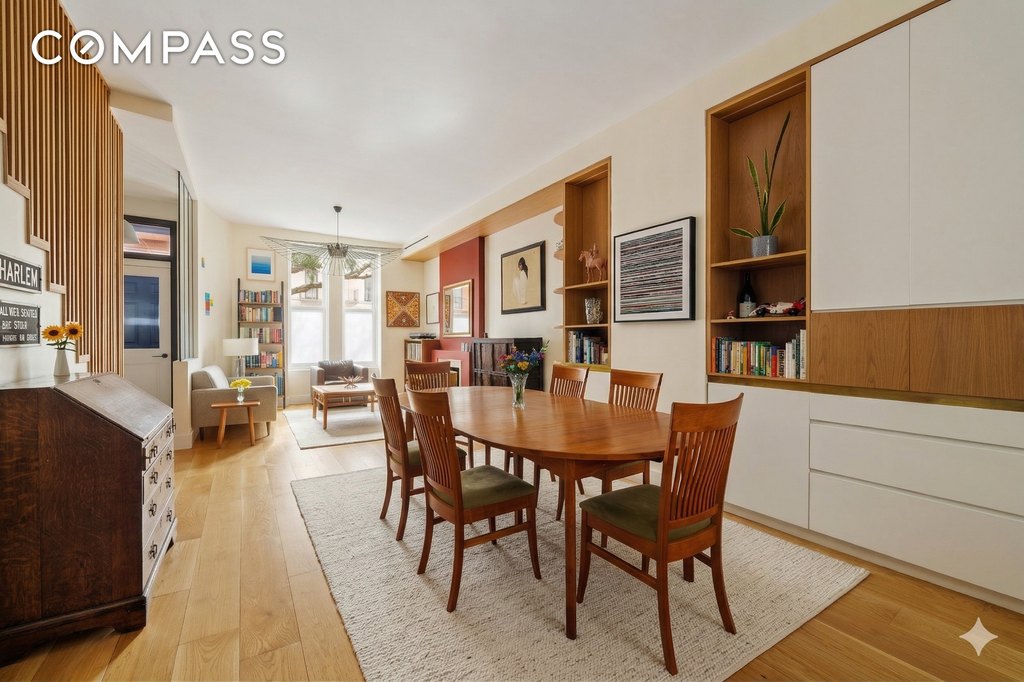
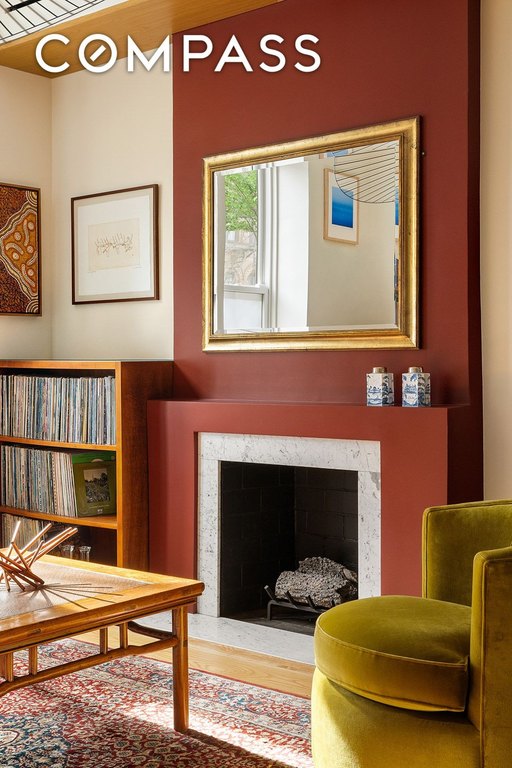
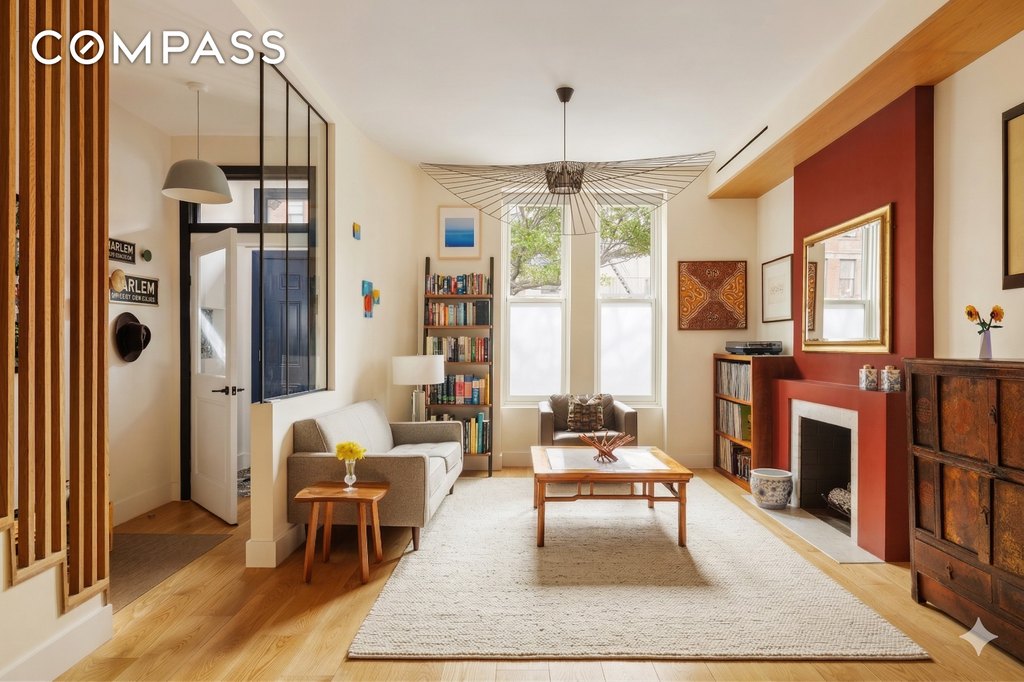
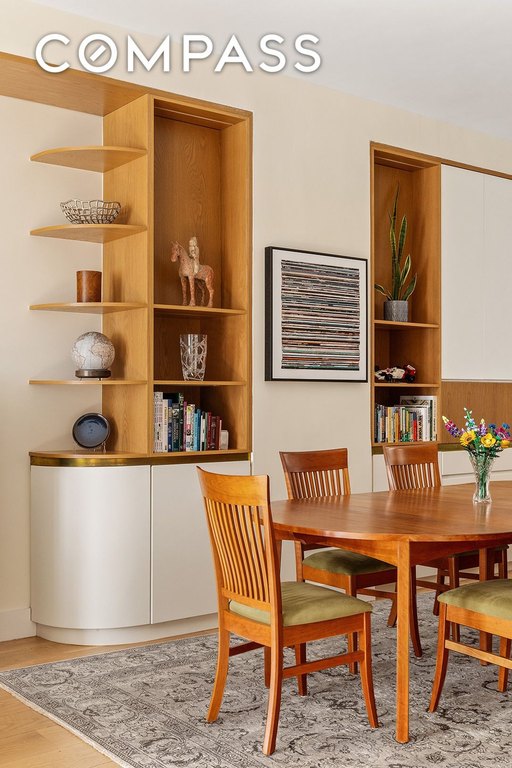
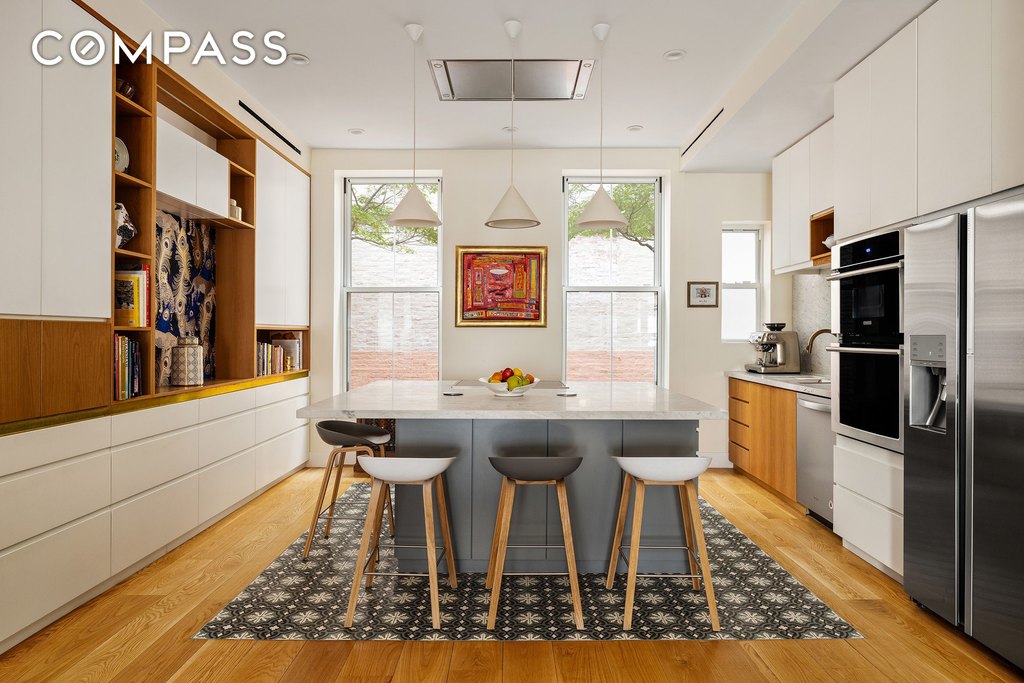
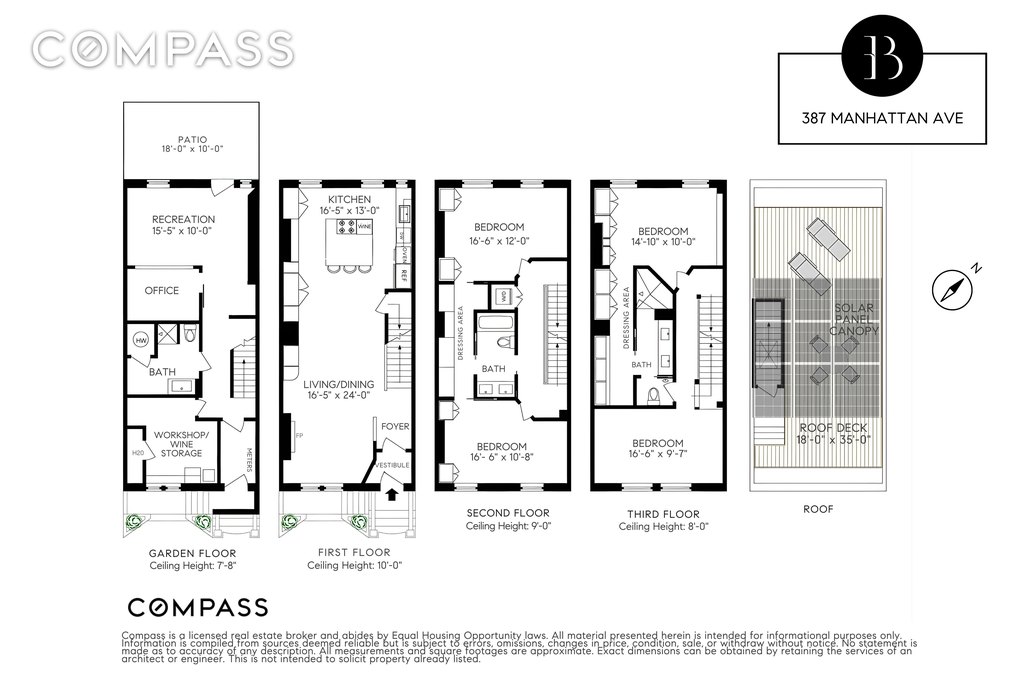
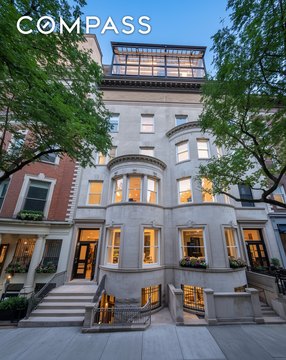
This fully restored 1880s, four-level brownstone offers a turnkey interior with cohesive upgrades throughout. The home features wide-plank white oak flooring, a custom oak staircase with a slatted railing, and upgraded major systems including multi-zone HVAC and heat pump technology with smart home features. The main level includes living and dining areas flowing into an eat-in chef’s kitchen overlooking the private outdoor space below. The all-electric kitchen includes an induction cooktop, stainless steel appliances, and custom cabinetry, with Gioia Venatino marble used across the countertops and backsplash. A working fireplace anchors the living area.
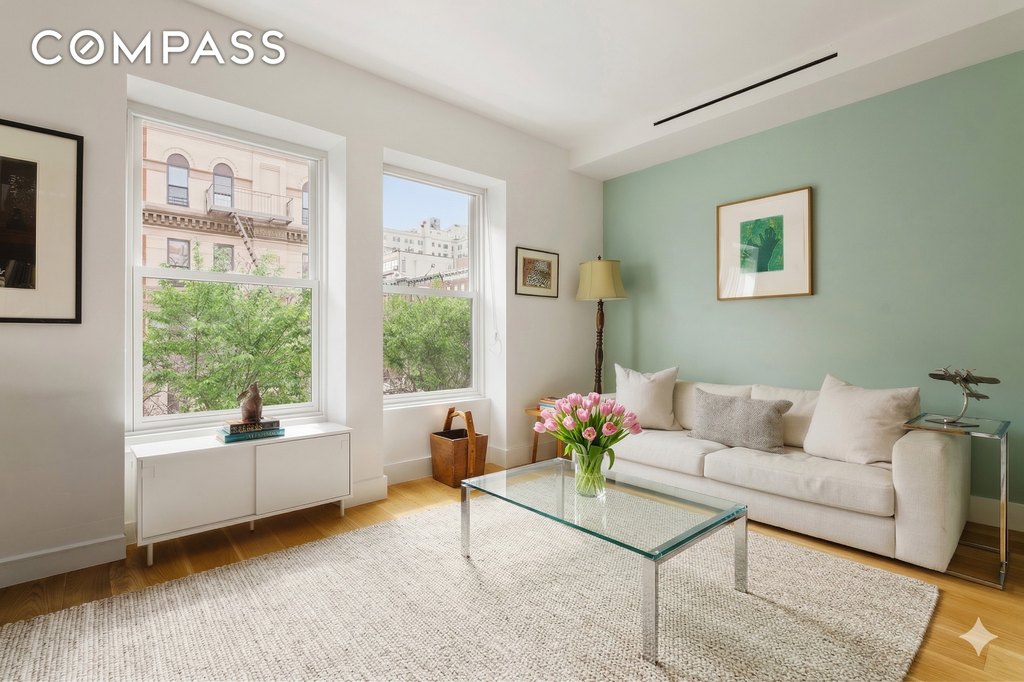
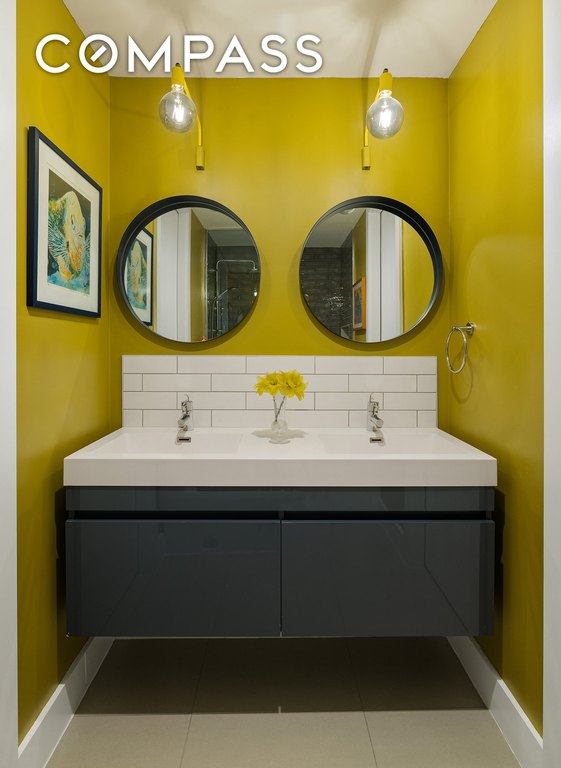
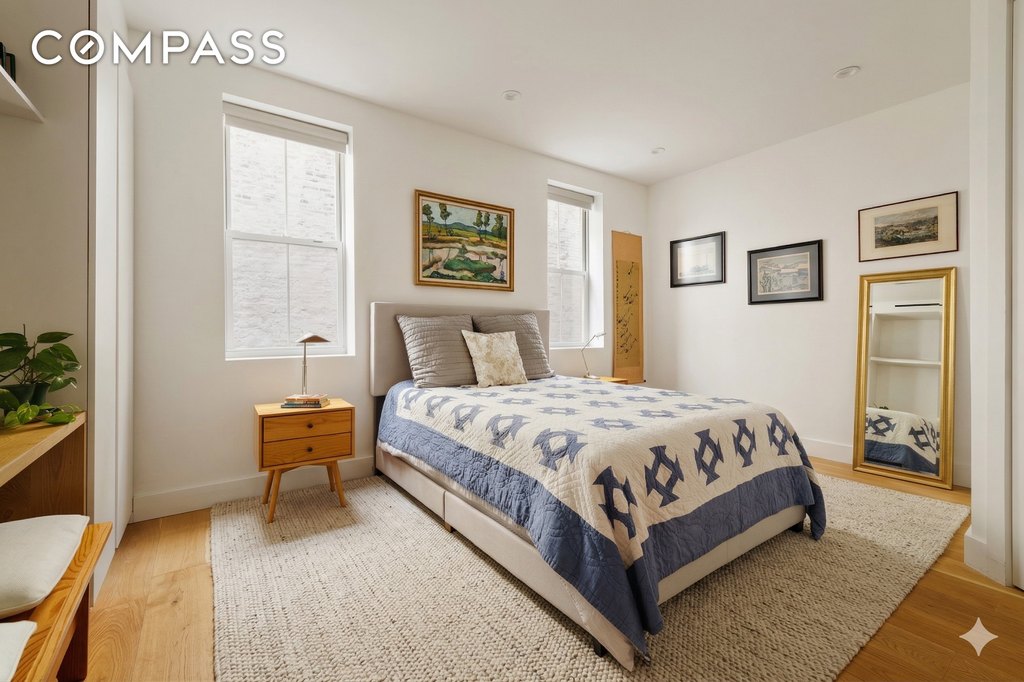
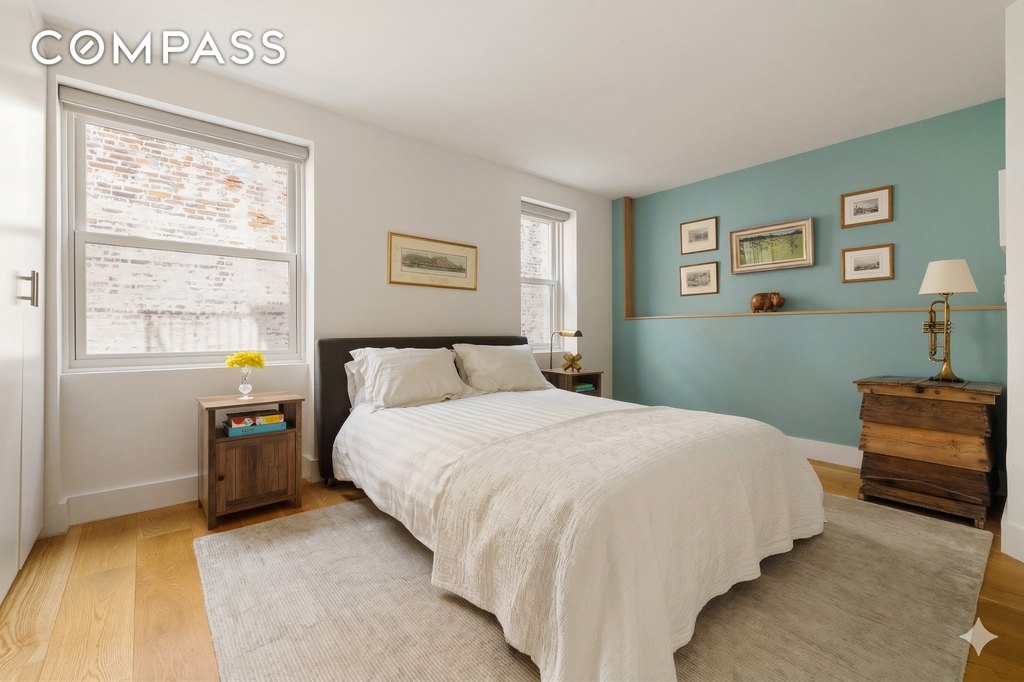
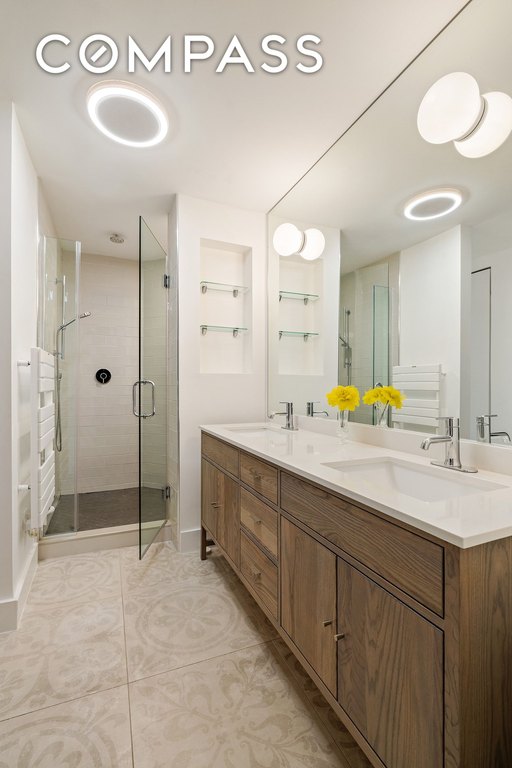
The second level has two bedrooms with custom built-ins and ample storage, plus a dressing area with a pass-through closet. There is a Jack-and-Jill bathroom with double vanity and a tub with shower, designed to work as shared or as an en-suite configuration. A high-end LG washer and dryer are also located on this level.
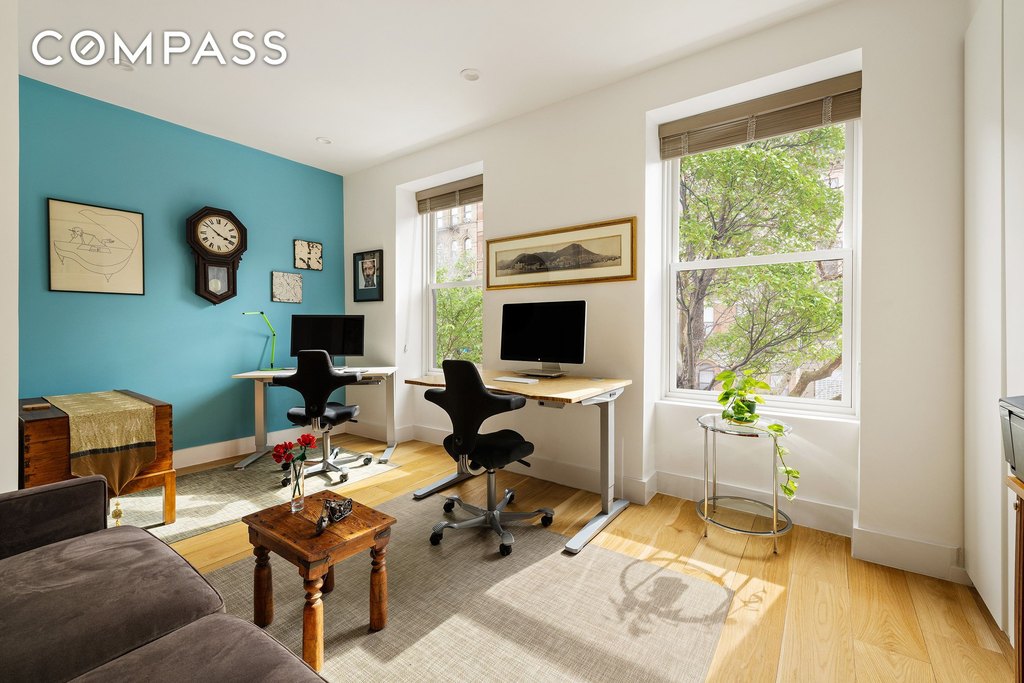
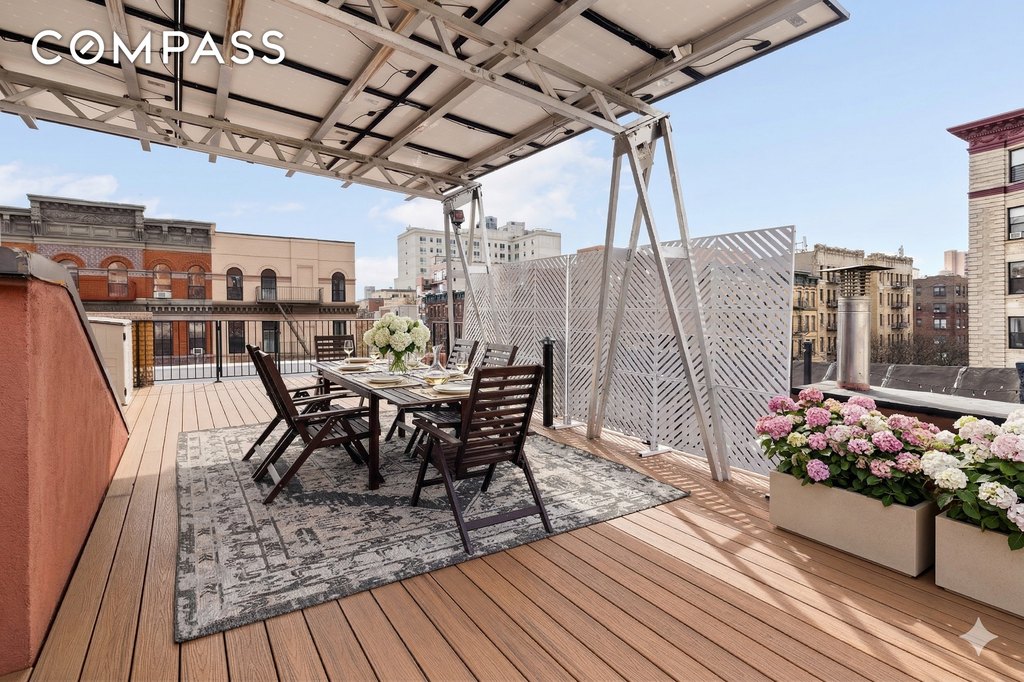
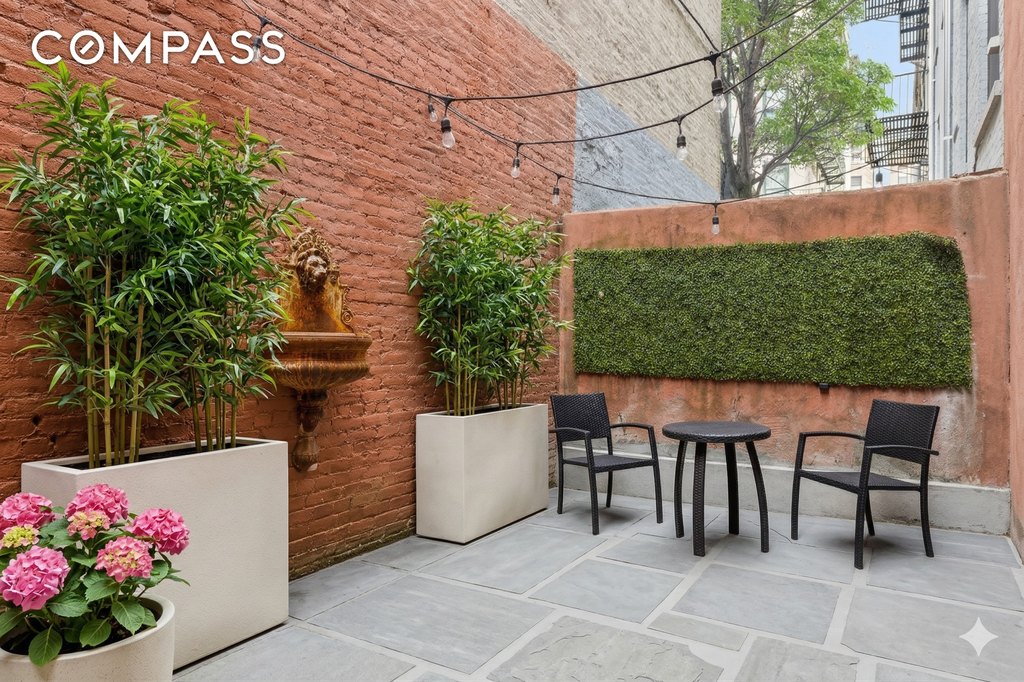
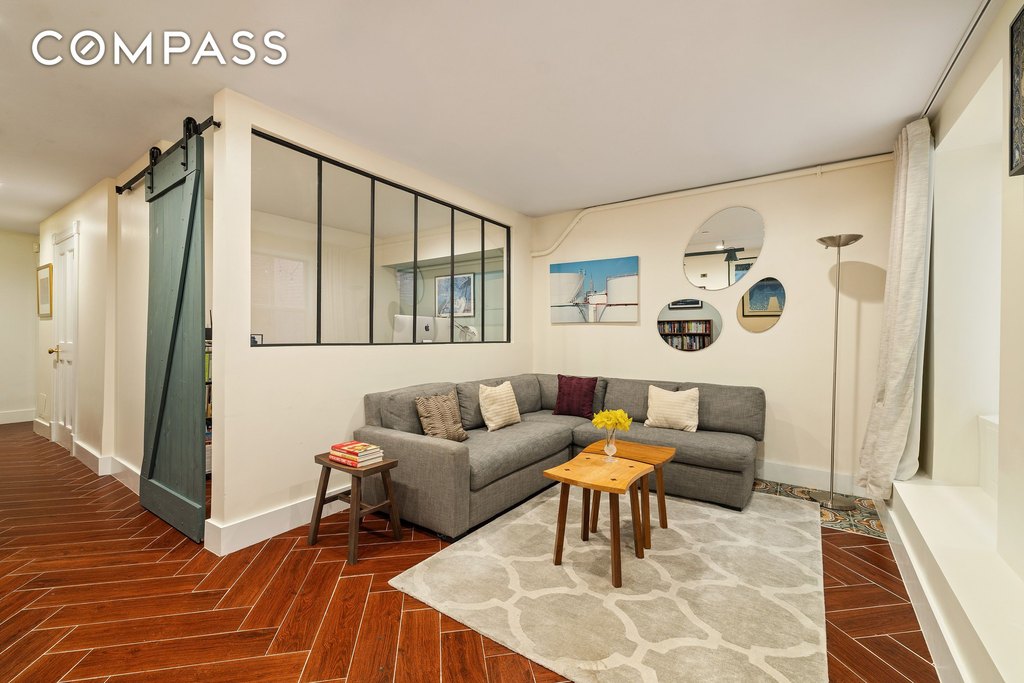
The primary suite occupies the rear on the third level and includes an en-suite bath with double vanity and a walk-in rainfall shower. A fourth room across the hall functions as a bedroom or media room and includes a ceiling-mounted projector and open views. The garden level offers flexibility with internal access and a private street entrance, including a den or home office, full bathroom, wine storage, and direct access to a bluestone patio. A roughly 600-square-foot roof deck sits beneath a solar panel canopy with 18 panels supplying approximately half of the home’s current energy needs.
The second level has two bedrooms with custom built-ins and ample storage, plus a dressing area with a pass-through closet. There is a Jack-and-Jill bathroom with double vanity and a tub with shower, designed to work as shared or as an en-suite configuration. A high-end LG washer and dryer are also located on this level.
The primary suite occupies the rear on the third level and includes an en-suite bath with double vanity and a walk-in rainfall shower. A fourth room across the hall functions as a bedroom or media room and includes a ceiling-mounted projector and open views. The garden level offers flexibility with internal access and a private street entrance, including a den or home office, full bathroom, wine storage, and direct access to a bluestone patio. A roughly 600-square-foot roof deck sits beneath a solar panel canopy with 18 panels supplying approximately half of the home’s current energy needs.
Key Highlights
- Four‑bedroom, three‑bath, four‑level restored 1880s brownstone with approx. 2,900 SF across an 18‑foot‑wide footprint
- Multi‑zone HVAC and heat pump technology plus smart home features; all‑electric kitchen with induction cooktop and stainless steel appliances
- Chef’s kitchen with Gioia Venatino marble countertops and backsplash; working fireplace in the living area
Financial Insights
Estimated NOI and Cap Rate
NOI / Yr
$90,733
Cap Rate
3.02%
Suggested Prices Based on Cap Rates
Cap Rate 5%
$1,814,660
$1.8M
Cap Rate 7%
$1,296,186
$1.3M
Cap Rate 9%
$1,008,144
$1.0M
Market Conditions
NOI Build-Up for 2,900 SF
Gross rent
$173.7K $59.88/SF
− Vacancy
−$8.7K −$2.99/SF
EGI
$165.0K $56.89/SF
− OpEx
−$74.2K −$25.60/SF
NOI
$90.7K $31.29/SF
Area
New York, NY
Vacancy
5.00%
Lease Rate
$59.88 /SF/Yr
Expense Ratio
45.00%
Simulate Cap Rate and NOI
Suggested Prices Based on Cap Rates
Cap Rate 5%
$1,814,660
Cap Rate 7%
$1,296,186
Cap Rate 9%
$1,008,144
Alternative Uses
Best Use
Apartment 5plus
$1.30M
$1.13M – $1.51M
NOI $90,733 @ 7.0% cap · market cap 3.02%
Second Best
—
—
no second resolved use
Theoretical Best
Specialty Retail
$7.22M
$6.32M – $8.42M
NOI $505,296 @ 7.0% cap · market cap 16.84%
Zoning and permitted uses should be independently verified with authorities.
How Realmo checks its estimates
Property Analytics
Unlock full access to Insights
Subscribe to Realmo Intelligence
Open Analytics
Current Use
Location Intelligence
Trade Area within ½ mile
9,322
Businesses Nearby
Explore this area
Business Placement
Demographics for 10026, NY
35,644
Population
17,648
Households
2
Avg Household Size
37
Median Age
54%
College-Educated
90%
High-School Grad
0.4 sq mi
ZIP Area
89,110
Density / Sq Mi
$74,140
Median Household Income
$56,919
Median Earnings
$1,546
Median Rent
$1,014,100
Median Home Value
Check the figures for this property
Cap Rate, Value Estimation, Potential NOI and more
View Realmo Analytics

Questions? Ask Rey
Realmo’s AI knows this listing — price, zoning, demand, history. Ask anything.






Frequently Asked Questions
What type of property is this?
Single family property - Turnkey 1880s four-level brownstone with updated systems, eat-in kitchen, and private outdoor space.
Where is this single family property located?
The property is located at 387 Manhattan Avenue New York, NY.
What is the asking price?
The asking price for this property is $3,000,000.
What are key features of this property?
This property features: Four‑bedroom, three‑bath, four‑level restored 1880s brownstone with approx. 2,900 SF across an 18‑foot‑wide footprint; Multi‑zone HVAC and heat pump technology plus smart home features; all‑electric kitchen with induction cooktop and stainless steel appliances; Chef’s kitchen with Gioia Venatino marble countertops and backsplash; working fireplace in the living area


