Class A Two-Tenant Medical
For Sale
Contact for pricing
385 Meridian Parke Lane, Greenwood, IN 46142
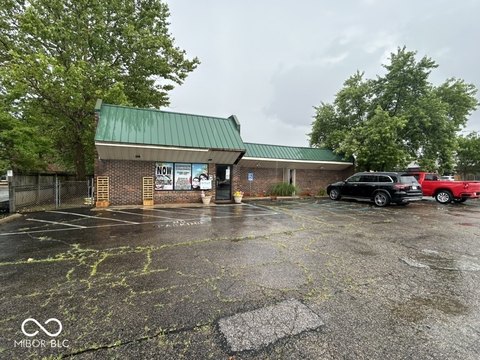
NNN-leased medical office built in 2003, featuring Class A finishes and full occupancy under an established tenant base.
Property Size12,863 SF
Price / SF$200.58
Days on Market144
Property Features for 385 Meridian Parke Lane
General Information
Standard status
Active
Size
12,863 SF
Class
A
Total Parking Spaces
28
Property subtype
Office
Occupancy
100%
Lease Type
NNN
Net Operating Income
$199,249
Building Details
Year Built
2003
Buildings
1
Tenancy
Multi
Listing Agency:
Cushman & Wakefield - Indianapolis, Indiana
Listed By:
Brooke Ratliff · License #25000924
(317) 625-1559
Source:
Crexi
Added: Jun 3
Changed: Oct 16
Last Checked: Oct 23 at 6:48AM
Displayed information is deemed reliable but is not guaranteed and should be independently verified. All listing content including descriptions, pricing, images are the copyrighted material of Cushman & Wakefield - Indianapolis, Indiana

Ask AI about this property
Review the available facts, identify missing information and prepare questions for the agent.
Investment Insights
Based on property information with market context.
385 Meridian Parke Lane is a two-tenant, NNN-leased Class A medical office building built in 2003. The property is described as well-maintained and includes Class A architectural elements such as limestone accents and upgraded tenant interior finishes. The building is currently 100% occupied, and the reported WALT is 7.67 years.
The property is located in the City of Greenwood, which is characterized in the remarks as a fast-growing bedroom community with dense single-family development and high average household incomes. The location is presented as part of a suburban healthcare submarket within the Indianapolis area.
With two medical office tenants and NNN leasing structure, the asset is positioned for buyers seeking an easy-to-manage, Class A office investment with established occupancy. Tenant interior finish upgrades and the Class A exterior design are intended to support professional medical use and day-to-day operations for the existing occupants.
The property is located in the City of Greenwood, which is characterized in the remarks as a fast-growing bedroom community with dense single-family development and high average household incomes. The location is presented as part of a suburban healthcare submarket within the Indianapolis area.
With two medical office tenants and NNN leasing structure, the asset is positioned for buyers seeking an easy-to-manage, Class A office investment with established occupancy. Tenant interior finish upgrades and the Class A exterior design are intended to support professional medical use and day-to-day operations for the existing occupants.
Key Highlights
- Two‑tenant, NNN‑leased medical office building built in 2003
- Class A medical office with limestone accents and upgraded tenant interior finishes
- 100% occupancy with a 7.67‑year WALT
Financial Insights
Estimated NOI and Cap Rate
NOI / Yr
$162,363
Cap Rate
6.29%
Suggested Prices Based on Cap Rates
Cap Rate 5%
$3,247,260
$3.2M
Cap Rate 7%
$2,319,471
$2.3M
Cap Rate 9%
$1,804,033
$1.8M
Market Conditions
NOI Build-Up for 12,863 SF
Gross rent
$254.7K $19.80/SF
− Vacancy
−$38.2K −$2.97/SF
EGI
$216.5K $16.83/SF
− OpEx
−$54.1K −$4.21/SF
NOI
$162.4K $12.62/SF
Area
Johnson County, IN
Vacancy
15.00%
Lease Rate
$19.80 /SF/Yr
Expense Ratio
25.00%
Simulate Cap Rate and NOI
Suggested Prices Based on Cap Rates
Cap Rate 5%
$3,247,260
Cap Rate 7%
$2,319,471
Cap Rate 9%
$1,804,033
Alternative Uses
Best Use
Office B
$2.32M
$2.03M – $2.71M
NOI $162,363 @ 7.0% cap · market cap 6.29%
Second Best
Healthcare Medical
$2.19M
$1.92M – $2.56M
NOI $153,345 @ 7.0% cap · market cap 5.94%
Theoretical Best
Office A
$3.24M
$2.84M – $3.78M
NOI $226,903 @ 7.0% cap · market cap 8.79%
Zoning and permitted uses should be independently verified with authorities.
How Realmo checks its estimates
Property Analytics
Contact the owner directly
Get the owner's phone numbers and email
Open Analytics
Current Use
Lease Details
100%
Occupancy
Location Intelligence
Trade Area within ½ mile
631
Businesses Nearby
Well-served
Demand for This Use
Explore this area
Business Placement
Demographics for 46142, IN
32,052
Population
14,396
Households
2.2
Avg Household Size
40
Median Age
39%
College-Educated
94%
High-School Grad
14.9 sq mi
ZIP Area
2,151
Density / Sq Mi
$85,611
Median Household Income
$47,831
Median Earnings
$1,122
Median Rent
$266,000
Median Home Value
Check the figures for this property
Cap Rate, Value Estimation, Potential NOI and more
View Realmo Analytics
Market
Vacancy Rate% for Office in Midwest region




Similar Off Market Nearby
- Borlik Gregory DVM — 510 S State Rd 135, Greenwood, IN 46142
- Academy Animal Hospital — 510 S State Rd 135, Greenwood, IN 46142
- Mc Naul Erica DVM — 510 S State Rd 135, Greenwood, IN 46142
- Sheff, Jon DVM — 648 Treybourne Dr, Greenwood, IN 46142
- Meridian Veterinary Clinic & Hospital — 648 Treybourne Dr, Greenwood, IN 46142
Frequently Asked Questions
What type of property is this?
Medical Office Space - NNN-leased medical office built in 2003, featuring Class A finishes and full occupancy under an established tenant base.
Where is this medical office space located?
The property is located at 385 Meridian Parke Lane Greenwood, IN.
What is the asking price?
The asking price for this property is $2,580,000.
What are key features of this property?
This property features: Two‑tenant, NNN‑leased medical office building built in 2003; Class A medical office with limestone accents and upgraded tenant interior finishes; 100% occupancy with a 7.67‑year WALT


