Occupied Mixed-Use
For Sale
$1,038,389
Pending
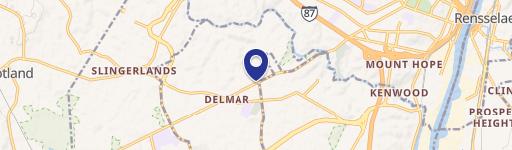
376-378 Delaware Avenue, Delmar, NY 12054
Commercial Sale, Delmar, NY
Property Size4,242 SF
Lot Size0.16 Acres
Days on Market51
Property Features for 376-378 Delaware Avenue
General Information
Property type
Commercial Sale
Property subtype
Other
Zoning
Mixed
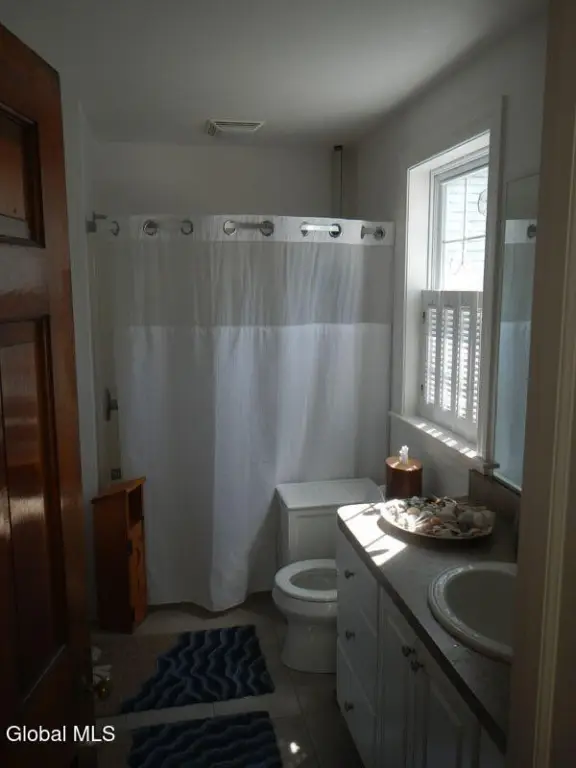
Bathrooms
3
Full bathrooms
3
Rooms
Bathroom 1, Bathroom 2, Bathroom 3
Parking
25
Parking features
On Street, Off Street
Patio and Porch features
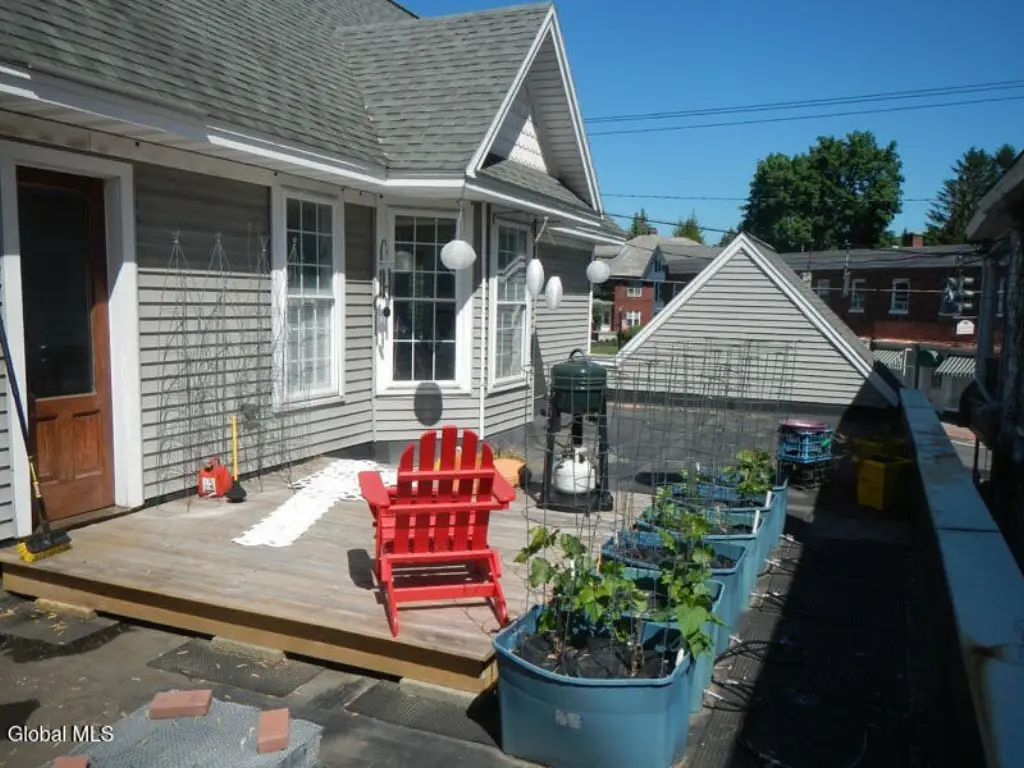
Patio
Interior features
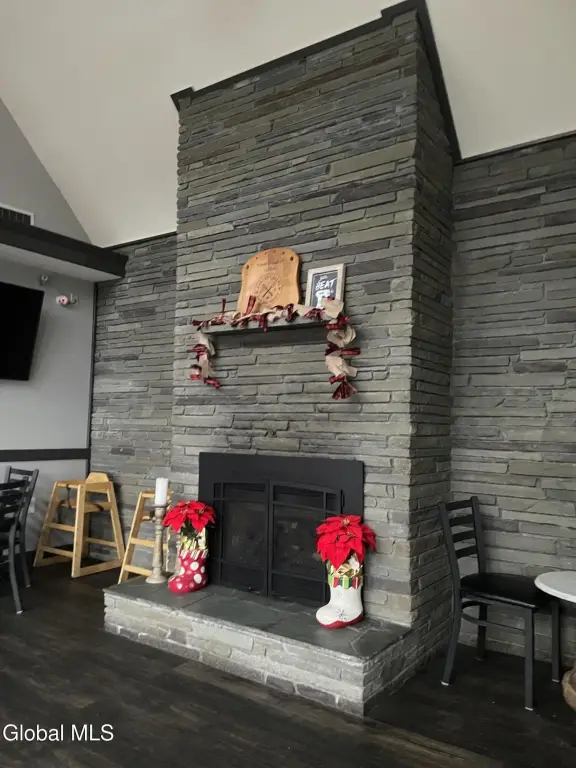
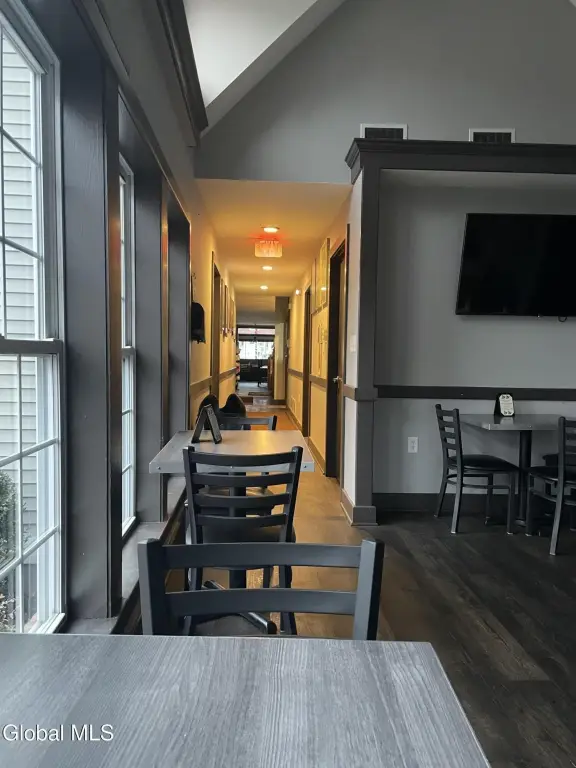
High Speed Internet, Paddle Fan, Cathedral Ceiling(s), Ceramic Tile Bath, Crown Molding
Basement
Full
Lot features
Private, Level, Cleared
Elementary school
Elsmere
High school
Bethlehem Central
Elementary school district
Bethlehem
Middle school district
Bethlehem
High school district
Bethlehem
Directions
Intersection of NY 443 and NY 140 Delmar NY
Standard status
Pending
APN
012200 85.16-4-3
Size
4,242 SF
Lot size
0.16 Acres
Taxes and HOA fees
Tax Annual Amount
9391
Utilities
Sewer type
Public Sewer
Heating system
Zoned, Forced Air, Natural Gas
Cooling system
Central Air
Water source
Public
Amenities
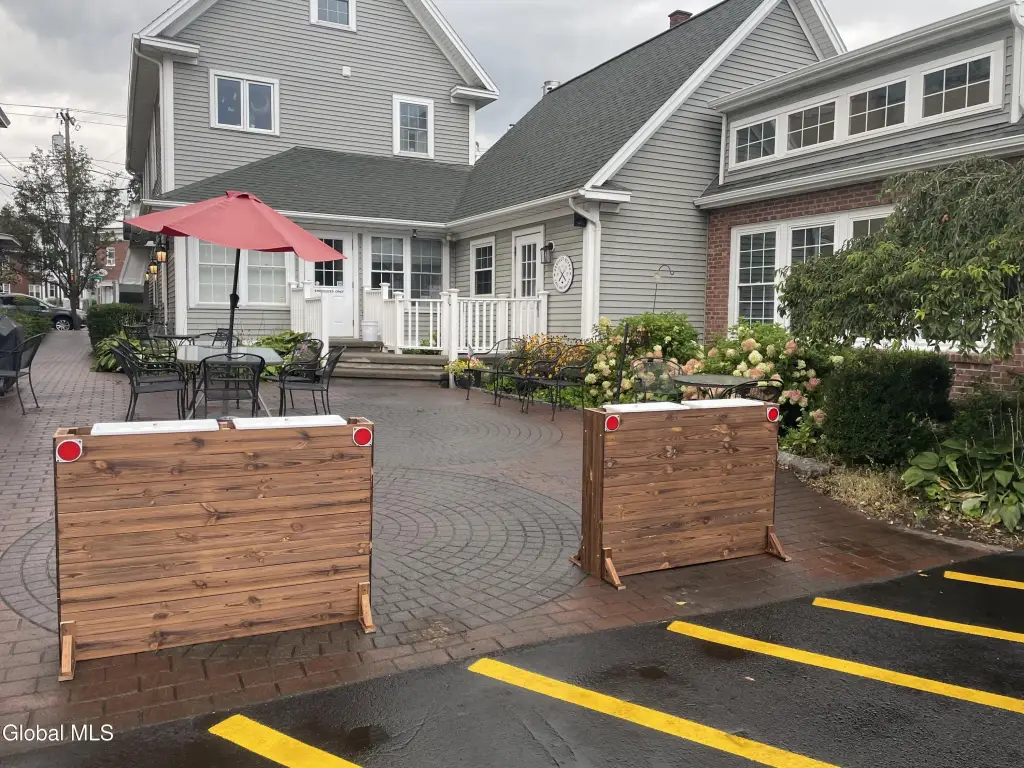
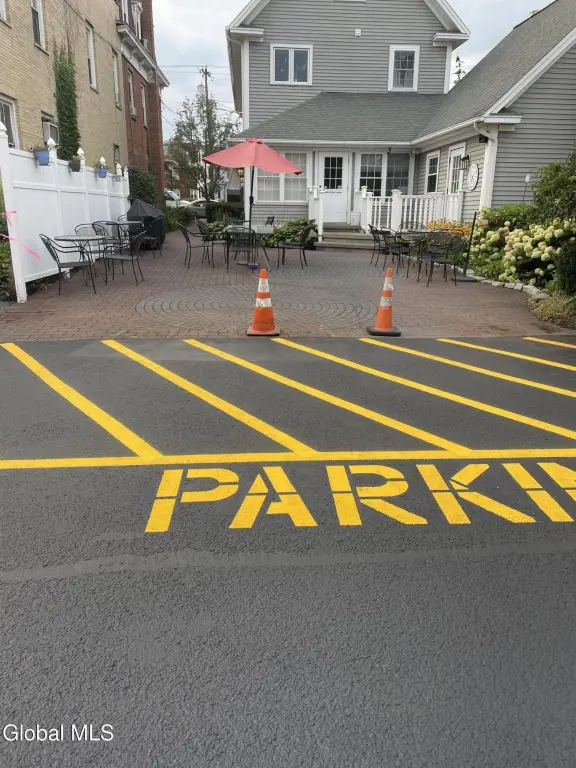
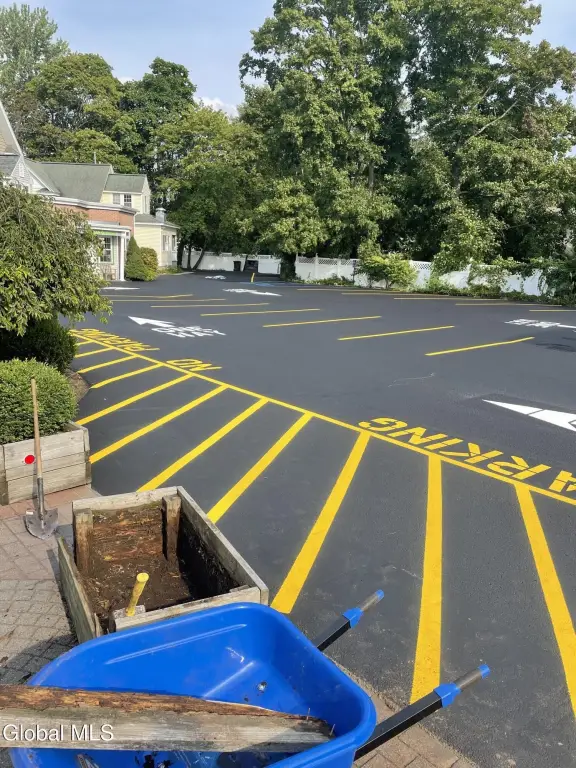
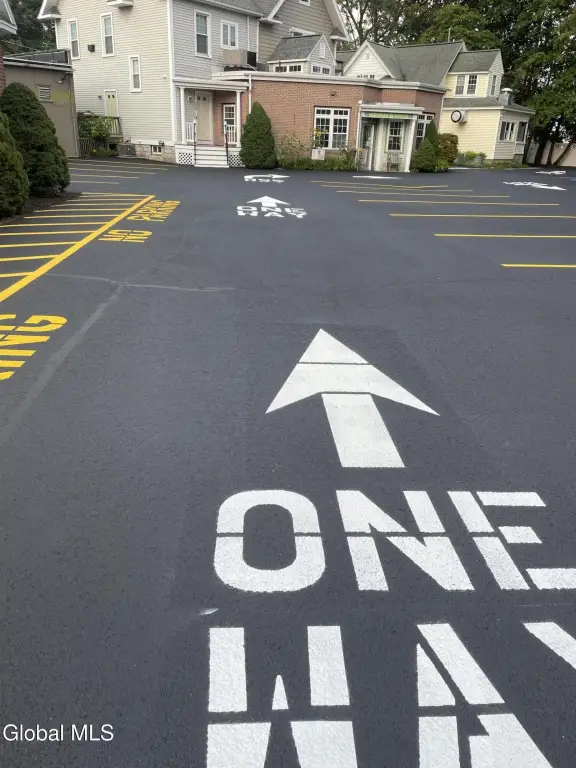
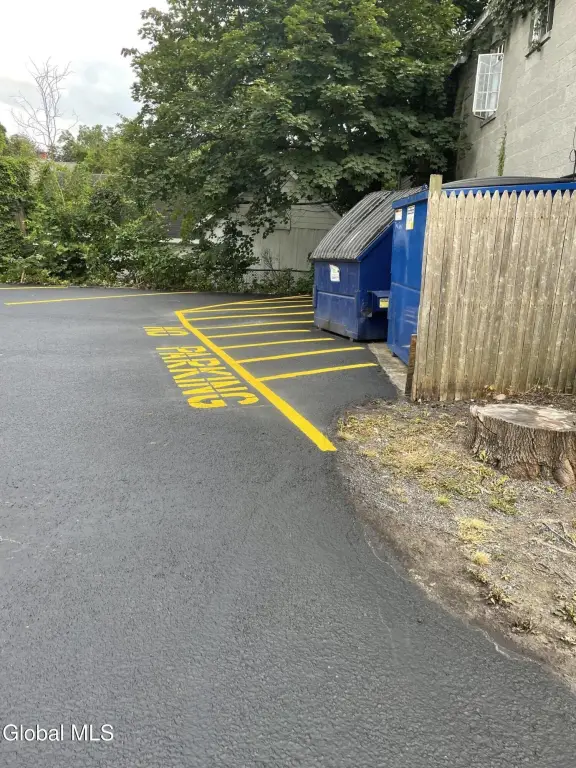
rear parking with formal shared-parking agreement
full basement used for retail storage
separate residential access
Building Details
Year built
1948
Floors in Building
2
Flooring type
Tile, Hardwood
Building materials
Block, Brick, Vinyl Siding
Architectural style
Other
Listing Agency:
Howard Hanna Capital Inc
(518) 489-1000
Listed By:
Charles Curto · License #10301206236
(518) 669-4356
Added: Aug 25
Changed: Oct 8
Last Checked: Oct 14 at 10:06AM
MLS# 202624754
Copyright © 2026 Global MLS, Inc. All rights reserved. All information provided by the listing agent/broker is deemed reliable but is not guaranteed and should be independently verified.
Investment Insights
Based on property information with market context.
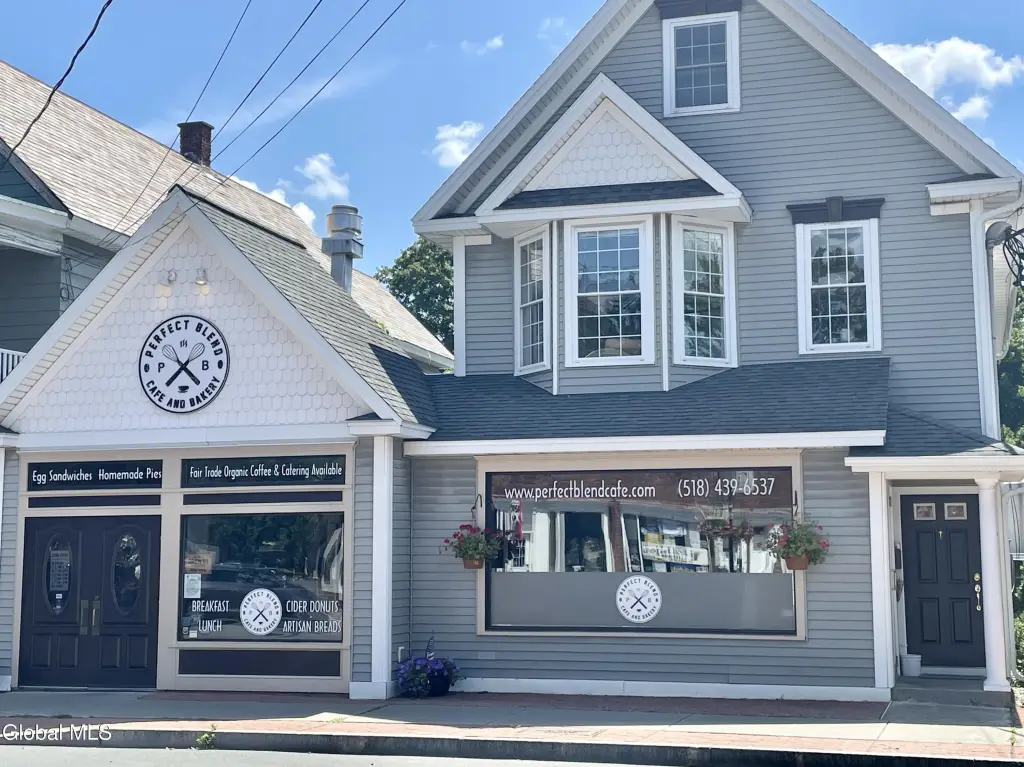
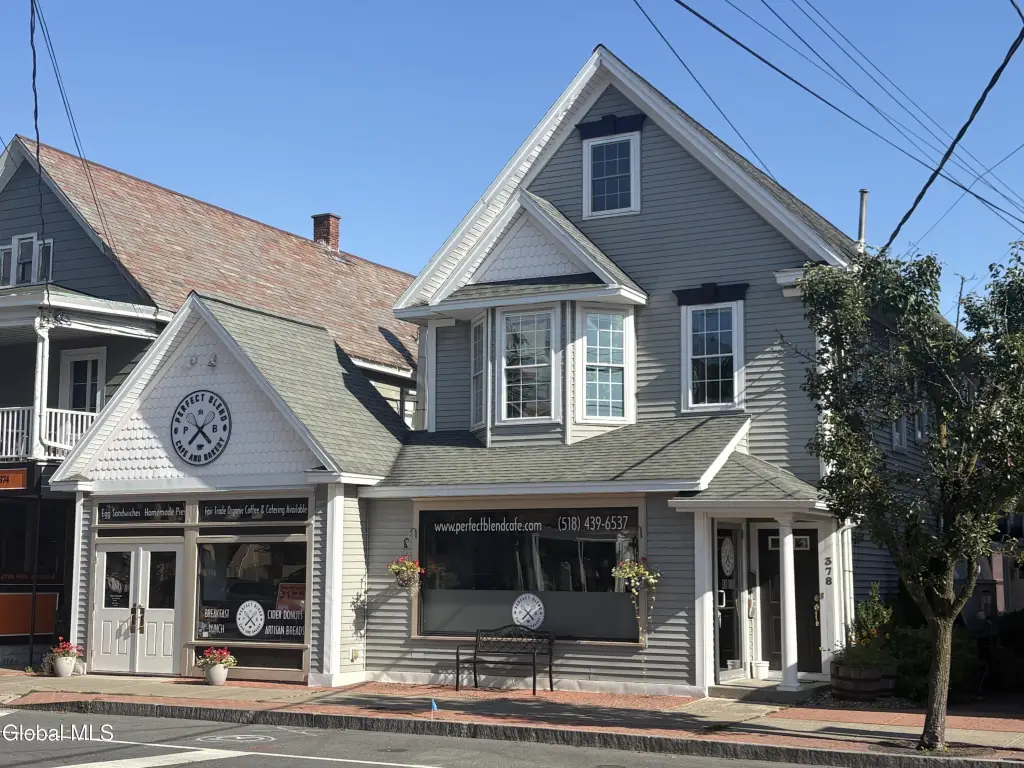
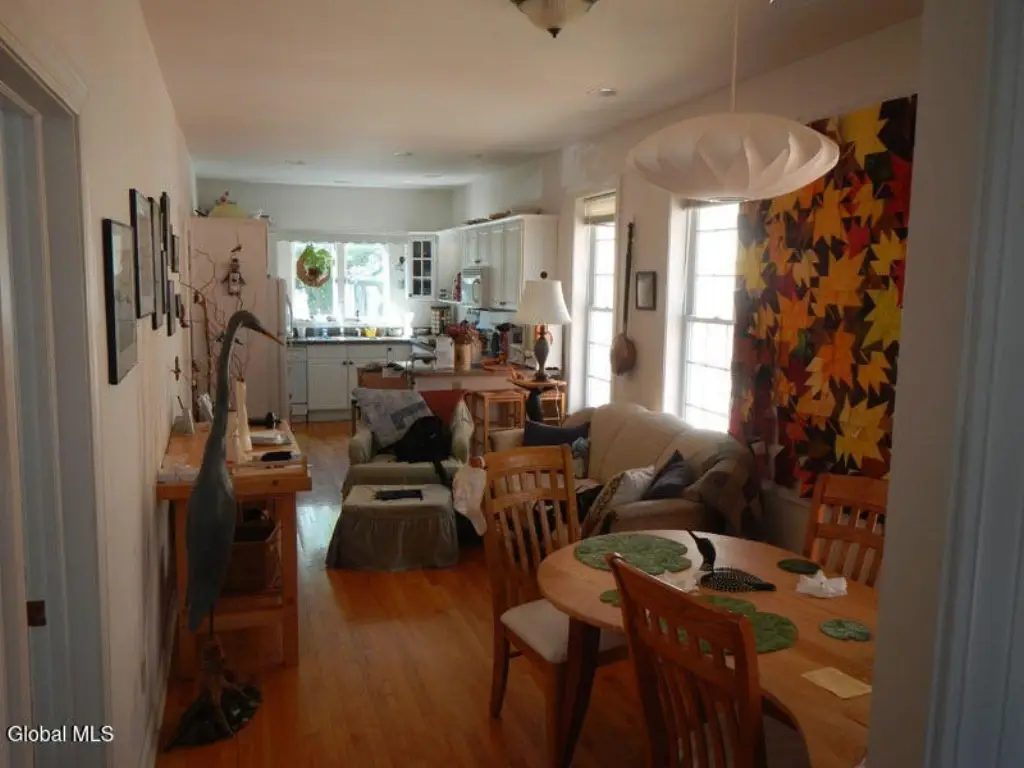
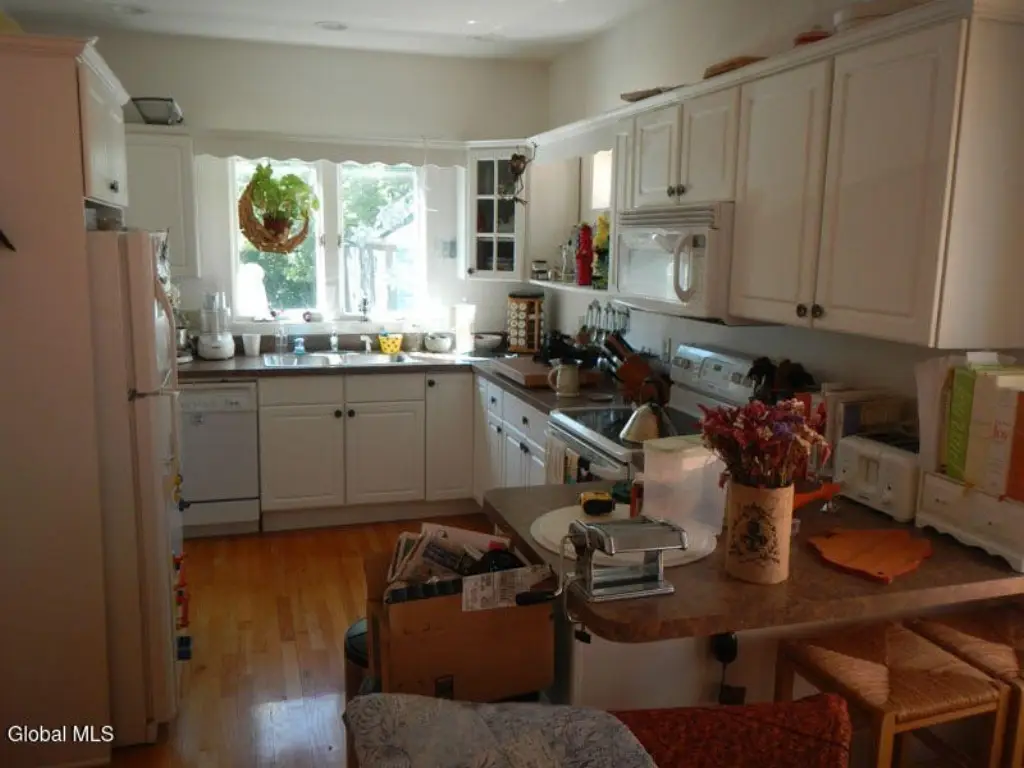
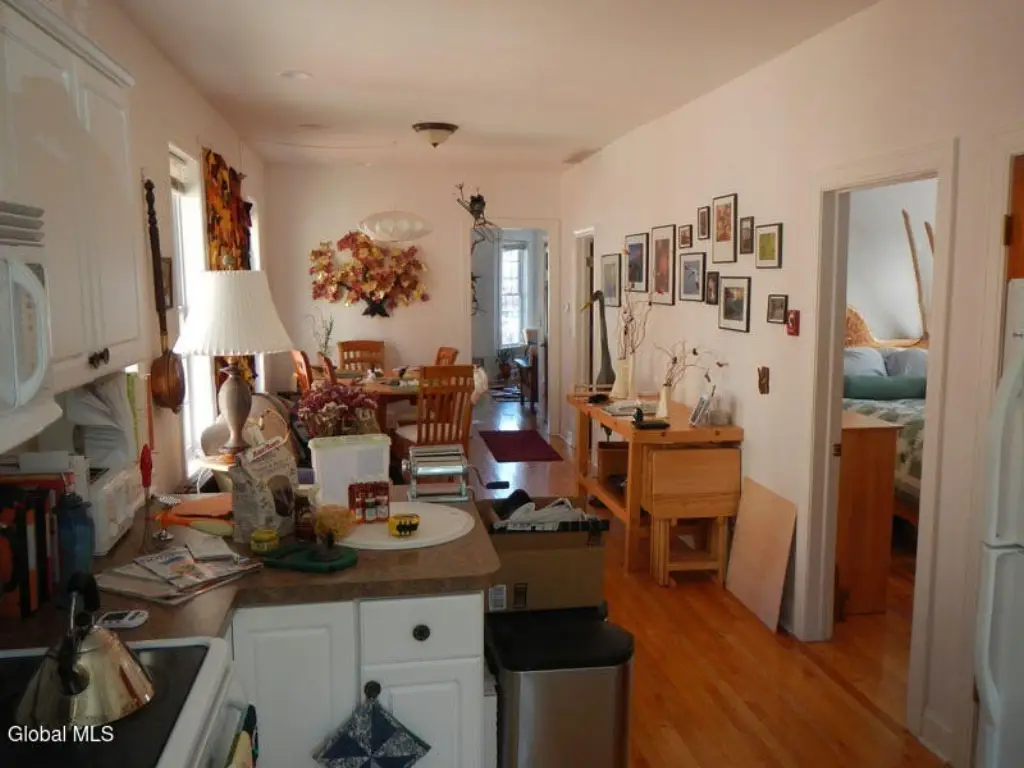
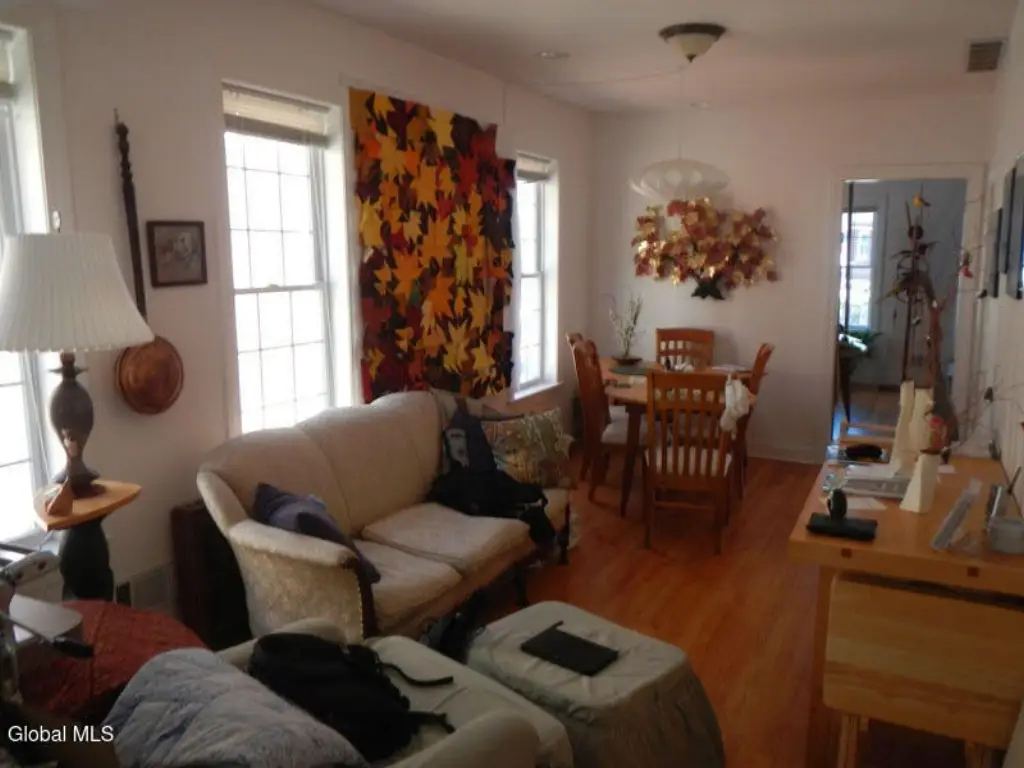
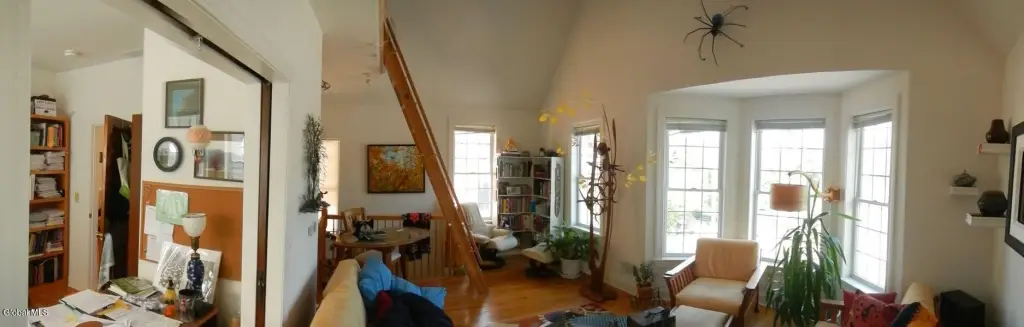
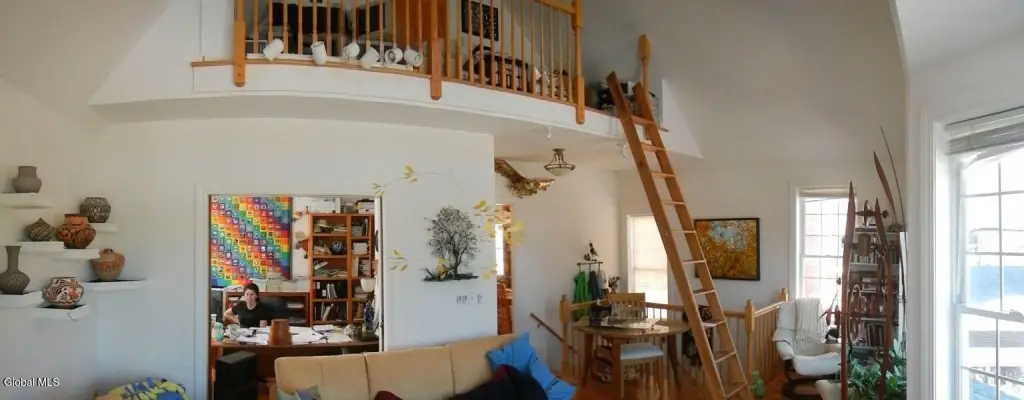
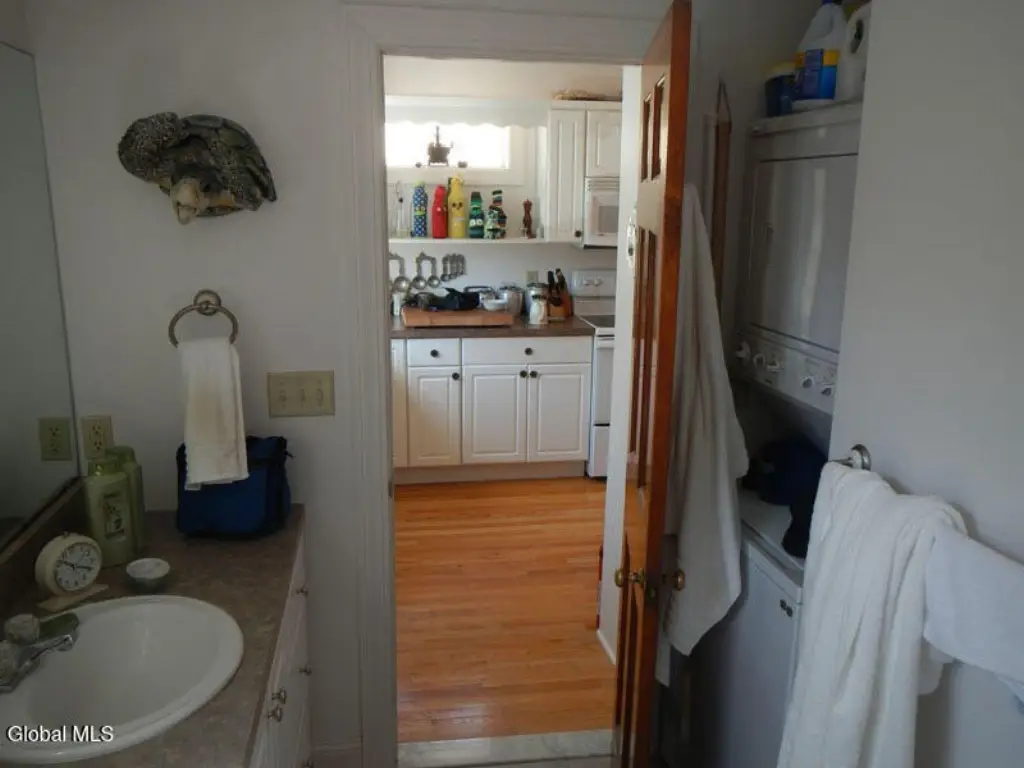
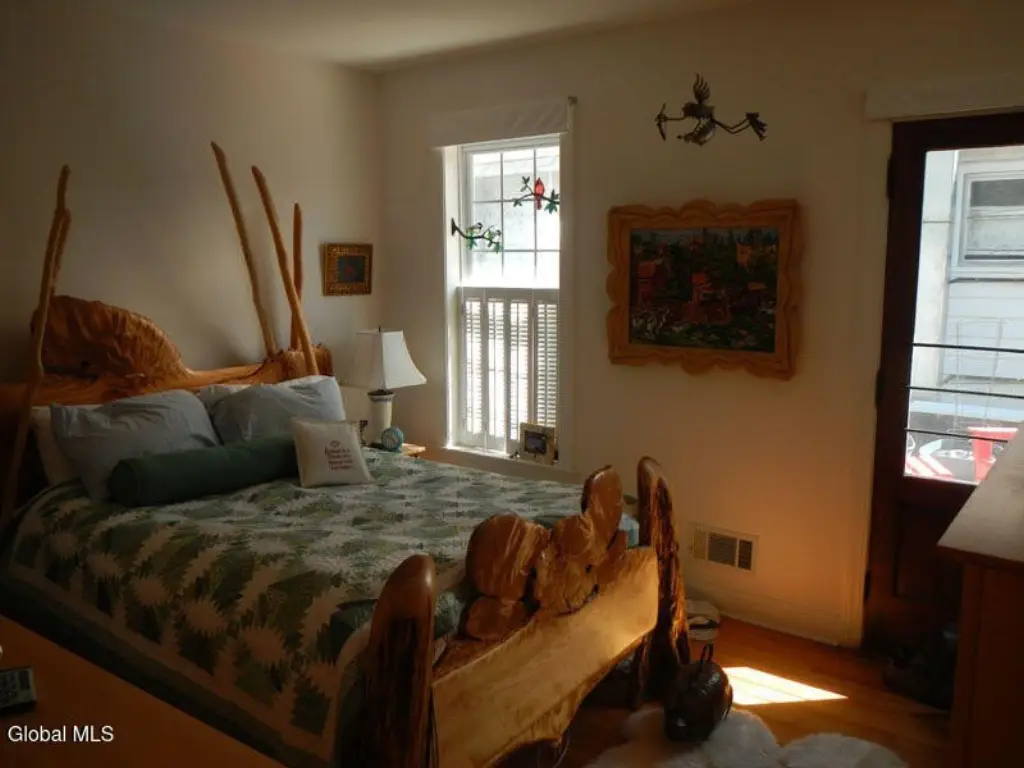
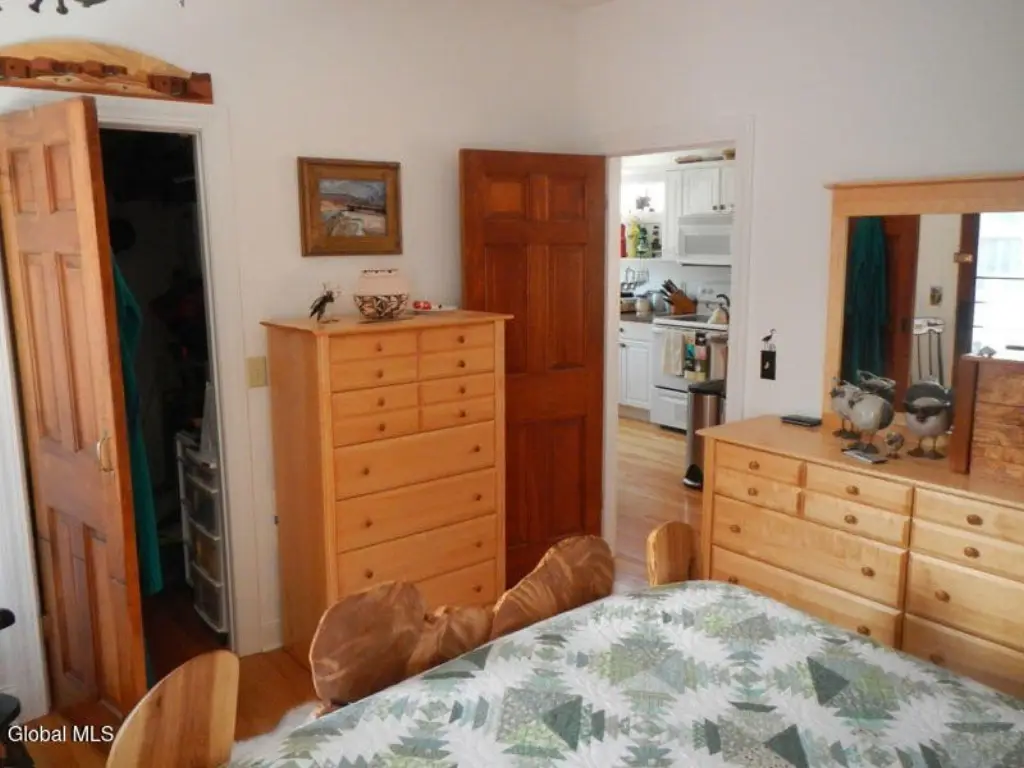
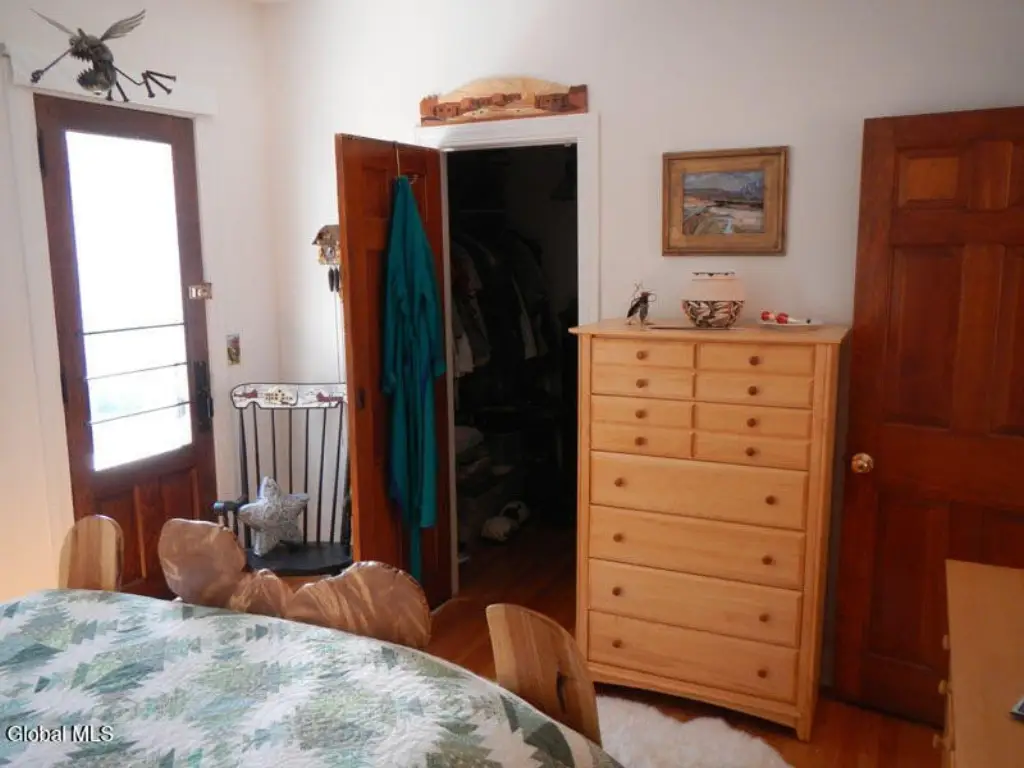
Located at 376-378 Delaware Avenue in Delmar, this two-story mixed-use property contains 4,242 square feet on a 0.16-acre parcel. The first floor provides approximately 3,000 square feet of retail space occupied by Perfect Blend, which has operated at the property since 2016. A 1,242-square-foot two-bedroom apartment occupies the second floor and has separate residential access.
The property is positioned along Delaware Avenue in Delmar’s Four Corners area, within a walkable Main Street-style setting surrounded by retail, commercial, and residential uses. Rear parking is supported by a formal shared-parking agreement, with additional off-street and on-street parking noted. A full basement provides retail storage. The property also includes a patio, public water and sewer, forced-air natural-gas heating with zoned control, and central air. Built in 1948, the building carries Hamlet zoning.
The property is positioned along Delaware Avenue in Delmar’s Four Corners area, within a walkable Main Street-style setting surrounded by retail, commercial, and residential uses. Rear parking is supported by a formal shared-parking agreement, with additional off-street and on-street parking noted. A full basement provides retail storage. The property also includes a patio, public water and sewer, forced-air natural-gas heating with zoned control, and central air. Built in 1948, the building carries Hamlet zoning.
Key Highlights
- 4,242 SF two‑story mixed‑use building on 0.16 acres
- Approximately 3,000 SF of first‑floor retail space
- 1,242 SF second‑floor two‑bedroom apartment
Financial Insights
Estimated NOI and Cap Rate
NOI / Yr
$54,862
Cap Rate
5.28%
Suggested Prices Based on Cap Rates
Cap Rate 5%
$1,097,240
$1.1M
Cap Rate 7%
$783,743
$783.7K
Cap Rate 9%
$609,578
$609.6K
Market Conditions
NOI Build-Up for 4,242 SF
Gross rent
$76.4K $18.00/SF
− Vacancy
−$3.2K −$0.76/SF
EGI
$73.1K $17.24/SF
− OpEx
−$18.3K −$4.31/SF
NOI
$54.9K $12.93/SF
Area
Albany County, NY
Vacancy
4.20%
Lease Rate
$18.00 /SF/Yr
Expense Ratio
25.00%
Simulate Cap Rate and NOI
Suggested Prices Based on Cap Rates
Cap Rate 5%
$1,097,240
Cap Rate 7%
$783,743
Cap Rate 9%
$609,578
Alternative Uses
Best Use
Specialty Retail
$783.7K
$685.8K – $914.4K
NOI $54,862 @ 7.0% cap · market cap 5.28%
Second Best
Retail
$731.5K
$640.1K – $853.4K
NOI $51,204 @ 7.0% cap · market cap 4.93%
Theoretical Best
Office A
$1.32M
$1.16M – $1.54M
NOI $92,658 @ 7.0% cap · market cap 8.92%
Zoning and permitted uses should be independently verified with authorities.
How Realmo checks its estimates
Property Analytics
Unlock full access to Insights
Subscribe to Realmo Intelligence
Open Analytics
Current Use
Lease Details
1
Residential units
100%
Occupancy
Multi-tenant
Tenancy
Yes
Paved road access
Location Intelligence
Trade Area within ½ mile
513
Businesses Nearby
9k
Monthly Visits Nearby
Explore this area
Business Placement
Foot Traffic Nearby
Shops & Services 100%
Sunoco
Shops & Services
4,523 visits/mo
0.4 miles
KeyBank
Shops & Services
4,121 visits/mo
0.1 miles
Demographics for 12054, NY
17,282
Population
7,221
Households
2.4
Avg Household Size
46
Median Age
68%
College-Educated
98%
High-School Grad
15.5 sq mi
ZIP Area
1,115
Density / Sq Mi
$128,684
Median Household Income
$69,853
Median Earnings
$1,658
Median Rent
$334,800
Median Home Value
Check the figures for this property
Cap Rate, Value Estimation, Potential NOI and more
View Realmo Analytics
Market
Vacancy Rate% for Retail in Northeast region

Questions? Ask Rey
Realmo’s AI knows this listing — price, zoning, demand, history. Ask anything.


Frequently Asked Questions
What type of property is this?
Mixed-use property - Two-story building combines street-level retail with a separate residential apartment and shared rear parking.
Where is this mixed-use property located?
The property is located at 376-378 Delaware Avenue Delmar, NY.
What is the asking price?
The asking price for this property is $1,038,389.
What are key features of this property?
This property features: 4,242 SF two‑story mixed‑use building on 0.16 acres; Approximately 3,000 SF of first‑floor retail space; 1,242 SF second‑floor two‑bedroom apartment


