Mixed-Use Property with
For Sale
$495,000
373-375 Main St, Oneonta, NY 13820
Main Street building with first-floor central air, upstairs apartment space, and recently improved electrical and exterior finishes.
Property Size3,264 SF
Price / SF$151.65
Days on Market88
Property Features for 373-375 Main St
General Information
Standard status
Active
Size
3,264 SF
Building Details
Year Built
1915
Listing Agency:
Keller Williams Upstate NY Properties
Listed By:
Tim Mullinnex · License #10401341885
(607) 435-0567
Source:
Skinnercnyrealty
Added: Jul 21
Changed: Oct 4
Last Checked: Oct 7 at 5:36PM
Displayed information is deemed reliable but is not guaranteed and should be independently verified. All listing content including descriptions, pricing, images are the copyrighted material of Keller Williams Upstate NY Properties

Ask AI about this property
Review the available facts, identify missing information and prepare questions for the agent.
Investment Insights
Based on property information with market context.
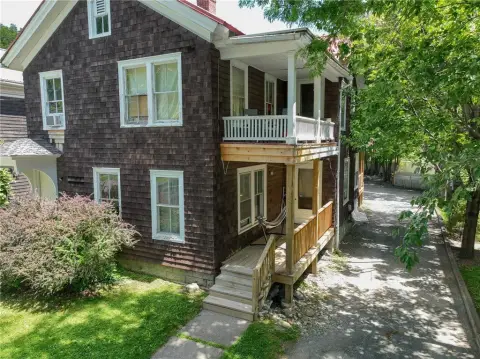
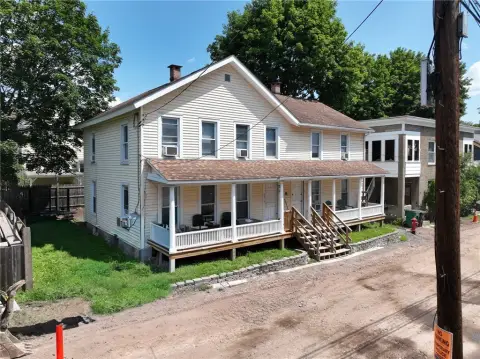
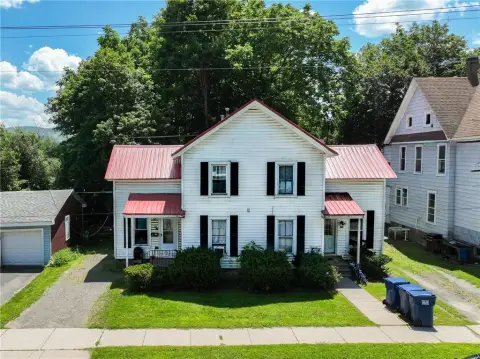
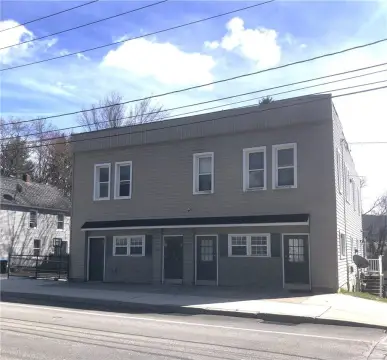
Built in 1915, this 3,264-square-foot mixed-use property combines commercial space on the first floor with an upstairs apartment configuration. The first floor has central air conditioning, while the building is served by four separate forced hot air furnaces. Other improvements include upgraded first-floor electrical service, four 100-amp electric panels, a replacement side roof, a new garage door, refreshed interior finishes, and new carpeting with original oak flooring beneath. Unit #3 received new kitchen and bathroom flooring in Spring 2026.
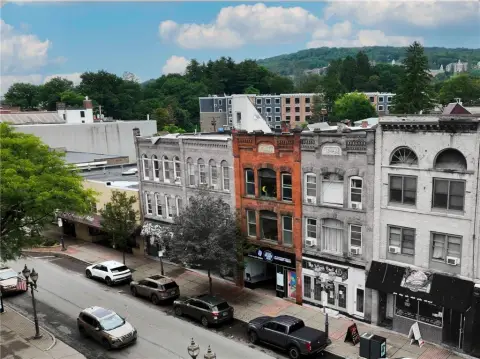
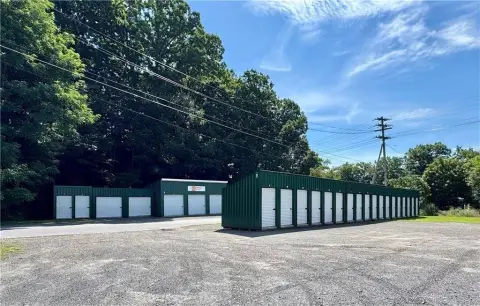
The property occupies a Main Street address in downtown Oneonta, with direct street exposure and a 12-space parking lot. The exterior was scraped, primed, and painted with two coats in September 2025, and a 5-foot white vinyl fence was installed in July 2023. The parking lot was professionally sealed and striped in October 2024.
The property occupies a Main Street address in downtown Oneonta, with direct street exposure and a 12-space parking lot. The exterior was scraped, primed, and painted with two coats in September 2025, and a 5-foot white vinyl fence was installed in July 2023. The parking lot was professionally sealed and striped in October 2024.
Key Highlights
- 3,264 SF mixed‑use property built in 1915
- Main Street location in downtown Oneonta
- Four separate forced hot air furnaces; central AC serves first‑floor spaces
Financial Insights
Estimated NOI and Cap Rate
NOI / Yr
$28,005
Cap Rate
5.66%
Suggested Prices Based on Cap Rates
Cap Rate 5%
$560,100
$560.1K
Cap Rate 7%
$400,071
$400.1K
Cap Rate 9%
$311,167
$311.2K
Market Conditions
NOI Build-Up for 3,264 SF
Gross rent
$50.9K $15.60/SF
− Vacancy
−$6.1K −$1.87/SF
EGI
$44.8K $13.73/SF
− OpEx
−$16.8K −$5.15/SF
NOI
$28.0K $8.58/SF
Area
Otsego County, NY
Vacancy
12.00%
Lease Rate
$15.60 /SF/Yr
Expense Ratio
37.50%
Simulate Cap Rate and NOI
Suggested Prices Based on Cap Rates
Cap Rate 5%
$560,100
Cap Rate 7%
$400,071
Cap Rate 9%
$311,167
Alternative Uses
Best Use
Mixed Use
$400.1K
$350.1K – $466.8K
NOI $28,005 @ 7.0% cap · market cap 5.66%
Second Best
Apartment 5plus
$380.1K
$332.6K – $443.4K
NOI $26,605 @ 7.0% cap · market cap 5.37%
Theoretical Best
Office A
$899.7K
$787.3K – $1.05M
NOI $62,982 @ 7.0% cap · market cap 12.72%
Zoning and permitted uses should be independently verified with authorities.
How Realmo checks its estimates
Property Analytics
Unlock full access to Insights
Subscribe to Realmo Intelligence
Open Analytics
Current Use
Location Intelligence
Trade Area within ½ mile
1,051
Businesses Nearby
Explore this area
Business Placement
Demographics for 13820, NY
21,605
Population
10,083
Households
2.1
Avg Household Size
30
Median Age
40%
College-Educated
91%
High-School Grad
107.3 sq mi
ZIP Area
201
Density / Sq Mi
$66,217
Median Household Income
$26,154
Median Earnings
$983
Median Rent
$176,300
Median Home Value
Check the figures for this property
Cap Rate, Value Estimation, Potential NOI and more
View Realmo Analytics





Frequently Asked Questions
What type of property is this?
Mixed-use property - Main Street building with first-floor central air, upstairs apartment space, and recently improved electrical and exterior finishes.
Where is this mixed-use property located?
The property is located at 373-375 Main St Oneonta, NY.
What is the asking price?
The asking price for this property is $495,000.
What are key features of this property?
This property features: 3,264 SF mixed‑use property built in 1915; Main Street location in downtown Oneonta; Four separate forced hot air furnaces; central AC serves first‑floor spaces


