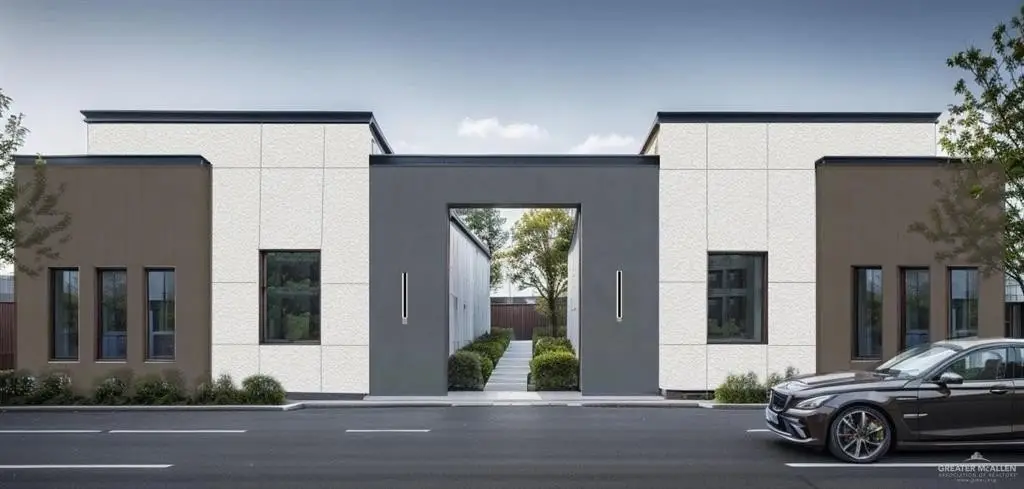
Modern-Finish Quadplex Under
For Sale
$475,000
Pending
3710 E Hillview Avenue, Edinburg, TX 78542
Residential Income, Edinburg, TX
Property Size3,670 SF
Lot Size0.24 Acres
Days on Market125

Ask AI about this property
Review the available facts, identify missing information and prepare questions for the agent.
Property Features for 3710 E Hillview Avenue
General Information
Property type
Residential Multi Family
Property subtype
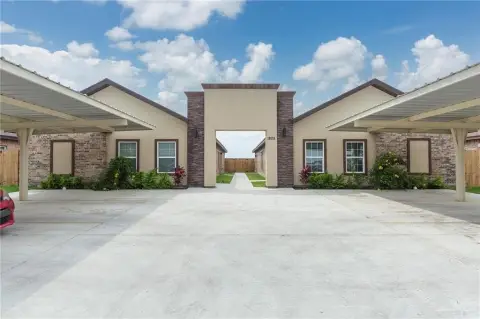
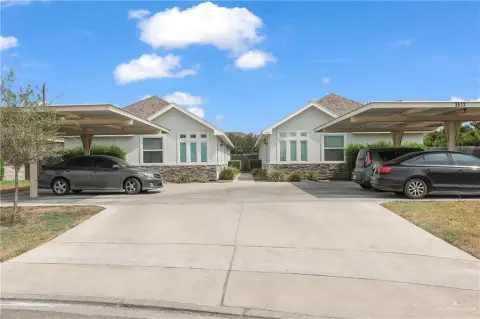
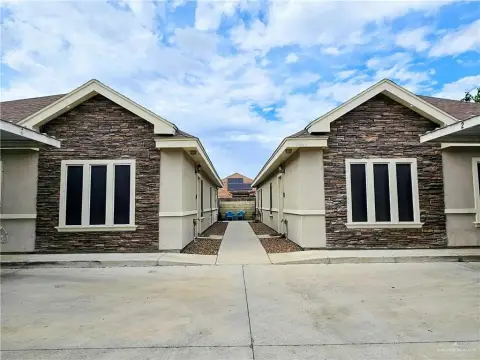
Quadruplex
Property condition
Under Construction
Parking
6
Parking features
Other
Patio and Porch features
Patio
Exterior features
Sprinkler System
Fencing
Privacy
Appliances
Electric Water Heater, Dryer, Microwave, Refrigerator, Stove/Range, Washer
Subdivision
Canton Hills Subdivision
Lot features
Curb & Gutters, Sidewalks, Sprinkler System
Elementary school
Travis
Middle school
Barrientes
High school
Edinburg H.S.
Elementary school district
Edinburg ISD
Middle school district
Edinburg ISD
High school district
Edinburg ISD
Directions
Driving East on Canton, past Raul Longoria, left on S Hilltop Ave. Left on E Hillview Ave. Property will be on the left.
Standard status
Pending
APN
V384300000000400
Size
3,670 SF
Lot size
0.24 Acres
Taxes and HOA fees
Tax Year
2025
Tax Annual Amount
1300
HOA Fee
$600 Annually
Utilities
Heating system
Central, Electric (Heating)
Cooling system
Electric, Central Air
Water source
Public
Amenities
private patios
Building Details
Year built
2026
Floors in Building
1
Number of units
4
Building materials
Stucco
Roof type
Composition
Listing Agency:
Key Realty
(956) 627-7552
Listed By:
Preshina Samtani · License #617748
(956) 460-7763
Added: Jun 13
Changed: Oct 8
Last Checked: Oct 15 at 4:06PM
MLS# 500919
Copyright © 2026 Greater McAllen Association of Realtors. All rights reserved. All information provided by the listing agent/broker is deemed reliable but is not guaranteed and should be independently verified.
Investment Insights
Based on property information with market context.
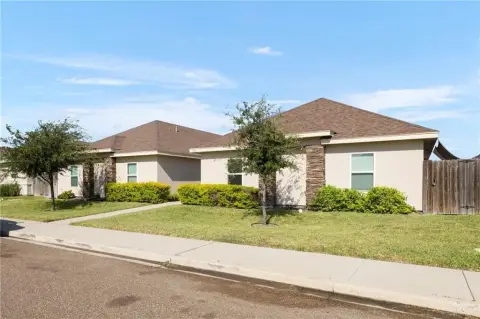
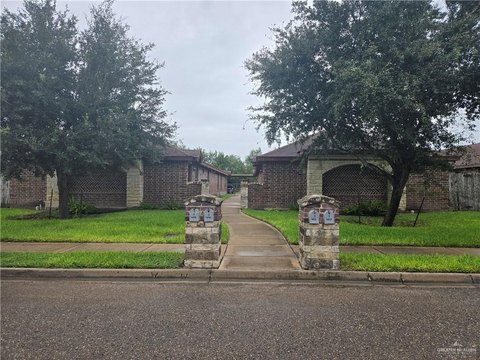
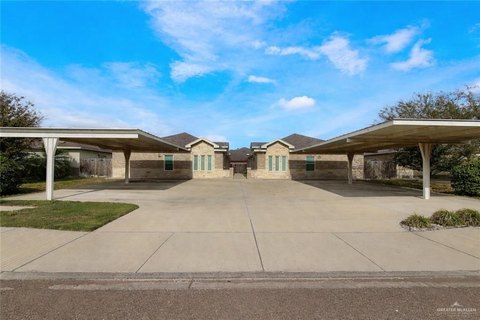
This 3,670-square-foot quadplex is under construction and scheduled for completion in 2026. The layout includes two 3-bedroom, 2-bath residences and two 1-bedroom, 1-bath residences. Planned interior details include tile flooring, upgraded lighting, central electric heating and cooling, and a private patio for each unit. The property also includes a privacy fence, stucco construction, a composition roof, public water, and a sprinkler system.
Located at 3710 E Hillview Avenue in Edinburg, the property is near Expressway 281, Walmart Supercenter, and UTRGV Stadium, with Los Lagos Golf Course across the street. Each residence is equipped with a refrigerator, stove/range, microwave, washer, dryer, and electric water heater.
Located at 3710 E Hillview Avenue in Edinburg, the property is near Expressway 281, Walmart Supercenter, and UTRGV Stadium, with Los Lagos Golf Course across the street. Each residence is equipped with a refrigerator, stove/range, microwave, washer, dryer, and electric water heater.
Key Highlights
- 3,670 square feet of living space on a 0.2403‑acre lot
- Four‑unit mix with two 3‑bedroom, 2‑bath units and two 1‑bedroom, 1‑bath units
- Under construction with a 2026 year built
Financial Insights
Estimated NOI and Cap Rate
NOI / Yr
$34,477
Cap Rate
7.26%
Suggested Prices Based on Cap Rates
Cap Rate 5%
$689,540
$689.5K
Cap Rate 7%
$492,529
$492.5K
Cap Rate 9%
$383,078
$383.1K
Market Conditions
NOI Build-Up for 3,670 SF
Gross rent
$50.6K $13.80/SF
− Vacancy
−$1.4K −$0.38/SF
EGI
$49.3K $13.42/SF
− OpEx
−$14.8K −$4.03/SF
NOI
$34.5K $9.39/SF
Area
Edinburg, TX
Vacancy
2.75%
Lease Rate
$13.80 /SF/Yr
Expense Ratio
30.00%
Simulate Cap Rate and NOI
Suggested Prices Based on Cap Rates
Cap Rate 5%
$689,540
Cap Rate 7%
$492,529
Cap Rate 9%
$383,078
Alternative Uses
Best Use
Multifamily LT 5
$492.5K
$431.0K – $574.6K
NOI $34,477 @ 7.0% cap · market cap 7.26%
Second Best
Apartment 5plus
$440.2K
$385.1K – $513.5K
NOI $30,811 @ 7.0% cap · market cap 6.49%
Theoretical Best
Office A
$952.3K
$833.2K – $1.11M
NOI $66,659 @ 7.0% cap · market cap 14.03%
Zoning and permitted uses should be independently verified with authorities.
How Realmo checks its estimates
Property Analytics
Unlock full access to Insights
Subscribe to Realmo Intelligence
Open Analytics
Current Use
Lease Details
4
Residential units
Yes
Highway access
Location Intelligence
Trade Area within ½ mile
40
Businesses Nearby
Explore this area
Business Placement
Demographics for 78542, TX
84,678
Population
25,198
Households
3.4
Avg Household Size
28
Median Age
13%
College-Educated
64%
High-School Grad
176.0 sq mi
ZIP Area
481
Density / Sq Mi
$52,962
Median Household Income
$30,377
Median Earnings
$876
Median Rent
$123,500
Median Home Value
Check the figures for this property
Cap Rate, Value Estimation, Potential NOI and more
View Realmo Analytics
Market
Vacancy Rate% for Multifamily in South region





Frequently Asked Questions
What type of property is this?
Quadplex - Four units offer varied layouts, private patios, and central HVAC in a newly built residential income property.
Where is this quadplex located?
The property is located at 3710 E Hillview Avenue Edinburg, TX.
What is the asking price?
The asking price for this property is $475,000.
What are key features of this property?
This property features: 3,670 square feet of living space on a 0.2403‑acre lot; Four‑unit mix with two 3‑bedroom, 2‑bath units and two 1‑bedroom, 1‑bath units; Under construction with a 2026 year built


