Single-Story
For Sale
$495,000
363 Armstrong Ln, Lavon, TX 75166
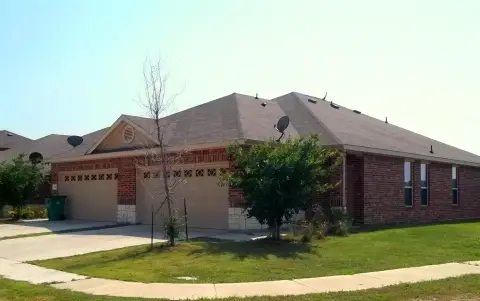
Two attached residential units offer spacious layouts, private fenced yards, and community amenity access.
Property Size1,202 SF
Price / SF$411.81
Days on Market53
Property Features for 363 Armstrong Ln
General Information
Standard status
Active
Size
1,202 SF
Total Parking Spaces
4
Property subtype
Multi-Family
Occupancy
100%
Site & Location
Highway Access
Yes
Road Access
Yes
Units
Unit Mix
2 x 3BR/2BA
Multifamily Units
2
Amenities
private fenced backyards
full sprinkler systems
dedicated utility rooms
walk-in closets
resort-style pool
splash pad
24-hour fitness center
clubhouse
business center
parks
jogging trails
fishing ponds
Building Details
Year Built
2010
Buildings
1
Stories
1
Listing Agency:
The Vibe Brokerage, LLC
Listed By:
Christopher Wright · License #0702779
(888) 519-7431
Source:
Aboveandbeyondrealty
Added: Aug 22
Changed: Oct 1
Last Checked: Oct 12 at 9:30PM
Displayed information is deemed reliable but is not guaranteed and should be independently verified. All listing content including descriptions, pricing, images are the copyrighted material of The Vibe Brokerage, LLC
Investment Insights
Based on property information with market context.
This single-story duplex was built in 2010 and includes two separately configured residential units. Each side provides 3 bedrooms, 2 full bathrooms, an open living area, walk-in closets, upgraded fixtures, and a dedicated utility room. Private fenced backyards include full sprinkler systems, while two attached 2-car garages provide 4 total parking spaces. The property occupies a corner lot in Grand Heritage West.
Both units are tenant-occupied, with 100% occupancy reported. Residents have access to the Grand Heritage Club, including a resort-style pool, splash pad, 24-hour fitness center, clubhouse, and business center. Additional community features include parks, jogging trails, and fishing ponds. The property also offers access to Highways 78 and 205, with connections to Wylie, Rockwall, and Plano, and is located near Lake Lavon recreational opportunities.
Both units are tenant-occupied, with 100% occupancy reported. Residents have access to the Grand Heritage Club, including a resort-style pool, splash pad, 24-hour fitness center, clubhouse, and business center. Additional community features include parks, jogging trails, and fishing ponds. The property also offers access to Highways 78 and 205, with connections to Wylie, Rockwall, and Plano, and is located near Lake Lavon recreational opportunities.
Key Highlights
- Two‑unit duplex built in 2010 on a corner lot
- Each unit includes 3 bedrooms, 2 full bathrooms, and an open living area
- Two attached 2‑car garages provide 4 total parking spaces
Financial Insights
Estimated NOI and Cap Rate
NOI / Yr
$21,135
Cap Rate
4.27%
Suggested Prices Based on Cap Rates
Cap Rate 5%
$422,700
$422.7K
Cap Rate 7%
$301,929
$301.9K
Cap Rate 9%
$234,833
$234.8K
Market Conditions
NOI Build-Up for 1,202 SF
Gross rent
$33.6K $27.96/SF
− Vacancy
−$3.4K −$2.84/SF
EGI
$30.2K $25.12/SF
− OpEx
−$9.1K −$7.54/SF
NOI
$21.1K $17.58/SF
Area
Collin County, TX
Vacancy
10.16%
Lease Rate
$27.96 /SF/Yr
Expense Ratio
30.00%
Simulate Cap Rate and NOI
Suggested Prices Based on Cap Rates
Cap Rate 5%
$422,700
Cap Rate 7%
$301,929
Cap Rate 9%
$234,833
Alternative Uses
Best Use
Multifamily LT 5
$301.9K
$264.2K – $352.3K
NOI $21,135 @ 7.0% cap · market cap 4.27%
Second Best
Apartment 5plus
$261.1K
$228.5K – $304.6K
NOI $18,278 @ 7.0% cap · market cap 3.69%
Theoretical Best
Industrial
$1.19M
$1.05M – $1.39M
NOI $83,607 @ 7.0% cap · market cap 16.89%
Zoning and permitted uses should be independently verified with authorities.
How Realmo checks its estimates
Property Analytics
Unlock full access to Insights
Subscribe to Realmo Intelligence
Open Analytics
Current Use
Lease Details
2
Residential units
100%
Occupancy
Yes
Highway access
Yes
Paved road access
Location Intelligence
Trade Area within ½ mile
76
Businesses Nearby
Explore this area
Business Placement
Demographics for 75166, TX
5,457
Population
2,186
Households
2.5
Avg Household Size
35
Median Age
36%
College-Educated
96%
High-School Grad
12.9 sq mi
ZIP Area
423
Density / Sq Mi
$129,130
Median Household Income
$60,916
Median Earnings
$1,780
Median Rent
$385,000
Median Home Value
Check the figures for this property
Cap Rate, Value Estimation, Potential NOI and more
View Realmo Analytics
Market
Vacancy Rate% for Multifamily in South region

Questions? Ask Rey
Realmo’s AI knows this listing — price, zoning, demand, history. Ask anything.





Frequently Asked Questions
What type of property is this?
Duplex - Two attached residential units offer spacious layouts, private fenced yards, and community amenity access.
Where is this duplex located?
The property is located at 363 Armstrong Ln Lavon, TX.
What is the asking price?
The asking price for this property is $495,000.
What are key features of this property?
This property features: Two‑unit duplex built in 2010 on a corner lot; Each unit includes 3 bedrooms, 2 full bathrooms, and an open living area; Two attached 2‑car garages provide 4 total parking spaces


