Historic Triplex with Rooftop
For Sale
$699,999
3619 21 Burgundy St, New Orleans, LA 70117
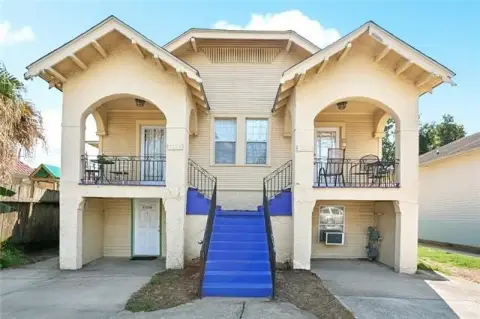
Three-unit property with gated access, private outdoor areas, and a two-bay garage.
Property Size3,788 SF
Price / SF$184.79
Days on Market66
Property Features for 3619 21 Burgundy St
General Information
Standard status
Active
Size
3,788 SF
Total Parking Spaces
2
Property subtype
Multi-Family
Units
Unit Mix
1 x 3BR/1.5BA, 1 x 1BR/1BA, 1 x 2BR/1BA
Multifamily Units
3
Amenities
deck
private outdoor spaces
Building Details
Year Built
1920
Buildings
1
Listing Agency:
Crescent City Living, LLC
Listed By:
Sarah Katko · License #995709880
(504) 258-8785
Source:
Dominionplace
Added: Aug 12
Changed: Oct 11
Last Checked: Oct 7 at 2:07PM
Displayed information is deemed reliable but is not guaranteed and should be independently verified. All listing content including descriptions, pricing, images are the copyrighted material of Crescent City Living, LLC

Ask AI about this property
Review the available facts, identify missing information and prepare questions for the agent.
Investment Insights
Based on property information with market context.
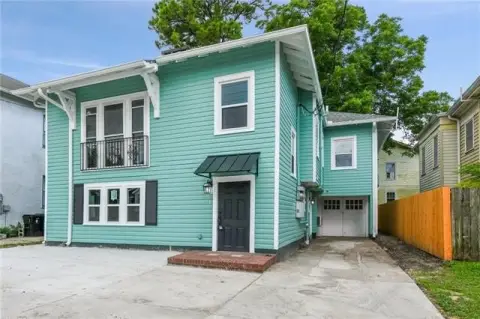
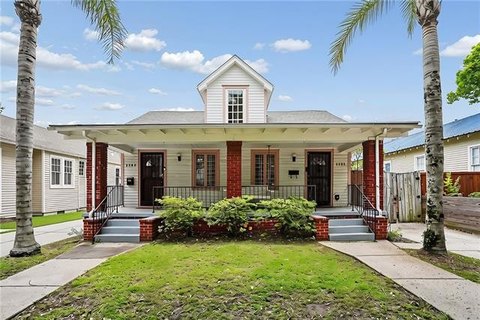
Built in 1920, this 3,788-square-foot triplex includes one upper-level residence and two units below. The upstairs layout offers three bedrooms, 1.5 bathrooms, central heat and air, heart-pine flooring, detailed molding, fireplace mantels, and direct access to a nearly 1,000-square-foot deck above the garage. The lower-level residences include one 1-bedroom, 1-bathroom unit and one 2-bedroom, 1-bathroom unit, each with its own outdoor area.
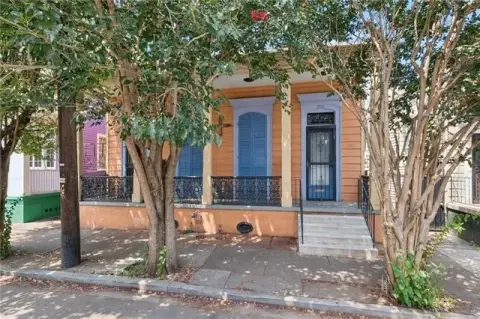
All three residences are reached through a gated landing. The property also includes a two-bay garage and is located at 3619 21 Burgundy St in New Orleans’ historic Bywater neighborhood. Its documented past includes use as a pharmacy and a connection to music and film recordings, with interviews recorded there now held by the Smithsonian.
All three residences are reached through a gated landing. The property also includes a two-bay garage and is located at 3619 21 Burgundy St in New Orleans’ historic Bywater neighborhood. Its documented past includes use as a pharmacy and a connection to music and film recordings, with interviews recorded there now held by the Smithsonian.
Key Highlights
- 3,788‑square‑foot triplex built in 1920
- Unit mix includes 3‑bedroom, 1.5‑bath; 1‑bedroom, 1‑bath; and 2‑bedroom, 1‑bath residences
- Nearly 1,000‑square‑foot deck above a two‑bay garage
Financial Insights
Estimated NOI and Cap Rate
NOI / Yr
$47,966
Cap Rate
6.85%
Suggested Prices Based on Cap Rates
Cap Rate 5%
$959,320
$959.3K
Cap Rate 7%
$685,229
$685.2K
Cap Rate 9%
$532,956
$533.0K
Market Conditions
NOI Build-Up for 3,788 SF
Gross rent
$75.0K $19.80/SF
− Vacancy
−$6.5K −$1.71/SF
EGI
$68.5K $18.09/SF
− OpEx
−$20.6K −$5.43/SF
NOI
$48.0K $12.66/SF
Area
New Orleans, LA
Vacancy
8.64%
Lease Rate
$19.80 /SF/Yr
Expense Ratio
30.00%
Simulate Cap Rate and NOI
Suggested Prices Based on Cap Rates
Cap Rate 5%
$959,320
Cap Rate 7%
$685,229
Cap Rate 9%
$532,956
Alternative Uses
Best Use
Multifamily LT 5
$685.2K
$599.6K – $799.4K
NOI $47,966 @ 7.0% cap · market cap 6.85%
Second Best
Apartment 5plus
$629.8K
$551.1K – $734.8K
NOI $44,088 @ 7.0% cap · market cap 6.30%
Theoretical Best
Office A
$962.8K
$842.4K – $1.12M
NOI $67,395 @ 7.0% cap · market cap 9.63%
Zoning and permitted uses should be independently verified with authorities.
How Realmo checks its estimates
Property Analytics
Current Use
Lease Details
3
Residential units
Location Intelligence
Trade Area within ½ mile
1,033
Businesses Nearby
Explore this area
Business Placement
Demographics for 70117, LA
28,528
Population
15,821
Households
1.8
Avg Household Size
38
Median Age
35%
College-Educated
89%
High-School Grad
5.5 sq mi
ZIP Area
5,187
Density / Sq Mi
$41,645
Median Household Income
$31,744
Median Earnings
$1,191
Median Rent
$247,600
Median Home Value
Market
Vacancy Rate% for Multifamily in South region





Frequently Asked Questions
What type of property is this?
Triplex - Three-unit property with gated access, private outdoor areas, and a two-bay garage.
Where is this triplex located?
The property is located at 3619 21 Burgundy St New Orleans, LA.
What is the asking price?
The asking price for this property is $699,999.
What are key features of this property?
This property features: 3,788‑square‑foot triplex built in 1920; Unit mix includes 3‑bedroom, 1.5‑bath; 1‑bedroom, 1‑bath; and 2‑bedroom, 1‑bath residences; Nearly 1,000‑square‑foot deck above a two‑bay garage