Historic Professional Office
For Sale
$700,000
36 Main Street, Gorham, ME 04038
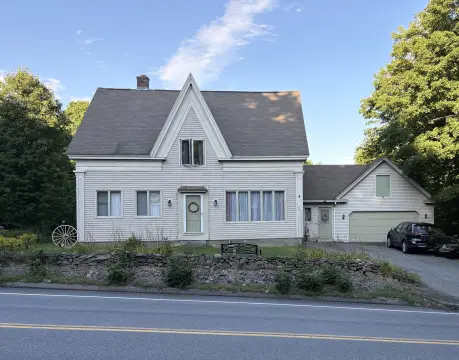
Vacant 1850-era office building with multi-office layout and dedicated parking across two parcels.
Property Size3,120 SF
Price / SF$224.36
Days on Market102
Property Features for 36 Main Street
General Information
Standard status
Active
Size
3,120 SF
Total Parking Spaces
12
Property subtype
Commercial
Lease Term
[]
Building Details
Year Built
1850
Stories
2
Listing Agency:
Keller Williams Realty
Listed By:
Zachary Resnikoff · License #BA928884
(207) 536-4222
Source:
Portsiderealestategroup
Added: Jun 27
Changed: Oct 3
Last Checked: Oct 5 at 8:56PM
Displayed information is deemed reliable but is not guaranteed and should be independently verified. All listing content including descriptions, pricing, images are the copyrighted material of Keller Williams Realty
Investment Insights
Based on property information with market context.
36 Main Street is a professional office building originally constructed in 1850 and configured for office use. The layout includes multiple offices with varying configurations, along with two bathrooms on the first floor and one bathroom on the second floor. The property is vacant and available for owner-user occupancy beginning July 2026.
The building’s prominent Main Street presence places it in Gorham’s village center, with multiple signage opportunities. In addition to parking on-site, the offering includes an extra parcel directly behind the building, providing 8 private parking spaces alongside 4 on-site spaces.
This property is well suited for a range of professional services and office-oriented uses, including medical-related users, educational services, counseling practices, financial firms, nonprofit organizations, and other service-focused organizations that need a dedicated downtown location and convenient parking. Its combination of historic character and practical interior configuration supports businesses seeking a turnkey setting for daily operations.
The building’s prominent Main Street presence places it in Gorham’s village center, with multiple signage opportunities. In addition to parking on-site, the offering includes an extra parcel directly behind the building, providing 8 private parking spaces alongside 4 on-site spaces.
This property is well suited for a range of professional services and office-oriented uses, including medical-related users, educational services, counseling practices, financial firms, nonprofit organizations, and other service-focused organizations that need a dedicated downtown location and convenient parking. Its combination of historic character and practical interior configuration supports businesses seeking a turnkey setting for daily operations.
Key Highlights
- 3,120± SF professional office building built in 1850 in Gorham’s village center
- Vacant property available for owner‑user occupancy beginning July 2026
- Multi‑office layout with two bathrooms on the first floor and one bathroom on the second floor
Financial Insights
Estimated NOI and Cap Rate
NOI / Yr
$44,666
Cap Rate
6.38%
Suggested Prices Based on Cap Rates
Cap Rate 5%
$893,320
$893.3K
Cap Rate 7%
$638,086
$638.1K
Cap Rate 9%
$496,289
$496.3K
Market Conditions
NOI Build-Up for 3,120 SF
Gross rent
$68.1K $21.84/SF
− Vacancy
−$8.6K −$2.75/SF
EGI
$59.6K $19.09/SF
− OpEx
−$14.9K −$4.77/SF
NOI
$44.7K $14.32/SF
Area
Cumberland County, ME
Vacancy
12.60%
Lease Rate
$21.84 /SF/Yr
Expense Ratio
25.00%
Simulate Cap Rate and NOI
Suggested Prices Based on Cap Rates
Cap Rate 5%
$893,320
Cap Rate 7%
$638,086
Cap Rate 9%
$496,289
Alternative Uses
Best Use
Office B
$638.1K
$558.3K – $744.4K
NOI $44,666 @ 7.0% cap · market cap 6.38%
Second Best
—
—
no second resolved use
Theoretical Best
Office A
$857.5K
$750.3K – $1.00M
NOI $60,027 @ 7.0% cap · market cap 8.58%
Zoning and permitted uses should be independently verified with authorities.
Property Analytics
Unlock full access to Insights
Subscribe to Realmo Intelligence
Open Analytics
Current Use
Location Intelligence
Trade Area within ½ mile
429
Businesses Nearby
Explore this area
Business Placement
Demographics for 04038, ME
18,336
Population
6,527
Households
2.8
Avg Household Size
39
Median Age
46%
College-Educated
97%
High-School Grad
50.6 sq mi
ZIP Area
362
Density / Sq Mi
$110,181
Median Household Income
$53,122
Median Earnings
$1,567
Median Rent
$426,300
Median Home Value
Check the figures for this property
Cap Rate, Value Estimation, Potential NOI and more
View Realmo Analytics
Market
Vacancy Rate% for Office in Northeast region

Questions? Ask Rey
Realmo’s AI knows this listing — price, zoning, demand, history. Ask anything.



Frequently Asked Questions
What type of property is this?
Office building - Vacant 1850-era office building with multi-office layout and dedicated parking across two parcels.
Where is this office building located?
The property is located at 36 Main Street Gorham, ME.
What is the asking price?
The asking price for this property is $700,000.
What are key features of this property?
This property features: 3,120± SF professional office building built in 1850 in Gorham’s village center; Vacant property available for owner‑user occupancy beginning July 2026; Multi‑office layout with two bathrooms on the first floor and one bathroom on the second floor



