Light Industrial Building with
For Sale
Contact for pricing
3512 N Tejon St., Colorado Springs, CO 80907
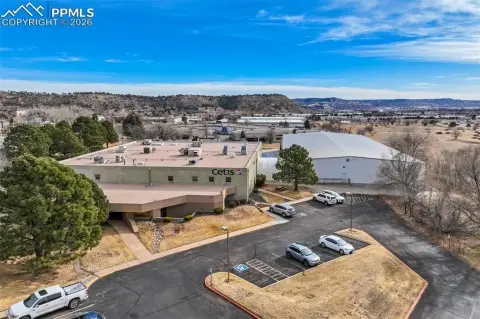
Well-maintained 20,601 sf light industrial facility with climate-controlled high-bay space and multiple drive-in doors.
Property Size20,601 SF
Price / SF$148.05
Days on Market140
Property Features for 3512 N Tejon St.
General Information
Standard status
Active
Size
20,601 SF
Property subtype
Industrial
Zoning
Light Industrial
Investment Type
Owner/User
Warehouse & Industrial
Drive-In Doors
3
Heavy Power
Yes
Additional Details
Opportunity Zone
Yes
Building Details
Year Built
1967
Year Renovated
2023
Listing Agency:
NAI Highland, LLC
Listed By:
John Benson · License #CO FA.100088508
(719) 577-0044
Source:
Crexi
Added: Jun 3
Changed: Oct 6
Last Checked: Oct 19 at 3:57AM
Displayed information is deemed reliable but is not guaranteed and should be independently verified. All listing content including descriptions, pricing, images are the copyrighted material of NAI Highland, LLC

Ask AI about this property
Review the available facts, identify missing information and prepare questions for the agent.
Investment Insights
Based on property information with market context.
Built in 1967, this well-maintained light industrial building totals 20,601 square feet and includes 7,000 square feet of high-bay warehouse space. The roof was installed in 2018, with additional updates completed in 2023. Interior comfort is supported by 100% climate-controlled HVAC, served by 69.5 tons of RTU cooling capacity. The facility includes three drive-in loading doors and robust electrical service with 2,400-amp, 3-phase capacity, providing flexibility for a range of warehouse, manufacturing, and distribution needs.
The property is located at 3512 N Tejon St in Colorado Springs. It is within a North Nevada overlay district, which is designed to encourage enhanced redevelopment, improved site design, and long-term economic activity along the North Nevada corridor. The address is also within a federally designated opportunity zone, which may provide potential capital gains tax advantages for qualified investors.
For tenants and owner-users, the combination of high-bay warehouse area, climate control, multiple drive-in doors, and strong electrical capacity supports a variety of industrial operations. For investors, the location’s enterprise zone eligibility may offer potential state tax credits and incentives tied to expansion, job creation, equipment investment, and facility improvements within the zone.
The property is located at 3512 N Tejon St in Colorado Springs. It is within a North Nevada overlay district, which is designed to encourage enhanced redevelopment, improved site design, and long-term economic activity along the North Nevada corridor. The address is also within a federally designated opportunity zone, which may provide potential capital gains tax advantages for qualified investors.
For tenants and owner-users, the combination of high-bay warehouse area, climate control, multiple drive-in doors, and strong electrical capacity supports a variety of industrial operations. For investors, the location’s enterprise zone eligibility may offer potential state tax credits and incentives tied to expansion, job creation, equipment investment, and facility improvements within the zone.
Key Highlights
- 20,601 SF light industrial building built in 1967
- New roof installed in 2018, with additional updates completed in 2023
- Includes 7,000 SF+ high‑bay warehouse space with 100% climate‑controlled HVAC
Financial Insights
Estimated NOI and Cap Rate
NOI / Yr
$226,999
Cap Rate
7.44%
Suggested Prices Based on Cap Rates
Cap Rate 5%
$4,539,980
$4.5M
Cap Rate 7%
$3,242,843
$3.2M
Cap Rate 9%
$2,522,211
$2.5M
Market Conditions
NOI Build-Up for 20,601 SF
Gross rent
$279.3K $13.56/SF
− Vacancy
−$12.3K −$0.60/SF
EGI
$267.1K $12.96/SF
− OpEx
−$40.1K −$1.94/SF
NOI
$227.0K $11.02/SF
Area
Colorado Springs, CO
Vacancy
4.40%
Lease Rate
$13.56 /SF/Yr
Expense Ratio
15.00%
Simulate Cap Rate and NOI
Suggested Prices Based on Cap Rates
Cap Rate 5%
$4,539,980
Cap Rate 7%
$3,242,843
Cap Rate 9%
$2,522,211
Alternative Uses
Best Use
Warehouse
$3.24M
$2.84M – $3.78M
NOI $226,999 @ 7.0% cap · market cap 7.44%
Second Best
Industrial
$2.67M
$2.34M – $3.12M
NOI $186,941 @ 7.0% cap · market cap 6.13%
Theoretical Best
Specialty Retail
$4.07M
$3.56M – $4.75M
NOI $284,788 @ 7.0% cap · market cap 9.34%
Zoning and permitted uses should be independently verified with authorities.
How Realmo checks its estimates
Property Analytics
Unlock full access to Insights
Subscribe to Realmo Intelligence
Open Analytics
Current Use
Lease Details
3
Drive-in doors
Yes
Heavy power
Location Intelligence
Trade Area within ½ mile
1,123
Businesses Nearby
Well-served
Demand for This Use
Explore this area
Business Placement
Demographics for 80907, CO
28,806
Population
13,250
Households
2.2
Avg Household Size
40
Median Age
40%
College-Educated
93%
High-School Grad
9.8 sq mi
ZIP Area
2,939
Density / Sq Mi
$71,393
Median Household Income
$41,355
Median Earnings
$1,392
Median Rent
$371,200
Median Home Value
Check the figures for this property
Cap Rate, Value Estimation, Potential NOI and more
View Realmo Analytics
Market
Vacancy Rate% for Industrial in Colorado Springs, CO




Similar Off Market Nearby
- Allied Van Lines — 2838 N El Paso St #99a, Colorado Springs, CO 80907
- Public Storage — 3061 Wood Ave, Colorado Springs, CO 80907
- Self-Storage at U-Haul — 3105 N Nevada Ave, Colorado Springs, CO 80907
- Colorado Springs Self Storage - North — 330 karen ln, colorado springs, co 80907
- A Better Self Storage North Nevada — 3250 N Nevada Ave, Colorado Springs, CO 80907
Frequently Asked Questions
What type of property is this?
Warehouse - Well-maintained 20,601 sf light industrial facility with climate-controlled high-bay space and multiple drive-in doors.
Where is this warehouse located?
The property is located at 3512 N Tejon St. Colorado Springs, CO.
What is the asking price?
The asking price for this property is $3,050,000.
What are key features of this property?
This property features: 20,601 SF light industrial building built in 1967; New roof installed in 2018, with additional updates completed in 2023; Includes 7,000 SF+ high‑bay warehouse space with 100% climate‑controlled HVAC


