Norwalk Storefront
For Sale
$749,000
35 E Main Street Norwalk, Norwalk, OH 44857
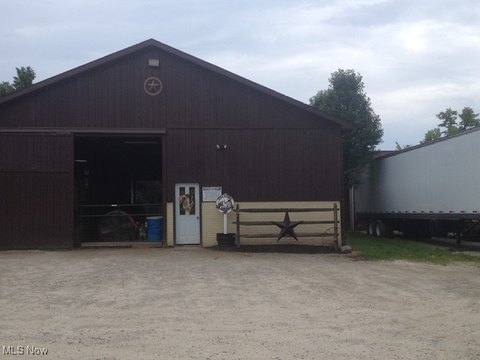
Standalone storefront building with rooftop HVAC, three-phase electric, and rear parking off Monroe Street.
Property Size11,400 SF
Price / SF$65.70
Days on Market99
Property Features for 35 E Main Street Norwalk
General Information
Standard status
Active
Size
11,400 SF
Total Parking Spaces
7
Zoning
Commercial,Office,Retail
Additional Details
Heavy Power
Yes
Amenities
Yes
ON
256
7000
Public Records
3900
57'
No
Public
7.00
57'x266'
0.4244
1764844.49
Block,Brick
Building Details
Year Built
1957
Stories
1
Listed By:
Brian McLaughlin
(614) 660-5959
Source:
Movenowohio
Added: Jun 30
Changed: Sep 5
Last Checked: Oct 5 at 3:55PM
Displayed information is deemed reliable but is not guaranteed and should be independently verified. All listing content including descriptions, pricing, images are the copyrighted material of Brian McLaughlin
Investment Insights
Based on property information with market context.
This for-sale storefront building offers more than 11,000 square feet of floor space, along with a partial basement and a loading dock. The property includes a rear retail entrance and a parking area to the back off Monroe Street. A roof and rooftop HVAC units have been recently replaced, and the building has three-phase electric. The layout also supports a second storefront space with its own separate entrance and address on E. Main, creating flexibility for a sublease arrangement if desired.
The building is positioned on East Main Street in Norwalk, providing two retail-front entrances. Parking is located at the rear, which can support customer access and service needs via the loading dock. The presence of both a rear entrance and an additional storefront entry helps accommodate different operating setups within the same overall structure.
The property has been used for retail showroom operations for many years, but the improvements and multiple entry points may also fit other commercial office or mixed-use concepts, subject to applicable requirements. With updated roofing and rooftop HVAC, plus three-phase electric and loading access, it is well suited for an operator looking for a dedicated building with room to manage multiple spaces, or for buyers considering an owner-occupant with an option to sublease part of the facility.
The building is positioned on East Main Street in Norwalk, providing two retail-front entrances. Parking is located at the rear, which can support customer access and service needs via the loading dock. The presence of both a rear entrance and an additional storefront entry helps accommodate different operating setups within the same overall structure.
The property has been used for retail showroom operations for many years, but the improvements and multiple entry points may also fit other commercial office or mixed-use concepts, subject to applicable requirements. With updated roofing and rooftop HVAC, plus three-phase electric and loading access, it is well suited for an operator looking for a dedicated building with room to manage multiple spaces, or for buyers considering an owner-occupant with an option to sublease part of the facility.
Key Highlights
- Standalone Main St. Uptown Norwalk storefront building with 11,000+ SF of floor space plus partial basement and loading dock
- Rear parking area off Monroe St. with 7 total parking spaces and a rear retail entrance
- 57' frontage and 0.4244‑acre lot (57' x 266') with block/brick exterior construction
Financial Insights
Estimated NOI and Cap Rate
NOI / Yr
$48,936
Cap Rate
6.53%
Suggested Prices Based on Cap Rates
Cap Rate 5%
$978,720
$978.7K
Cap Rate 7%
$699,086
$699.1K
Cap Rate 9%
$543,733
$543.7K
Market Conditions
NOI Build-Up for 11,400 SF
Gross rent
$72.5K $6.36/SF
− Vacancy
−$2.6K −$0.23/SF
EGI
$69.9K $6.13/SF
− OpEx
−$21.0K −$1.84/SF
NOI
$48.9K $4.29/SF
Area
Huron County, OH
Vacancy
3.58%
Lease Rate
$6.36 /SF/Yr
Expense Ratio
30.00%
Simulate Cap Rate and NOI
Suggested Prices Based on Cap Rates
Cap Rate 5%
$978,720
Cap Rate 7%
$699,086
Cap Rate 9%
$543,733
Alternative Uses
Best Use
Retail
$699.1K
$611.7K – $815.6K
NOI $48,936 @ 7.0% cap · market cap 6.53%
Second Best
—
—
no second resolved use
Theoretical Best
Specialty Retail
$2.37M
$2.07M – $2.76M
NOI $165,859 @ 7.0% cap · market cap 22.14%
Zoning and permitted uses should be independently verified with authorities.
Property Analytics
Unlock full access to Insights
Subscribe to Realmo Intelligence
Open Analytics
Current Use
Lease Details
Yes
Heavy power
Location Intelligence
Trade Area within ½ mile
601
Businesses Nearby
Under-served
Demand for This Use
Explore this area
Business Placement
Demographics for 44857, OH
23,619
Population
10,579
Households
2.2
Avg Household Size
41
Median Age
21%
College-Educated
93%
High-School Grad
81.6 sq mi
ZIP Area
289
Density / Sq Mi
$62,227
Median Household Income
$42,100
Median Earnings
$795
Median Rent
$170,400
Median Home Value
Check the figures for this property
Cap Rate, Value Estimation, Potential NOI and more
View Realmo Analytics
Market
Vacancy Rate% for Retail in Midwest region

Questions? Ask Rey
Realmo’s AI knows this listing — price, zoning, demand, history. Ask anything.





Similar Off Market Nearby
- Betschman's Flowers On Main — 120 E Main St, Norwalk, OH 44857
Frequently Asked Questions
What type of property is this?
Storefront property - Standalone storefront building with rooftop HVAC, three-phase electric, and rear parking off Monroe Street.
Where is this storefront property located?
The property is located at 35 E Main Street Norwalk Norwalk, OH.
What is the asking price?
The asking price for this property is $749,000.
What are key features of this property?
This property features: Standalone Main St. Uptown Norwalk storefront building with 11,000+ SF of floor space plus partial basement and loading dock; Rear parking area off Monroe St. with 7 total parking spaces and a rear retail entrance; 57' frontage and 0.4244‑acre lot (57' x 266') with block/brick exterior construction