7-Unit Apartment
For Sale
Contact for pricing
Pending
349 Virginia Street, El Segundo, CA 90245
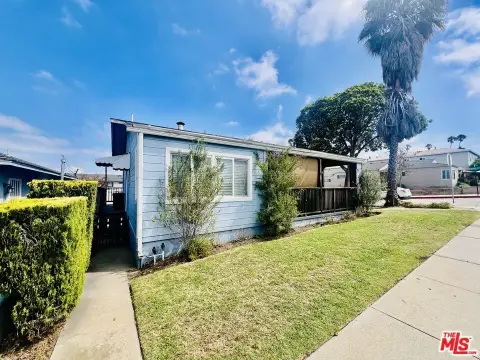
Well-maintained El Segundo property with refurbished residences, private garages, tandem parking, and shared on-site laundry.
Property Size6,640 SF
Lot Size0.16 Acres
Days on Market294
Property Features for 349 Virginia Street
General Information
Standard status
Pending
Size
6,640 SF
Total Parking Spaces
13
Lot size
0.16 Acres
Property subtype
Multifamily
Zoning
Assessor
Additional Details
Road Access
Yes
Multifamily Units
7
Amenities
on-site laundry
courtyard
fireplaces
Building Details
Year Built
1978
Buildings
1
Stories
3
Units
7
Listing Agency:
DOMO Real Estate
Listed By:
Robert Freedman · License #00711607
Source:
Crexi
Added: Dec 25, 2025
Changed: Oct 2
Last Checked: Oct 14 at 7:36PM
Displayed information is deemed reliable but is not guaranteed and should be independently verified. All listing content including descriptions, pricing, images are the copyrighted material of DOMO Real Estate

Ask AI about this property
Review the available facts, identify missing information and prepare questions for the agent.
Investment Insights
Based on property information with market context.
This 7-unit apartment property at 349 Virginia Street in El Segundo provides 6,640 square feet of living space on a 50 X 143 Street to alley lot. The unit mix includes five flats and two townhome-style residences, with two bedrooms in every unit and most offering more than one bath. Six units include fireplaces, while each residence has its own water heater. Six units have been substantially refurbished, and recent building work includes new windows, replumbing, reroofing, and exterior painting.
The property includes nine private garages that have undergone earthquake retrofit, along with four tandem parking spaces. Shared amenities include a spacious on-site laundry area and a landscaped courtyard. Downtown restaurants, the beach, employment hubs, and transportation are described as being nearby. Professional management is provided by First Light Property Management, which has more than 15 years of local management experience.
The property includes nine private garages that have undergone earthquake retrofit, along with four tandem parking spaces. Shared amenities include a spacious on-site laundry area and a landscaped courtyard. Downtown restaurants, the beach, employment hubs, and transportation are described as being nearby. Professional management is provided by First Light Property Management, which has more than 15 years of local management experience.
Key Highlights
- 7‑unit apartment building with 6,640 square feet of living space
- 50 X 143 Street to alley lot at 349 Virginia Street
- Nine private garages with earthquake retrofit plus 4 tandem parking spaces
Financial Insights
Estimated NOI and Cap Rate
NOI / Yr
$106,843
Cap Rate
2.89%
Suggested Prices Based on Cap Rates
Cap Rate 5%
$2,136,860
$2.1M
Cap Rate 7%
$1,526,329
$1.5M
Cap Rate 9%
$1,187,144
$1.2M
Market Conditions
NOI Build-Up for 6,640 SF
Gross rent
$211.2K $31.80/SF
− Vacancy
−$16.9K −$2.54/SF
EGI
$194.3K $29.26/SF
− OpEx
−$87.4K −$13.17/SF
NOI
$106.8K $16.09/SF
Area
Los Angeles County, CA
Vacancy
8.00%
Lease Rate
$31.80 /SF/Yr
Expense Ratio
45.00%
Simulate Cap Rate and NOI
Suggested Prices Based on Cap Rates
Cap Rate 5%
$2,136,860
Cap Rate 7%
$1,526,329
Cap Rate 9%
$1,187,144
Alternative Uses
Best Use
Apartment 5plus
$1.53M
$1.34M – $1.78M
NOI $106,843 @ 7.0% cap · market cap 2.89%
Second Best
—
—
no second resolved use
Theoretical Best
Office A
$3.56M
$3.11M – $4.15M
NOI $248,852 @ 7.0% cap · market cap 6.73%
Zoning and permitted uses should be independently verified with authorities.
How Realmo checks its estimates
Property Analytics
Unlock full access to Insights
Subscribe to Realmo Intelligence
Open Analytics
Current Use
Lease Details
7
Residential units
Yes
Paved road access
Location Intelligence
Trade Area within ½ mile
1,394
Businesses Nearby
Explore this area
Business Placement
Demographics for 90245, CA
17,272
Population
7,677
Households
2.2
Avg Household Size
39
Median Age
63%
College-Educated
98%
High-School Grad
5.3 sq mi
ZIP Area
3,259
Density / Sq Mi
$149,149
Median Household Income
$83,427
Median Earnings
$2,547
Median Rent
$1,521,600
Median Home Value
Check the figures for this property
Cap Rate, Value Estimation, Potential NOI and more
View Realmo Analytics
Market
Vacancy Rate% for Multifamily in West region



Frequently Asked Questions
What type of property is this?
Apartment building - Well-maintained El Segundo property with refurbished residences, private garages, tandem parking, and shared on-site laundry.
Where is this apartment building located?
The property is located at 349 Virginia Street El Segundo, CA.
What is the asking price?
The asking price for this property is $3,695,000.
What are key features of this property?
This property features: 7‑unit apartment building with 6,640 square feet of living space; 50 X 143 Street to alley lot at 349 Virginia Street; Nine private garages with earthquake retrofit plus 4 tandem parking spaces


