Private Triplex with


For Sale
$1,300,000
3476 WINTON Avenue, Sarasota, FL 34234
Residential Income, SARASOTA, FL
Property Size3,228 SF
Lot Size0.63 Acres
Price / SF$402.73
Days on Market47
Property Features for 3476 WINTON Avenue
General Information
Property type
Residential Multi Family
Property subtype
Triplex
Zoning
RTD9
Bedrooms
9
Bathrooms
6
Full bathrooms
6
Rooms
Bedroom 6, Bathroom 4, Bedroom 5, Bathroom 5, Bedroom 3, Bedroom 1, Bathroom 6, Bathroom 2, Dining Room, Bedroom 7, Bathroom 1, Bedroom 2, Bedroom 8, Bathroom 3, Bedroom 4, Bedroom 9
Window features
Blinds, Drapes
Patio and Porch features
Porch
Pets allowed
Yes, Cats OK, Dogs OK
Pool private
1
Interior features
Ceiling Fans(s), Eat-in Kitchen, Living Room/Dining Room Combo, Primary Bedroom Main Floor, Thermostat
Exterior features
Fire Pit, Outdoor Grill, Private Entrance, Private Yard
Subdivision
INDIAN BEACH
Lot features
City Limits, Oversized Lot, Private, Street One Way
View
Park
Directions
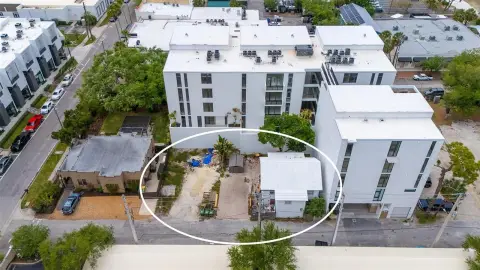
From University Parkway Turn left onto Bradenton Rd. At the traffic circle, continue straight to stay on Bradenton Rd. At the traffic circle, take the 1st exit onto Myrtle St. Turn left onto Winton Ave. Home has private driveway 3 homes in the back
Standard status
Active
APN
2005010017
Size
3,228 SF
Lot size
0.63 Acres
Taxes and HOA fees
Tax Year
2025
Tax Description
BEG AT NE COR OF BLK 81 TH W 62.5 FT TH S 350 FT FOR POB TH W 100 FT TH S 170 FT TH E 162.5 FT TH N 170 FT TH W 62.5 FT TO POB ALSO EASEMENT MAP OF INDIAN BEACH, BEING SAME LANDS AS DESC IN ORI
Tax Annual Amount
12511
Legal Description
BEG AT NE COR OF BLK 81 TH W 62.5 FT TH S 350 FT FOR POB TH W 100 FT TH S 170 FT TH E 162.5 FT TH N 170 FT TH W 62.5 FT TO POB ALSO EASEMENT MAP OF INDIAN BEACH, BEING SAME LANDS AS DESC IN ORI
Utilities
Sewer type
Public Sewer
Heating system
Heat Pump (Heating), Central
Cooling system
Central Air
Water source
Public
Amenities
pool
cabana
Building Details
Year built
1989
Flooring type
Tile, Vinyl
Building materials
Vinyl Siding, Frame
Roof type
Metal
Additional Structures
Cabana
Listing Agency:
FLORIDA LIFE TEAM LLC
Listed By:
Chandler South
(941) 303-9575
Added: Sep 10
Changed: Oct 20
Last Checked: Oct 26 at 9:06AM
MLS# A4705532
Copyright © 2026 Stellar MLS. All rights reserved. All information provided by the listing agent/broker is deemed reliable but is not guaranteed and should be independently verified.

Ask AI about this property
Review the available facts, identify missing information and prepare questions for the agent.
Investment Insights
Based on property information with market context.
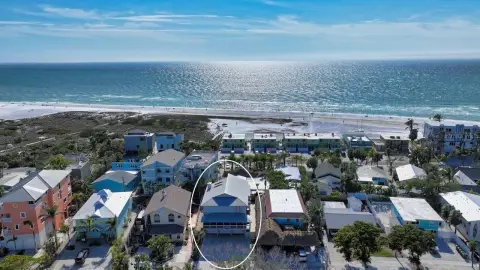
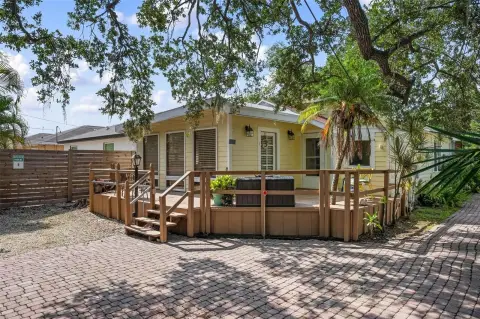
This RTD9-zoned triplex includes 3 detached single-family homes totaling 3,228 square feet on a 0.63-acre parcel. Each residence has 3 bedrooms and 2 bathrooms, with updated interiors, individual design elements, tile or vinyl flooring, central air, and public water and sewer. A shared private pool, cabana spaces, porch areas, fire pit, and outdoor grill form the property’s central gathering area. The homes were built in 1989 and feature metal roofs, vinyl siding, and private entrances.
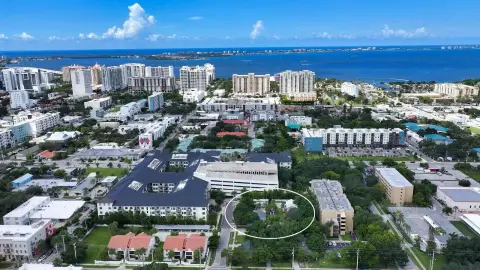
The property is on a private dead-end street with no HOA and sits outside a designated flood zone. It is minutes from Downtown Sarasota, The Ringling Museum, Sarasota Bradenton International Airport, Ringling College of Art and Design, New College of Florida, dining, and shopping. Sarasota Bay is within walking distance. Current operations include active vacation rentals, while one cottage is used for student housing with bedrooms rented individually.
The property is on a private dead-end street with no HOA and sits outside a designated flood zone. It is minutes from Downtown Sarasota, The Ringling Museum, Sarasota Bradenton International Airport, Ringling College of Art and Design, New College of Florida, dining, and shopping. Sarasota Bay is within walking distance. Current operations include active vacation rentals, while one cottage is used for student housing with bedrooms rented individually.
Key Highlights
- 3 detached single‑family homes on 0.63 acres
- 3,228 square feet across the triplex
- Each residence has 3 bedrooms and 2 bathrooms
Property Analytics
Who owns this building?
See the owner, sales and loan history
Open Analytics
Lease Details
3
Residential units
Location Intelligence
Trade Area within ½ mile
666
Businesses Nearby
Explore this area
Business Placement
Demographics for 34234, FL
20,858
Population
10,257
Households
2
Avg Household Size
42
Median Age
28%
College-Educated
86%
High-School Grad
6.5 sq mi
ZIP Area
3,209
Density / Sq Mi
$56,607
Median Household Income
$33,536
Median Earnings
$1,352
Median Rent
$222,900
Median Home Value
Check the figures for this property
Cap Rate, Value Estimation, Potential NOI and more
View Realmo Analytics
Market
Vacancy Rate% for Multifamily in South region







Frequently Asked Questions
What type of property is this?
Triplex - Three detached residences share a landscaped outdoor setting with pool and cabana spaces.
Where is this triplex located?
The property is located at 3476 WINTON Avenue Sarasota, FL.
What is the asking price?
The asking price for this property is $1,300,000.
What are key features of this property?
This property features: 3 detached single‑family homes on 0.63 acres; 3,228 square feet across the triplex; Each residence has 3 bedrooms and 2 bathrooms