Two-Family Duplex with Detached
For Sale
$599,000
Pending
345 Sprague St, Fall River, MA 02724
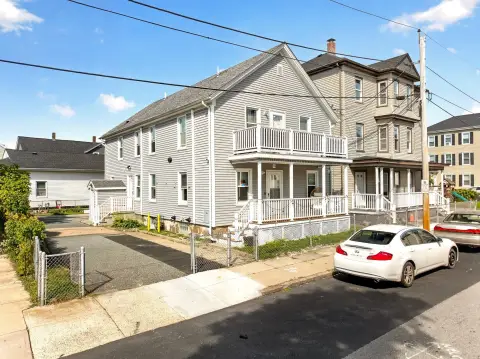
Vacant two-unit home with preserved architectural details, separate porches, and a detached garage for storage or workshop use.
Property Size2,762 SF
Lot Size0.20 Acres
Days on Market68
Property Features for 345 Sprague St
General Information
Standard status
Pending
Size
2,762 SF
Total Parking Spaces
2
Lot size
0.20 Acres
Property subtype
Residential Income
Additional Details
Multifamily Units
2
Taxes and HOA fees
Annual Taxes
$5,425
Amenities
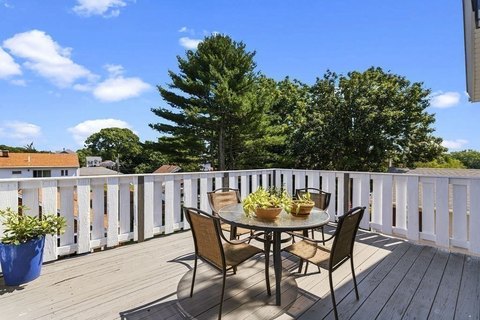
porches
backyard
Building Details
Buildings
1
Listing Agency:
eXp Realty LLC
(888) 854-7493
Listed By:
Holly Bronhard · License #9531754
(508) 971-5593
Source:
Exprealty
Added: Aug 10
Changed: Oct 15
Last Checked: Oct 15 at 12:55AM
Displayed information is deemed reliable but is not guaranteed and should be independently verified. All listing content including descriptions, pricing, images are the copyrighted material of eXp Realty LLC

Ask AI about this property
Review the available facts, identify missing information and prepare questions for the agent.
Investment Insights
Based on property information with market context.
This vacant two-family duplex offers 2,762 SF with a total of 6 bedrooms and 2 full baths. The interior retains hardwood flooring, solid wood doors, stained glass, vintage light fixtures, and original glass doorknobs. Each unit includes a kitchen with substantial cabinetry and a separate pantry, while porches serve both levels.
The property sits on a 0.198-acre lot at 345 Sprague St in Fall River, MA, with a spacious backyard and a detached two-stall garage. The garage has soaring ceilings and can accommodate storage, workshop space, or a car lift. Vinyl siding and vinyl windows provide low-maintenance exterior features. Shopping, dining, walking, and everyday amenities are nearby.
The property sits on a 0.198-acre lot at 345 Sprague St in Fall River, MA, with a spacious backyard and a detached two-stall garage. The garage has soaring ceilings and can accommodate storage, workshop space, or a car lift. Vinyl siding and vinyl windows provide low-maintenance exterior features. Shopping, dining, walking, and everyday amenities are nearby.
Key Highlights
- Vacant two‑family duplex with 6 bedrooms and 2 full baths
- 2,762 SF home on a 0.198‑acre lot
- Detached two‑stall garage with soaring ceilings
Financial Insights
Estimated NOI and Cap Rate
NOI / Yr
$49,360
Cap Rate
8.24%
Suggested Prices Based on Cap Rates
Cap Rate 5%
$987,200
$987.2K
Cap Rate 7%
$705,143
$705.1K
Cap Rate 9%
$548,444
$548.4K
Market Conditions
NOI Build-Up for 2,762 SF
Gross rent
$76.2K $27.60/SF
− Vacancy
−$5.7K −$2.07/SF
EGI
$70.5K $25.53/SF
− OpEx
−$21.2K −$7.66/SF
NOI
$49.4K $17.87/SF
Area
Bristol County, MA
Vacancy
7.50%
Lease Rate
$27.60 /SF/Yr
Expense Ratio
30.00%
Simulate Cap Rate and NOI
Suggested Prices Based on Cap Rates
Cap Rate 5%
$987,200
Cap Rate 7%
$705,143
Cap Rate 9%
$548,444
Alternative Uses
Best Use
Multifamily LT 5
$705.1K
$617.0K – $822.7K
NOI $49,360 @ 7.0% cap · market cap 8.24%
Second Best
Apartment 5plus
$655.3K
$573.4K – $764.5K
NOI $45,872 @ 7.0% cap · market cap 7.66%
Theoretical Best
Office A
$1.68M
$1.47M – $1.96M
NOI $117,741 @ 7.0% cap · market cap 19.66%
Zoning and permitted uses should be independently verified with authorities.
How Realmo checks its estimates
Property Analytics
Unlock full access to Insights
Subscribe to Realmo Intelligence
Open Analytics
Current Use
Lease Details
2
Residential units
Location Intelligence
Trade Area within ½ mile
1,127
Businesses Nearby
Explore this area
Business Placement
Demographics for 02724, MA
18,050
Population
8,808
Households
2
Avg Household Size
38
Median Age
15%
College-Educated
76%
High-School Grad
1.8 sq mi
ZIP Area
10,028
Density / Sq Mi
$49,809
Median Household Income
$42,334
Median Earnings
$1,105
Median Rent
$368,300
Median Home Value
Check the figures for this property
Cap Rate, Value Estimation, Potential NOI and more
View Realmo Analytics
Market
Vacancy Rate% for Multifamily in Northeast region




Frequently Asked Questions
What type of property is this?
Duplex - Vacant two-unit home with preserved architectural details, separate porches, and a detached garage for storage or workshop use.
Where is this duplex located?
The property is located at 345 Sprague St Fall River, MA.
What is the asking price?
The asking price for this property is $599,000.
What are key features of this property?
This property features: Vacant two‑family duplex with 6 bedrooms and 2 full baths; 2,762 SF home on a 0.198‑acre lot; Detached two‑stall garage with soaring ceilings


