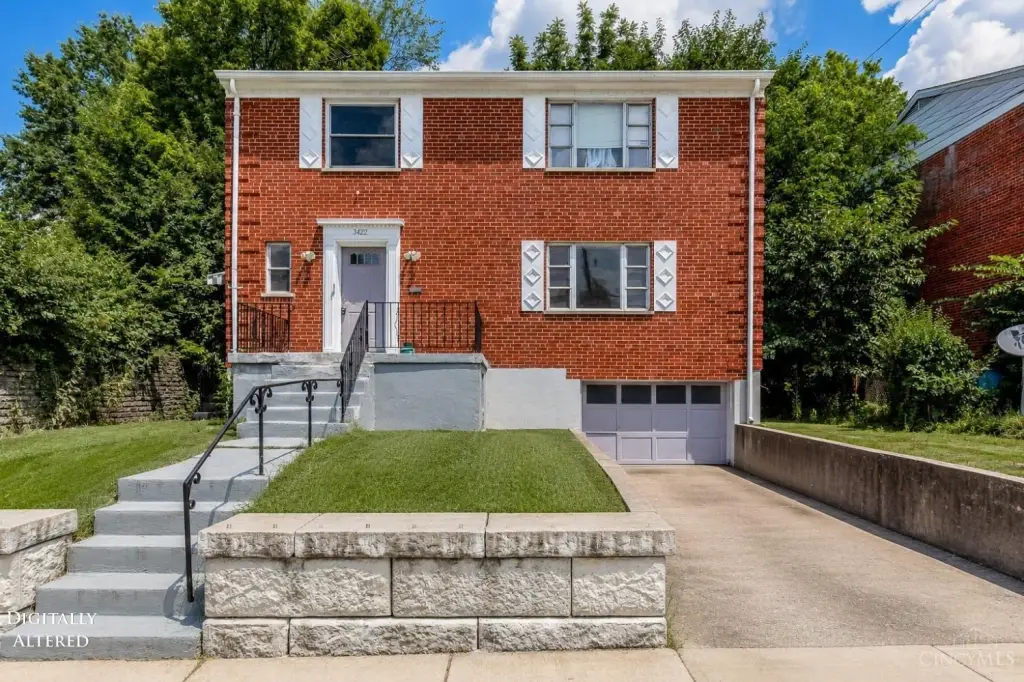
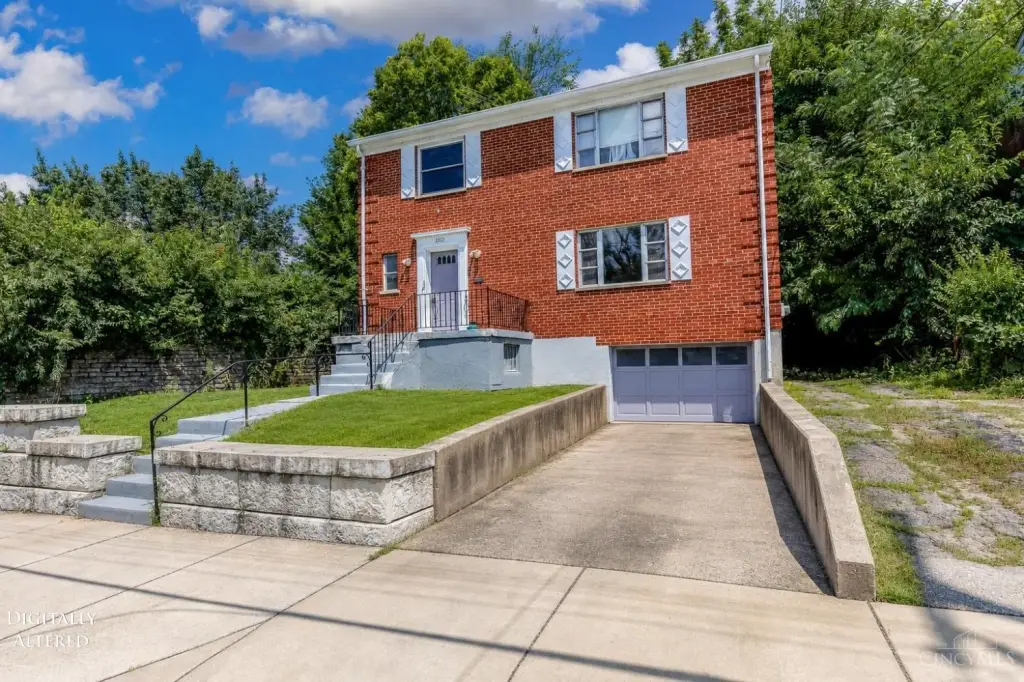
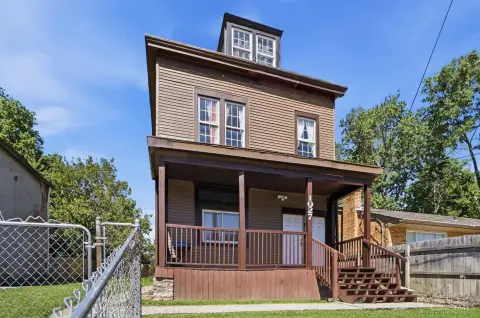
Brick Duplex with
For Sale
$185,000
Pending
3422 Bassett Road, Cincinnati, OH 45205
Residential Income, Cincinnati, OH
Property Size1,664 SF
Lot Size0.14 Acres
Days on Market93
Property Features for 3422 Bassett Road
General Information
Property type
Residential Multi Family
Property subtype
Other
Parking features
Garage, Off Street, Driveway
Window features
Vinyl Frames
High school district
Cincinnati City SD
Directions
State street to Elberon to Bassett
Subdivision
Hamilton-W04
Standard status
Pending
APN
177-0034-0163-00
Size
1,664 SF
Lot size
0.14 Acres
Utilities
Heating system
Forced Air
Amenities
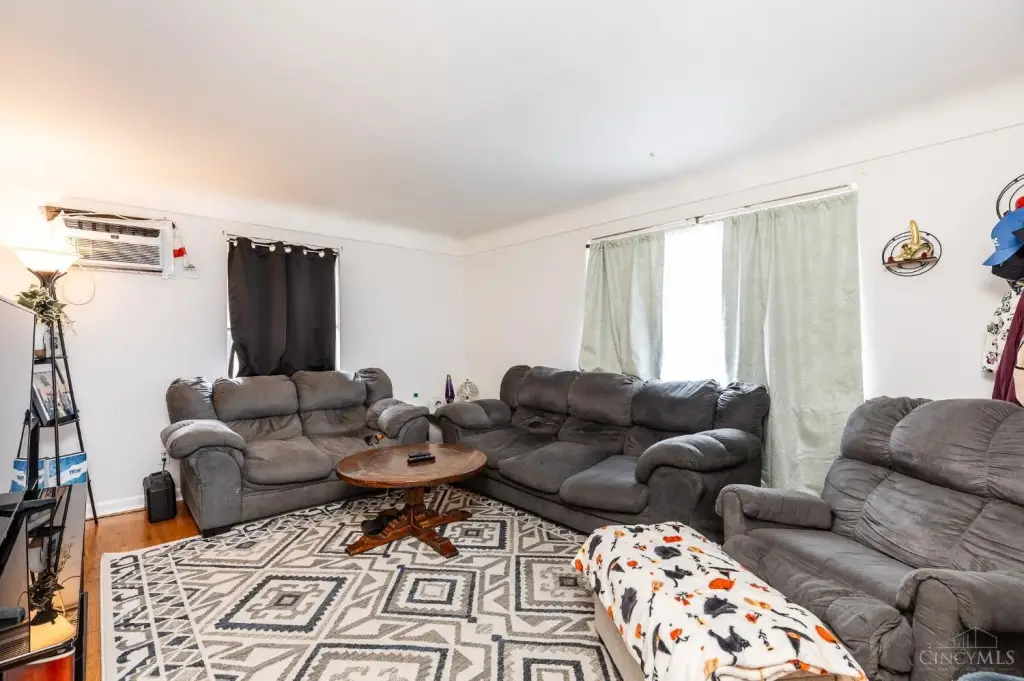
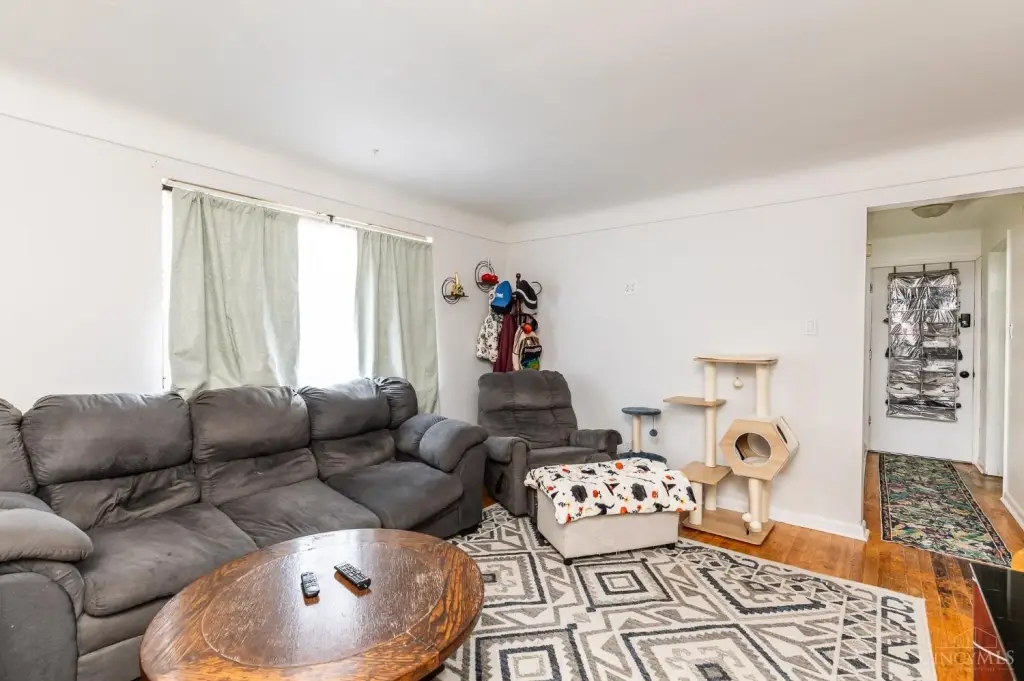
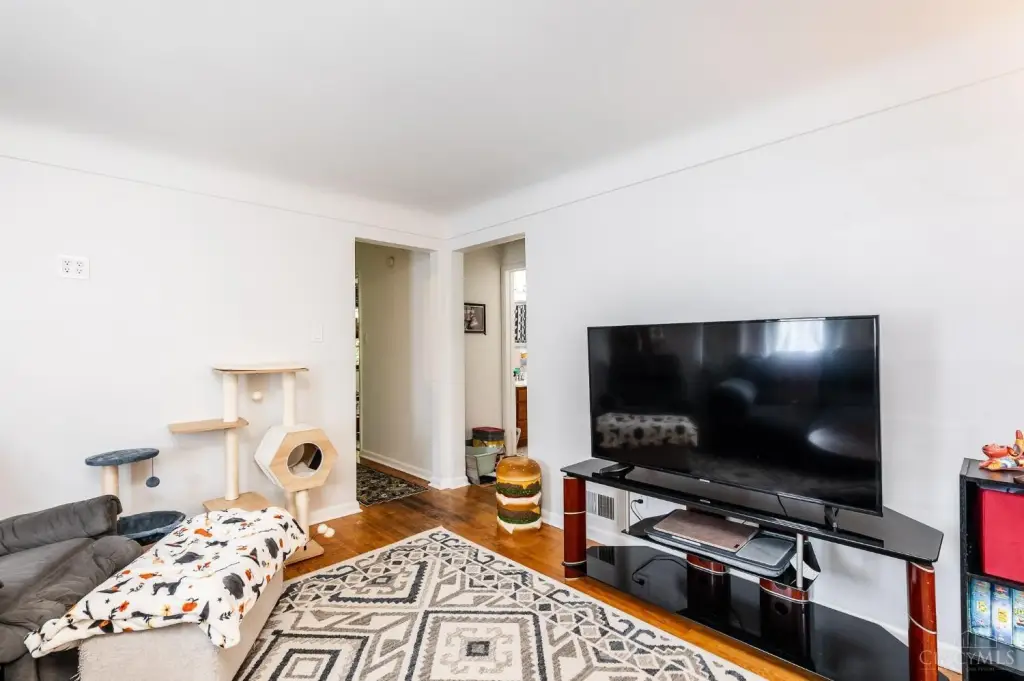
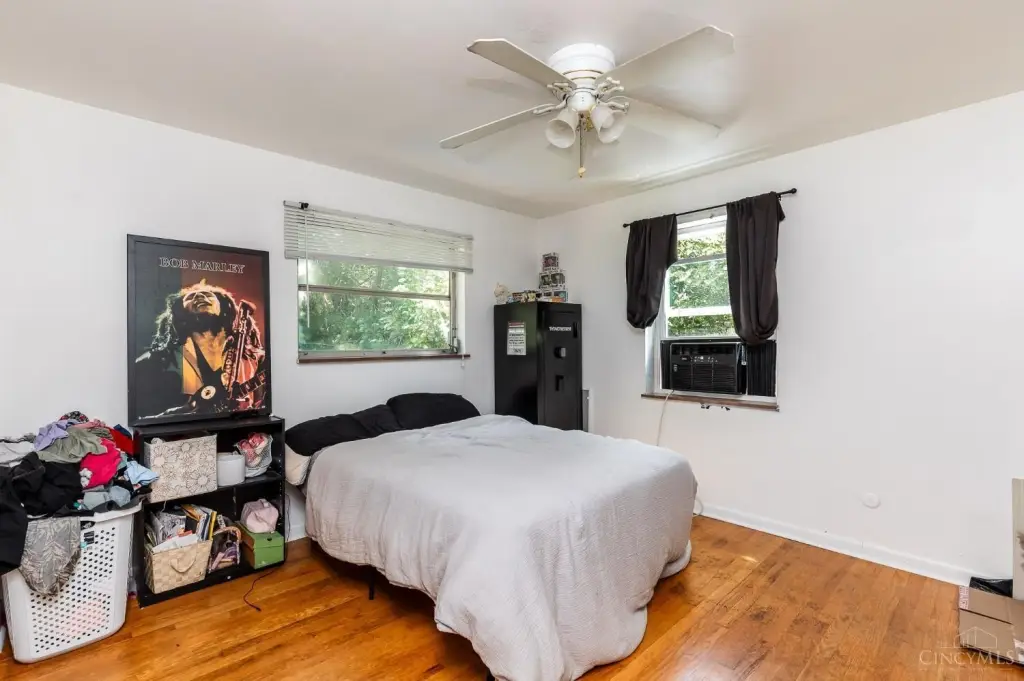
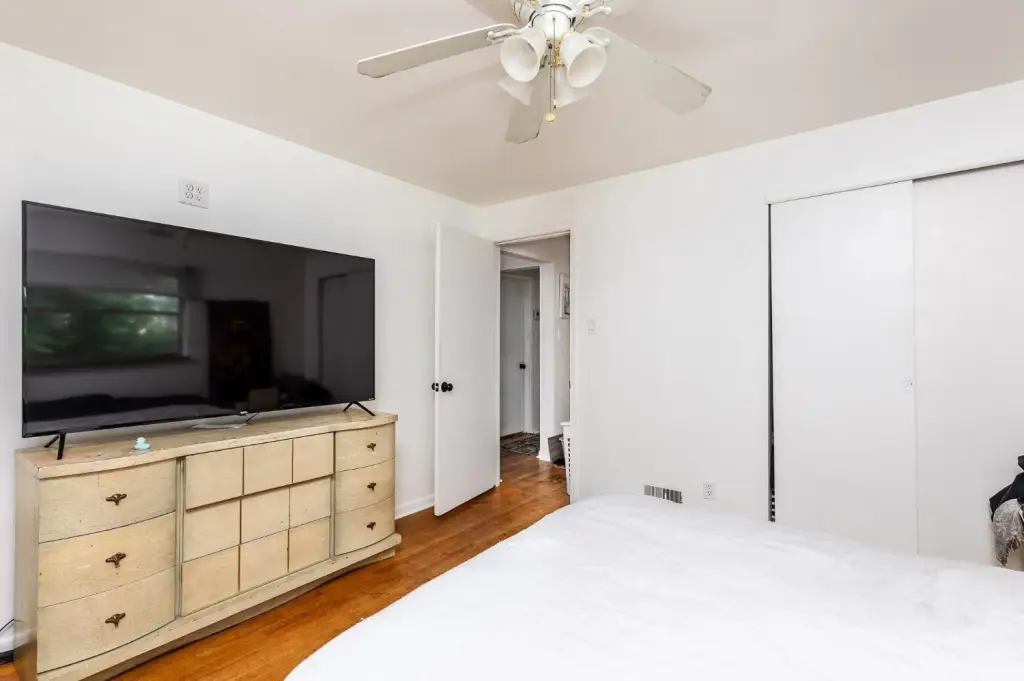
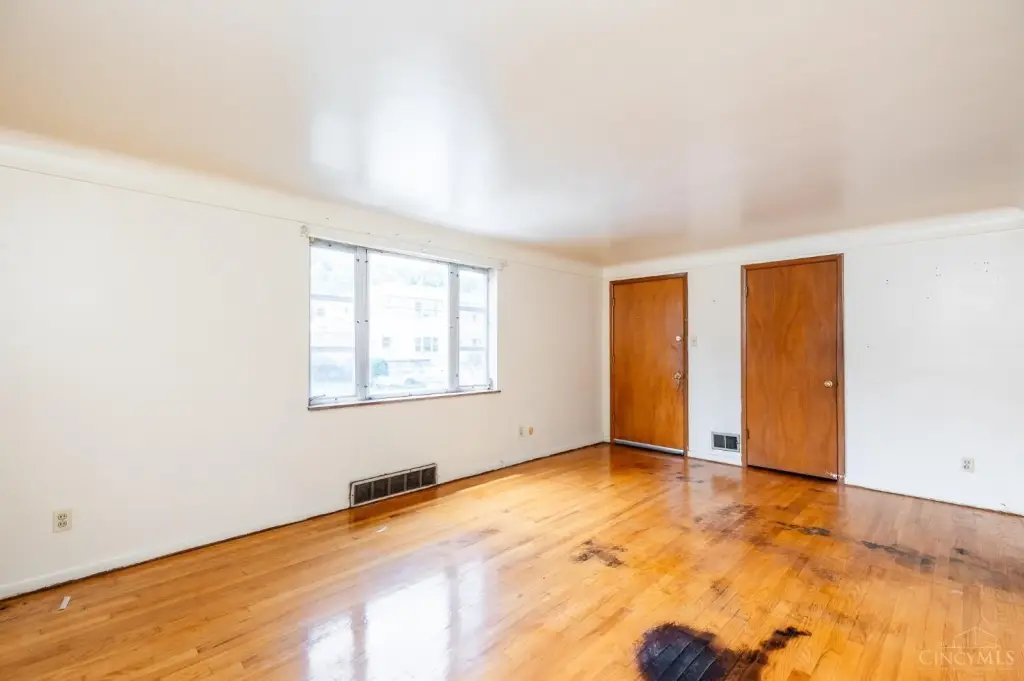
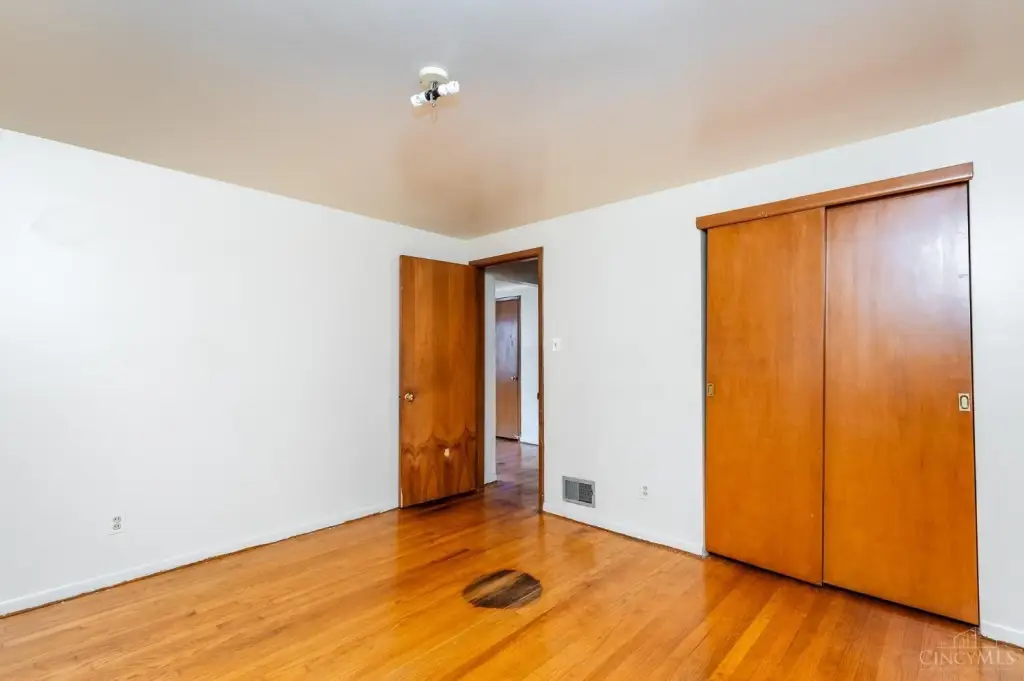
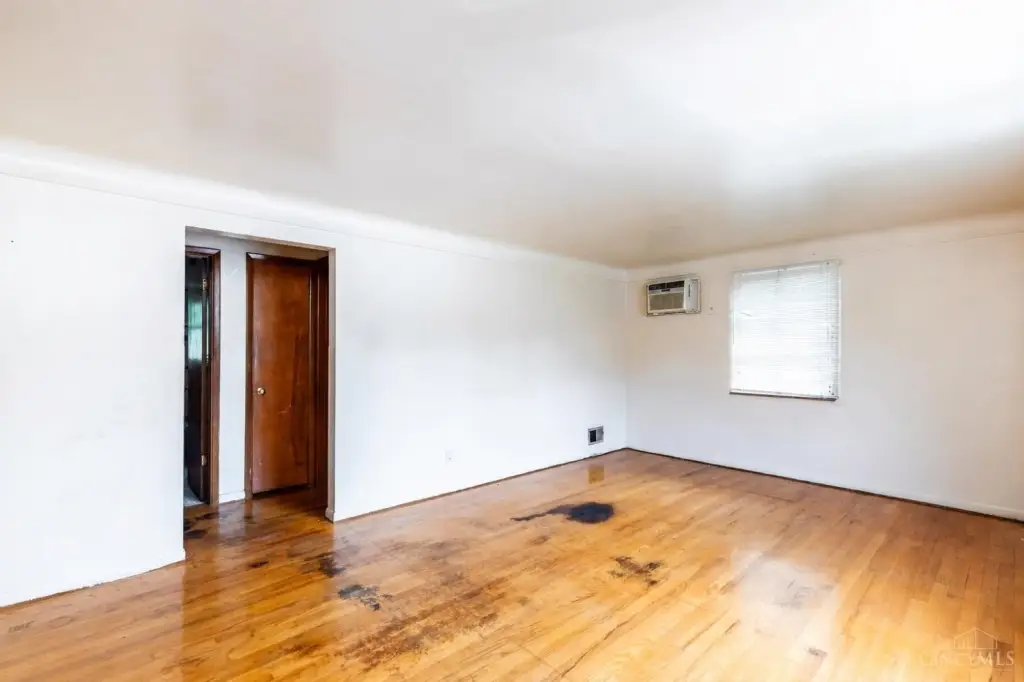
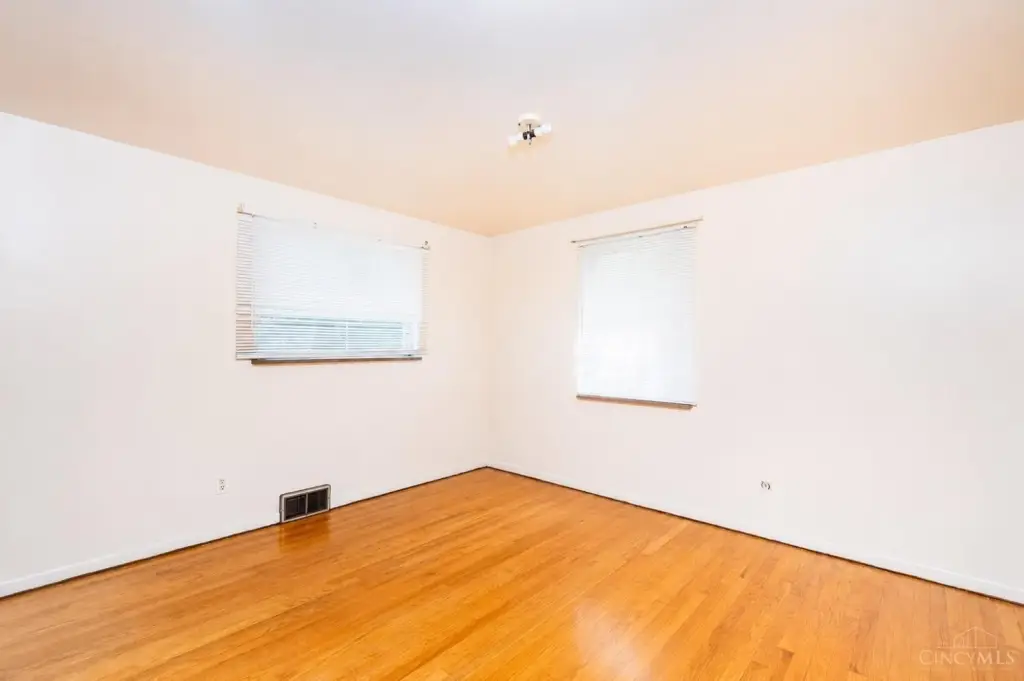
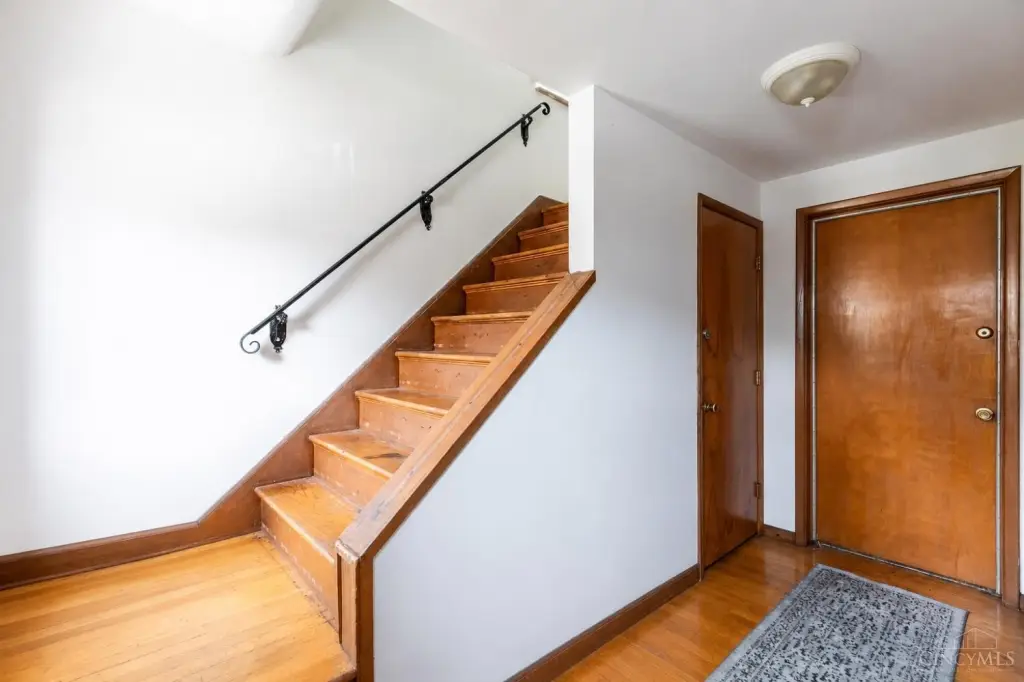
hardwood floors
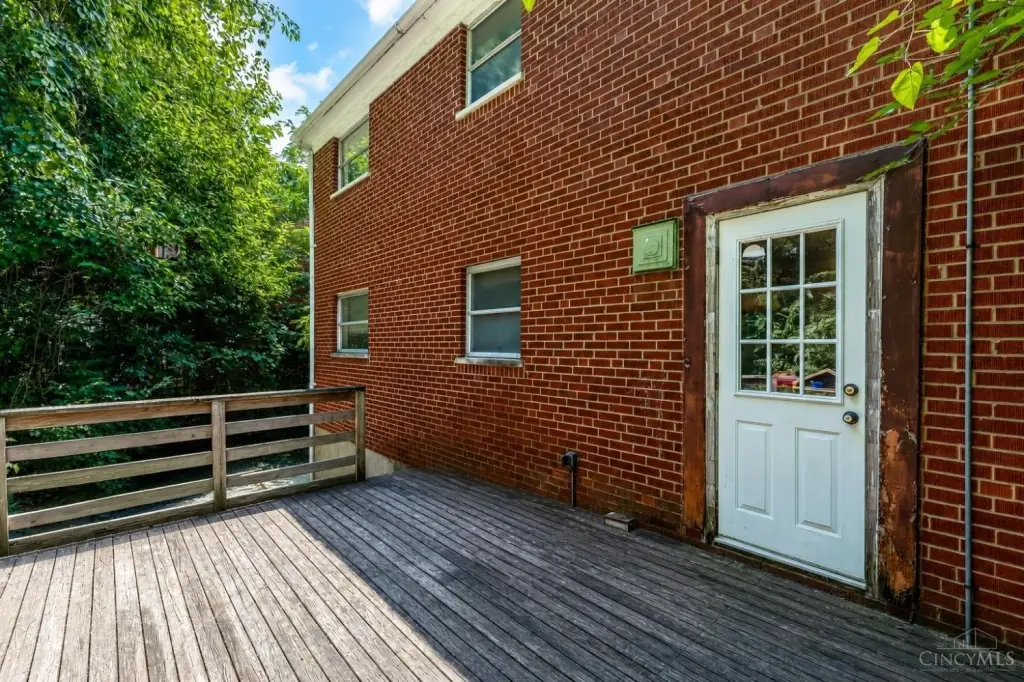
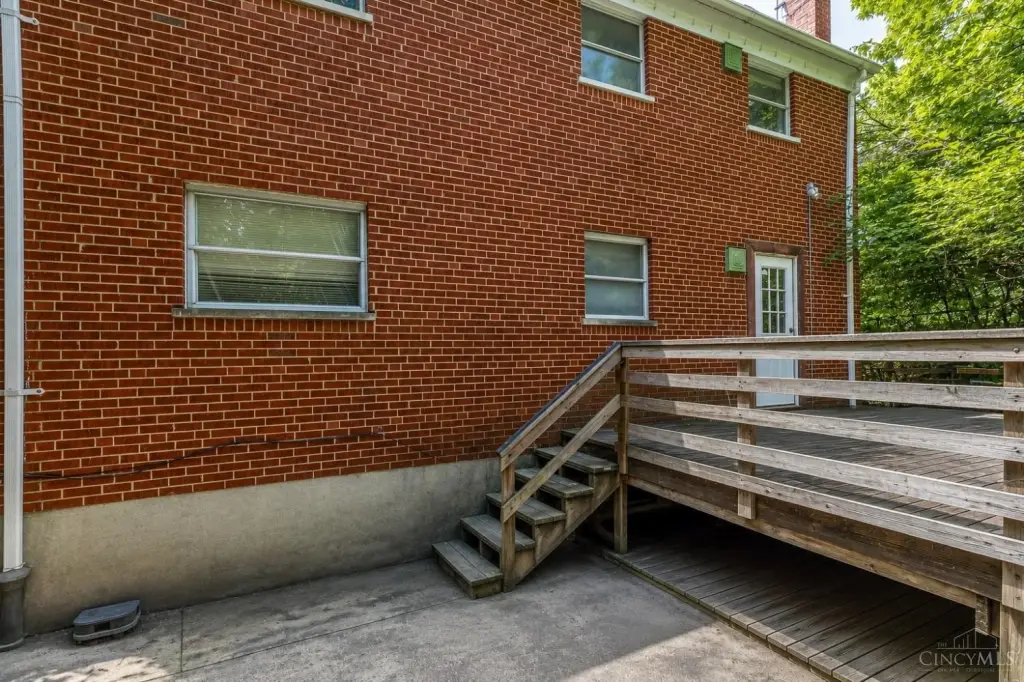
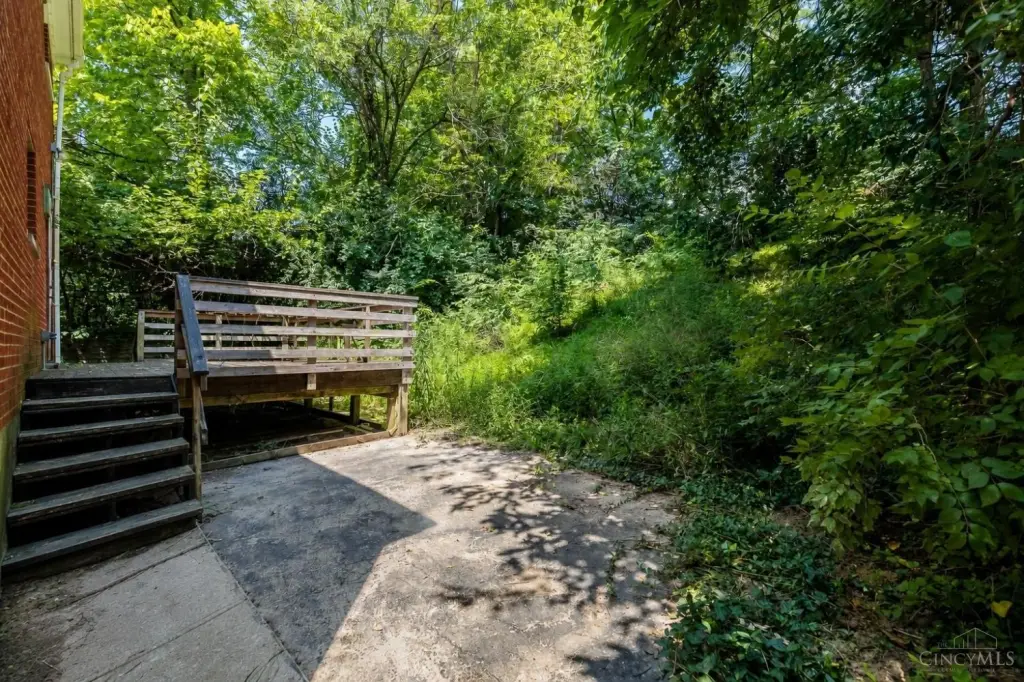
backyard deck
Building Details
Year built
1961
Number of units
2
Building materials
Brick
Roof type
Shingle
Listing Agency:
Keller Williams Advisors · Keller Williams Realty
Listed By:
Austin Long
(513) 766-9200
Added: Jul 23
Changed: Oct 16
Last Checked: Oct 23 at 7:06AM
MLS# 1887743
Copyright © 2026 MLS of Greater Cincinnati, Inc. All rights reserved. All information provided by the listing agent/broker is deemed reliable but is not guaranteed and should be independently verified.

Ask AI about this property
Review the available facts, identify missing information and prepare questions for the agent.
Investment Insights
Based on property information with market context.
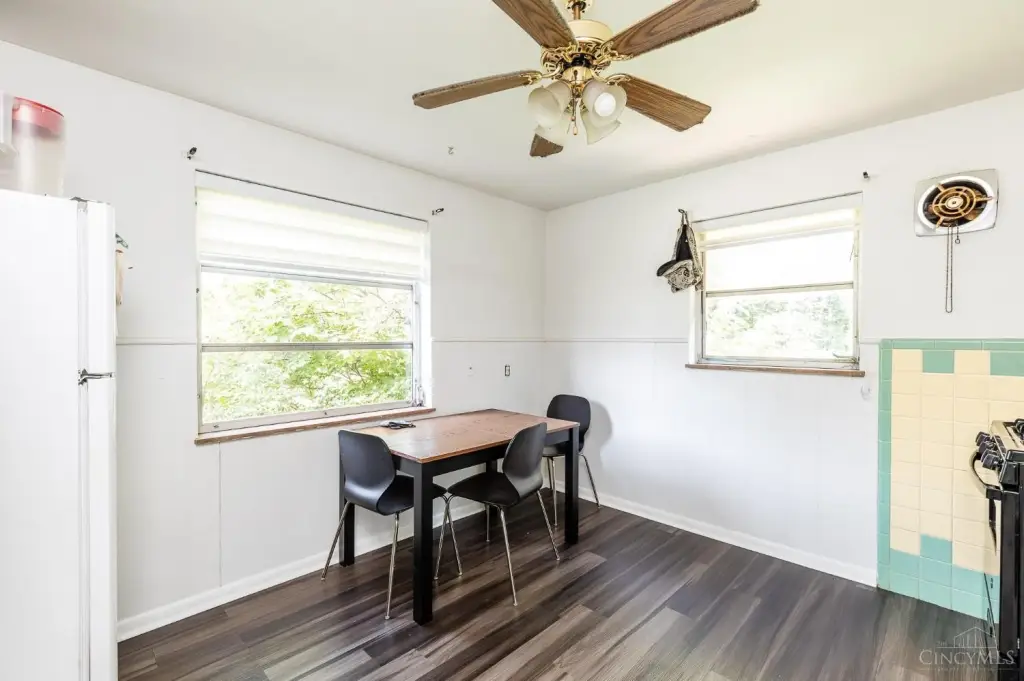
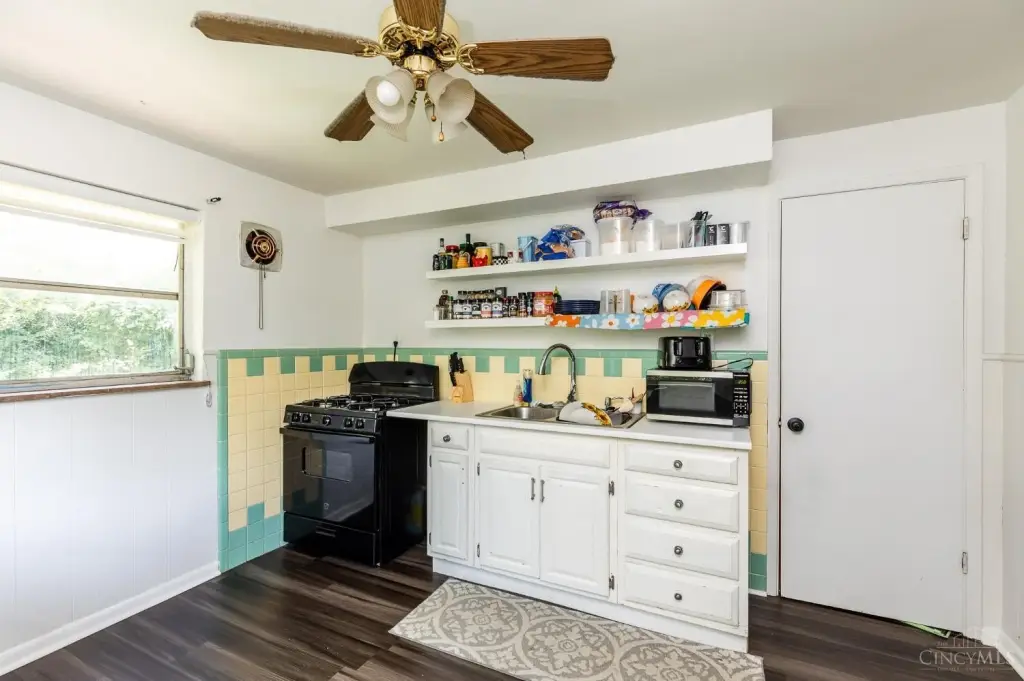
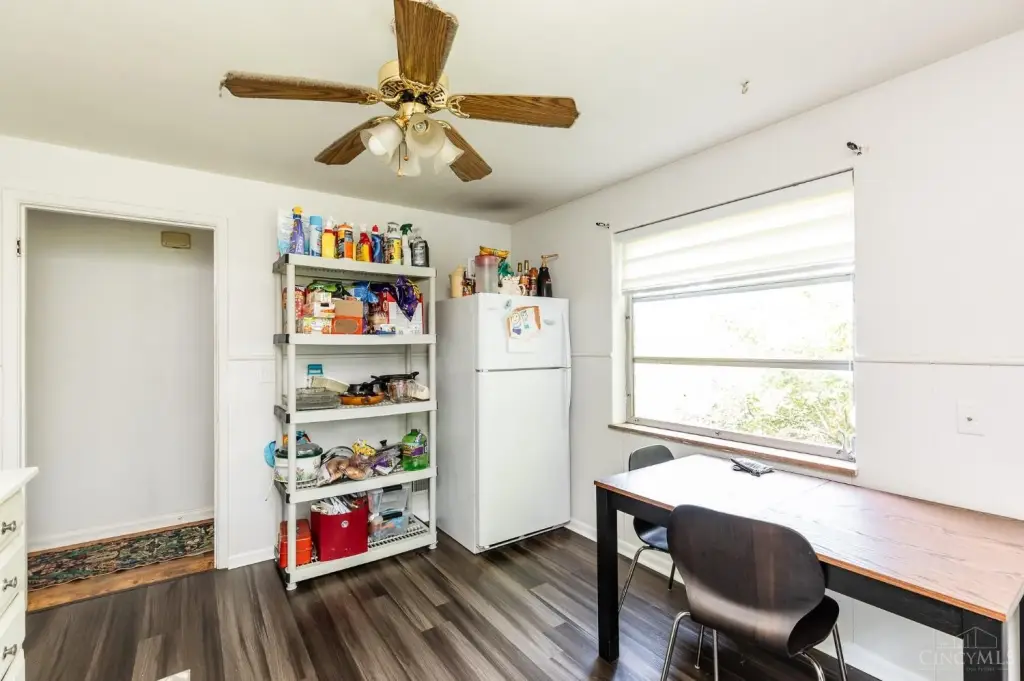
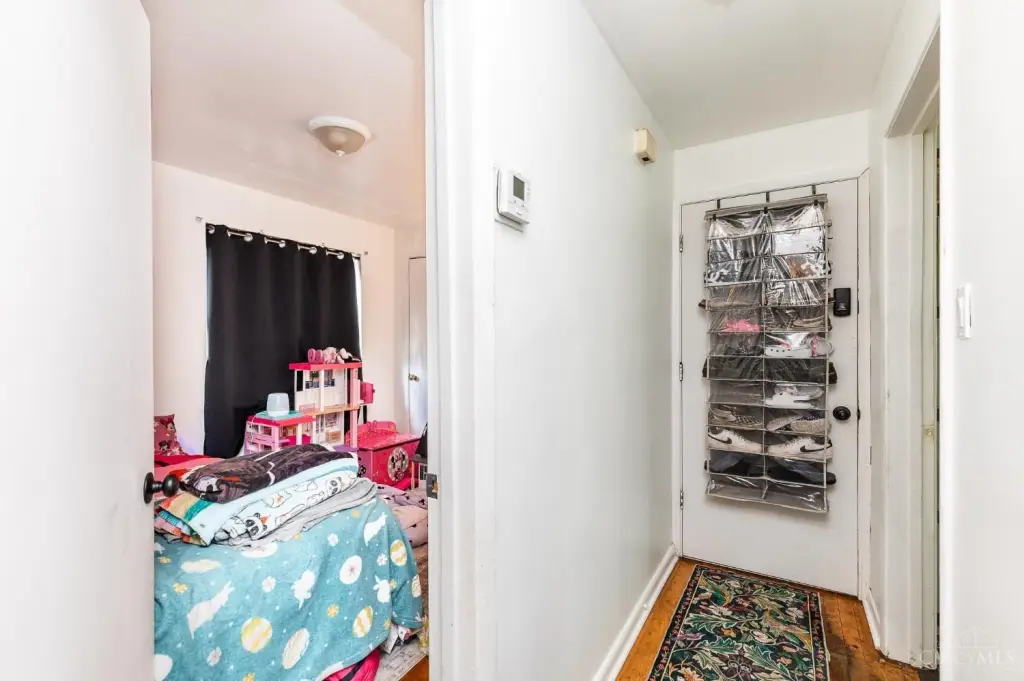
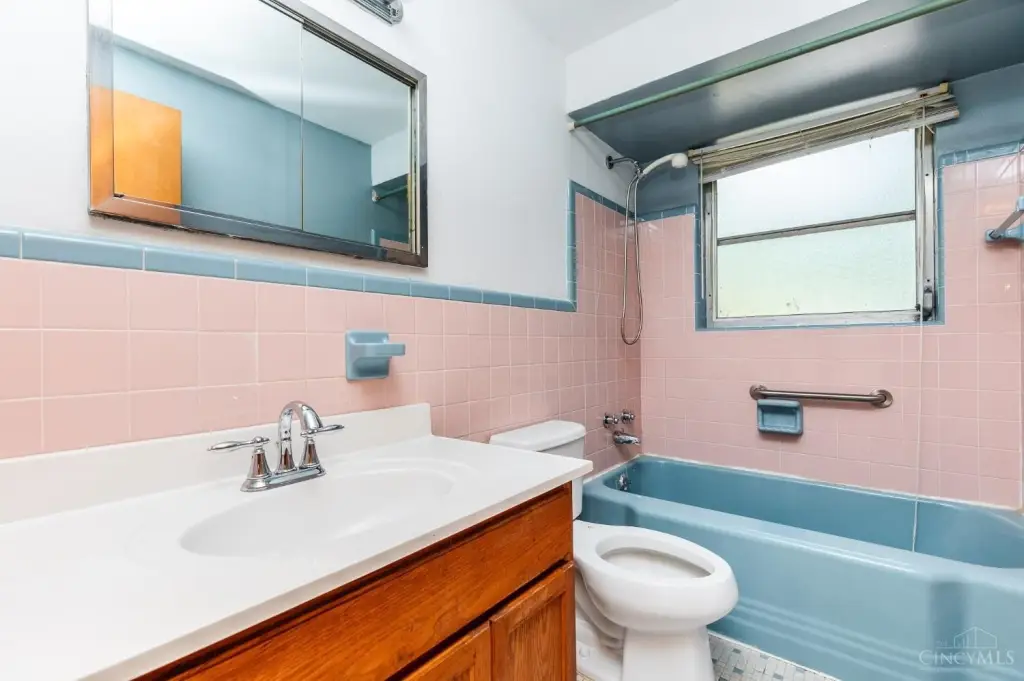
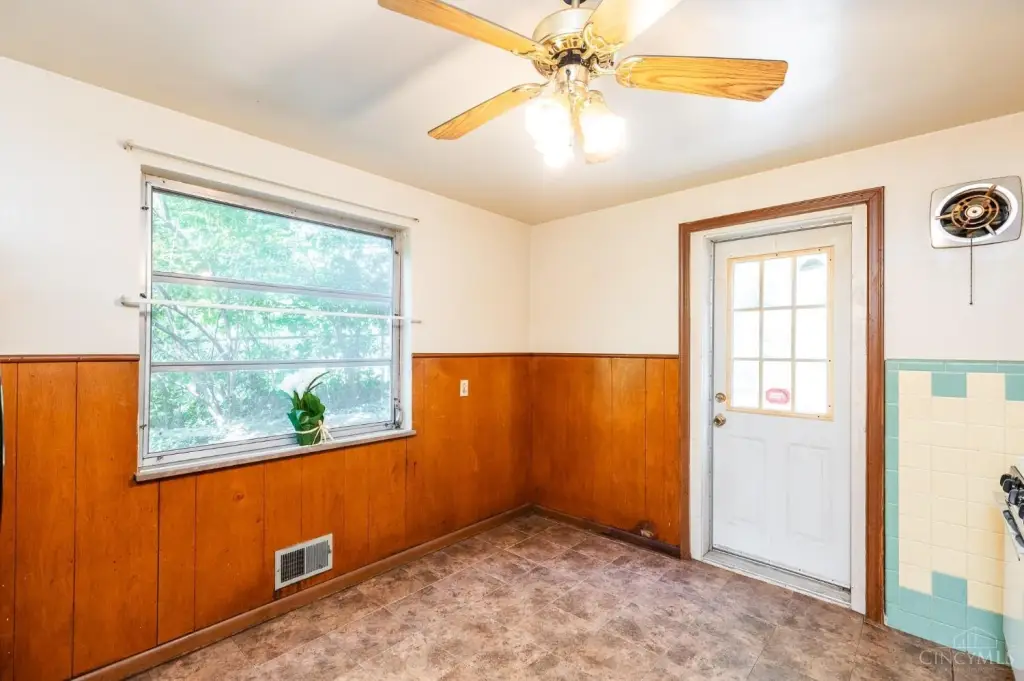
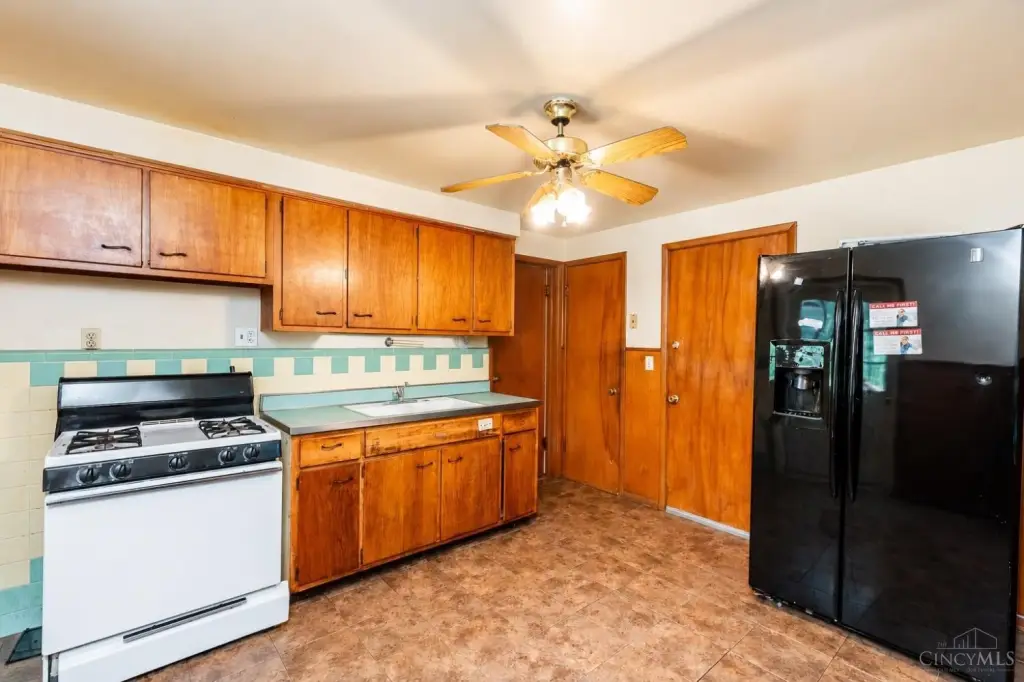
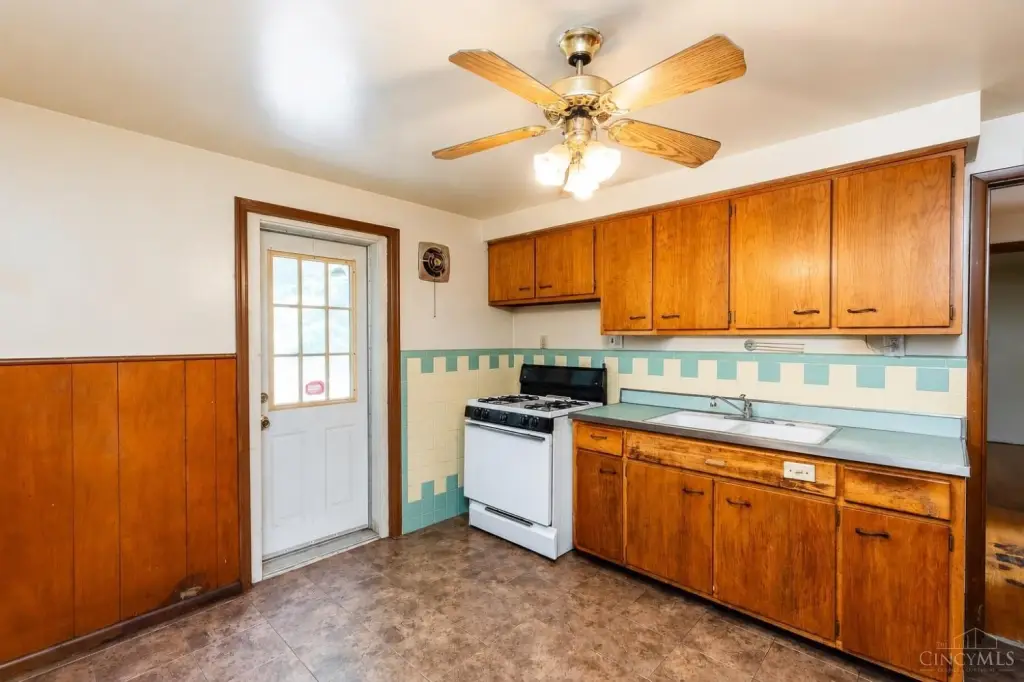
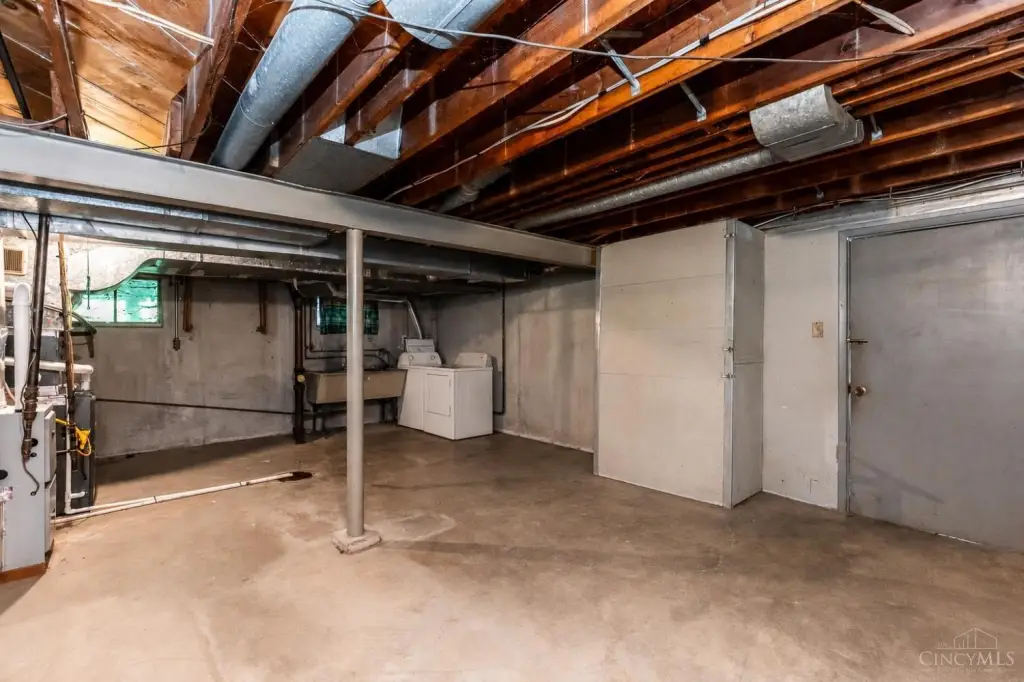
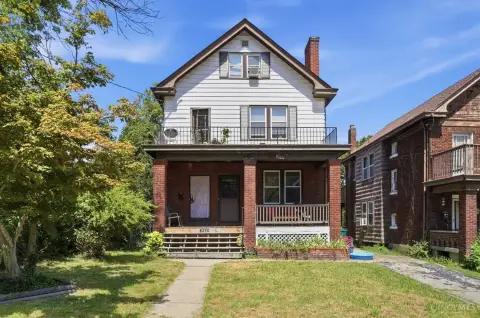
This brick duplex contains 1,664 square feet on a 0.144-acre lot and was built in 1961. The upper apartment is leased at market rent, while the first-floor residence is vacant and features hardwood flooring throughout. A backyard deck provides additional outdoor space, and the property includes forced-air heating and a shingle roof.
Parking is available through the driveway, garage, and off-street spaces. The property is approximately a 5-minute drive from downtown Cincinnati and is located at 3422 Bassett Road in Cincinnati, Ohio 45205. The two-unit configuration offers both existing occupancy and a vacant residence within the same building.
Parking is available through the driveway, garage, and off-street spaces. The property is approximately a 5-minute drive from downtown Cincinnati and is located at 3422 Bassett Road in Cincinnati, Ohio 45205. The two-unit configuration offers both existing occupancy and a vacant residence within the same building.
Key Highlights
- Two‑unit duplex with 1,664 square feet of building area
- 0.144‑acre lot at 3422 Bassett Road, Cincinnati, OH 45205
- Upper unit leased at market rent; first‑floor unit is vacant
Financial Insights
Estimated NOI and Cap Rate
NOI / Yr
$13,942
Cap Rate
7.54%
Suggested Prices Based on Cap Rates
Cap Rate 5%
$278,840
$278.8K
Cap Rate 7%
$199,171
$199.2K
Cap Rate 9%
$154,911
$154.9K
Market Conditions
NOI Build-Up for 1,664 SF
Gross rent
$21.2K $12.72/SF
− Vacancy
−$1.2K −$0.75/SF
EGI
$19.9K $11.97/SF
− OpEx
−$6.0K −$3.59/SF
NOI
$13.9K $8.38/SF
Area
Cincinnati, OH
Vacancy
5.90%
Lease Rate
$12.72 /SF/Yr
Expense Ratio
30.00%
Simulate Cap Rate and NOI
Suggested Prices Based on Cap Rates
Cap Rate 5%
$278,840
Cap Rate 7%
$199,171
Cap Rate 9%
$154,911
Alternative Uses
Best Use
Multifamily LT 5
$199.2K
$174.3K – $232.4K
NOI $13,942 @ 7.0% cap · market cap 7.54%
Second Best
Apartment 5plus
$176.6K
$154.5K – $206.1K
NOI $12,363 @ 7.0% cap · market cap 6.68%
Theoretical Best
Office A
$330.8K
$289.4K – $385.9K
NOI $23,155 @ 7.0% cap · market cap 12.52%
Zoning and permitted uses should be independently verified with authorities.
How Realmo checks its estimates
Property Analytics
Contact the owner directly
Get the owner's phone numbers and email
Open Analytics
Lease Details
2
Residential units
Location Intelligence
Trade Area within ½ mile
232
Businesses Nearby
Explore this area
Business Placement
Demographics for 45205, OH
19,517
Population
7,874
Households
2.5
Avg Household Size
31
Median Age
17%
College-Educated
82%
High-School Grad
2.8 sq mi
ZIP Area
6,970
Density / Sq Mi
$41,357
Median Household Income
$32,537
Median Earnings
$855
Median Rent
$112,600
Median Home Value
Check the figures for this property
Cap Rate, Value Estimation, Potential NOI and more
View Realmo Analytics
Market
Vacancy Rate% for Multifamily in Midwest region







Frequently Asked Questions
What type of property is this?
Duplex - Separate upstairs and first-floor units include established rental occupancy, hardwood flooring, and outdoor space.
Where is this duplex located?
The property is located at 3422 Bassett Road Cincinnati, OH.
What is the asking price?
The asking price for this property is $185,000.
What are key features of this property?
This property features: Two‑unit duplex with 1,664 square feet of building area; 0.144‑acre lot at 3422 Bassett Road, Cincinnati, OH 45205; Upper unit leased at market rent; first‑floor unit is vacant


