Standalone Retail Building with Marquee
For Sale
$1,775,000
340 E 1200 S, Orem, UT 84058
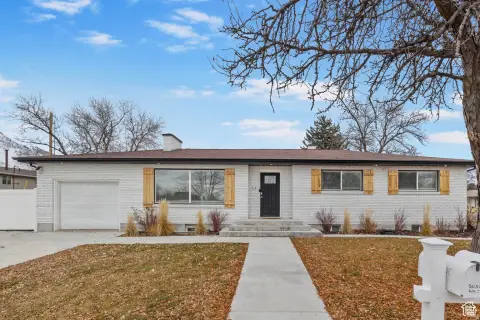
Flexible two-level standalone building near State Street/University Parkway with designated parking and prominent marquee signage.
Property Size6,124 SF
Price / SF$295.83
Days on Market141
Property Features for 340 E 1200 S
General Information
Standard status
Active
Size
6,124 SF
Property subtype
Retail
Building Details
Building Size
6,124 SF
Year Built
1970
Stories
2
Listing Agency:
Century 21 Everest
(435) 705-1279
Listed By:
Tim Long
(801) 449-3000
Source:
Liftrealty
Added: May 19
Changed: Oct 6
Last Checked: Oct 5 at 7:11PM
Displayed information is deemed reliable but is not guaranteed and should be independently verified. All listing content including descriptions, pricing, images are the copyrighted material of Century 21 Everest
Investment Insights
Based on property information with market context.
This standalone commercial building offers approximately 6,000 SF of flexible space spread across two levels, with roughly 3,000 SF on the main level and an additional 3,000 SF on the lower level. The property is suitable for a range of commercial uses, including restaurant, retail, office, medical, or an owner-user setup. Designated parking is included, and the building features prominent marquee signage intended to support visibility from the surrounding roadway network. FF&E is negotiable, and the seller requests that the current restaurant not be disturbed; contact the agent for details to access the property. Square footage is provided as a courtesy estimate only and buyers are advised to verify measurements independently.
The property is located in Orem near the intersection of State Street and University Parkway, positioned within a highly visible commercial corridor. The offering emphasizes convenient access from major thoroughfares and proximity to established businesses, including national retailers and restaurants.
For tenants and buyers looking for adaptable space, the two-level configuration can support a variety of operational layouts depending on the intended use. The combination of designated parking and marquee signage provides practical storefront presence for retail and service concepts, while the building’s flexibility also supports office or medical configurations where a standalone footprint is desired.
The property is located in Orem near the intersection of State Street and University Parkway, positioned within a highly visible commercial corridor. The offering emphasizes convenient access from major thoroughfares and proximity to established businesses, including national retailers and restaurants.
For tenants and buyers looking for adaptable space, the two-level configuration can support a variety of operational layouts depending on the intended use. The combination of designated parking and marquee signage provides practical storefront presence for retail and service concepts, while the building’s flexibility also supports office or medical configurations where a standalone footprint is desired.
Key Highlights
- 6,000 SF standalone commercial building (approx. 3,000 SF main level and 3,000 SF lower level) built in 1970
- Flexible two‑level layout suited for restaurant, retail, office, medical, or owner‑user uses
- Designated parking included
Financial Insights
Estimated NOI and Cap Rate
NOI / Yr
$107,603
Cap Rate
6.06%
Suggested Prices Based on Cap Rates
Cap Rate 5%
$2,152,060
$2.2M
Cap Rate 7%
$1,537,186
$1.5M
Cap Rate 9%
$1,195,589
$1.2M
Market Conditions
NOI Build-Up for 6,000 SF
Gross rent
$149.8K $24.96/SF
− Vacancy
−$6.3K −$1.05/SF
EGI
$143.5K $23.91/SF
− OpEx
−$35.9K −$5.98/SF
NOI
$107.6K $17.93/SF
Area
Utah County, UT
Vacancy
4.20%
Lease Rate
$24.96 /SF/Yr
Expense Ratio
25.00%
Simulate Cap Rate and NOI
Suggested Prices Based on Cap Rates
Cap Rate 5%
$2,152,060
Cap Rate 7%
$1,537,186
Cap Rate 9%
$1,195,589
Alternative Uses
Best Use
Specialty Retail
$1.54M
$1.35M – $1.79M
NOI $107,603 @ 7.0% cap · market cap 6.06%
Second Best
—
—
no second resolved use
Theoretical Best
Office A
$1.65M
$1.45M – $1.93M
NOI $115,776 @ 7.0% cap · market cap 6.52%
Zoning and permitted uses should be independently verified with authorities.
Property Analytics
Unlock full access to Insights
Subscribe to Realmo Intelligence
Open Analytics
Current Use
Location Intelligence
Trade Area within ½ mile
2,161
Businesses Nearby
549k
Monthly Visits Nearby
Under-served
Demand for This Use
Explore this area
Business Placement
Foot Traffic Nearby
Shops & Services 32%
Superstores 27%
Dining 27%
Electronics 5%
Costco Wholesale
Superstores
149,177 visits/mo
0.4 miles
Texas Roadhouse
Dining
32,813 visits/mo
0.2 miles
Best Buy
Electronics
27,616 visits/mo
0.1 miles
Michaels
Shops & Services
25,306 visits/mo
0.4 miles
Jo-Ann Fabric and Craft
Shops & Services
24,203 visits/mo
0.4 miles
Demographics for 84058, UT
33,734
Population
11,749
Households
2.9
Avg Household Size
26
Median Age
41%
College-Educated
93%
High-School Grad
8.0 sq mi
ZIP Area
4,217
Density / Sq Mi
$71,474
Median Household Income
$27,325
Median Earnings
$1,395
Median Rent
$441,900
Median Home Value
Check the figures for this property
Cap Rate, Value Estimation, Potential NOI and more
View Realmo Analytics
Market
Vacancy Rate% for Retail in West region

Questions? Ask Rey
Realmo’s AI knows this listing — price, zoning, demand, history. Ask anything.







Frequently Asked Questions
What type of property is this?
Conventional restaurant - Flexible two-level standalone building near State Street/University Parkway with designated parking and prominent marquee signage.
Where is this conventional restaurant located?
The property is located at 340 E 1200 S Orem, UT.
What is the asking price?
The asking price for this property is $1,775,000.
What are key features of this property?
This property features: 6,000 SF standalone commercial building (approx. 3,000 SF main level and 3,000 SF lower level) built in 1970; Flexible two‑level layout suited for restaurant, retail, office, medical, or owner‑user uses; Designated parking included


