Multi-Tenant Retail
For Sale
Contact for pricing
34 Leonardville Road, Middletown, NJ 07748
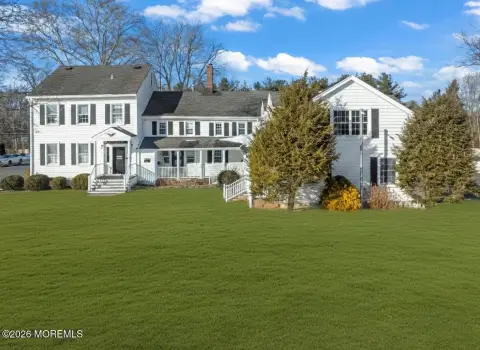
Well-maintained 1980-built plaza with a 4,669-sf retail building and seven tenants, fully leased.
Property Size4,780 SF
Lot Size0.88 Acres
Price / SF$329.50
Days on Market164
Property Features for 34 Leonardville Road
General Information
Standard status
Active
Size
4,780 SF
Lot size
0.88 Acres
Property subtype
Retail
Occupancy
100%
Lease Type
Modified Gross
Net Operating Income
$115,075
Site & Location
Highway Access
Yes
Road Access
Yes
Building Details
Year Built
1956
Buildings
1
Stories
1
Tenancy
Multi
Listing Agency:
Horvath & Tremblay
Listed By:
Michael Lombardi · License #0569706
(201) 215-1801
Source:
Crexi
Added: May 12
Changed: Oct 20
Last Checked: Oct 20 at 9:14PM
Displayed information is deemed reliable but is not guaranteed and should be independently verified. All listing content including descriptions, pricing, images are the copyrighted material of Horvath & Tremblay

Ask AI about this property
Review the available facts, identify missing information and prepare questions for the agent.
Investment Insights
Based on property information with market context.
Horvath & Tremblay is pleased to offer an exclusive purchase opportunity for a multi-tenant retail center in Middletown Township, New Jersey. The well-maintained plaza was constructed in 1980 and is improved by a 4,669-square-foot retail building situated on 0.88 acres across two parcels. The property is 100% leased to seven tenants.
The retail center is positioned along Leonardville Road with frontage and visibility just moments from the commercial node at the intersection with Main Street. It sits between NJ Route 35 and NJ Route 36, supporting convenient access within an established trade area. The surrounding area includes densely populated residential neighborhoods and nearby schools, and the remarks also cite a mix of national retailers and restaurants contributing to steady traffic.
The site is described as offering strong regional connectivity through NJ Route 35, NJ Route 36, the Garden State Parkway, Middletown Train Station, and the Seastreak Ferry Terminal, providing access throughout the region and to New York City, approximately 25 miles to the north.
The retail center is positioned along Leonardville Road with frontage and visibility just moments from the commercial node at the intersection with Main Street. It sits between NJ Route 35 and NJ Route 36, supporting convenient access within an established trade area. The surrounding area includes densely populated residential neighborhoods and nearby schools, and the remarks also cite a mix of national retailers and restaurants contributing to steady traffic.
The site is described as offering strong regional connectivity through NJ Route 35, NJ Route 36, the Garden State Parkway, Middletown Train Station, and the Seastreak Ferry Terminal, providing access throughout the region and to New York City, approximately 25 miles to the north.
Key Highlights
- Multi‑tenant retail center at 34 Leonardville Road, Middletown Township, NJ
- Well‑maintained plaza constructed in 1980 with 4,669 SF retail building on 0.88 acres across two parcels
- 100% leased to seven (7) tenants
Financial Insights
Estimated NOI and Cap Rate
NOI / Yr
$68,226
Cap Rate
4.33%
Suggested Prices Based on Cap Rates
Cap Rate 5%
$1,364,520
$1.4M
Cap Rate 7%
$974,657
$974.7K
Cap Rate 9%
$758,067
$758.1K
Market Conditions
NOI Build-Up for 4,780 SF
Gross rent
$103.2K $21.60/SF
− Vacancy
−$5.8K −$1.21/SF
EGI
$97.5K $20.39/SF
− OpEx
−$29.2K −$6.12/SF
NOI
$68.2K $14.27/SF
Area
Monmouth County, NJ
Vacancy
5.60%
Lease Rate
$21.60 /SF/Yr
Expense Ratio
30.00%
Simulate Cap Rate and NOI
Suggested Prices Based on Cap Rates
Cap Rate 5%
$1,364,520
Cap Rate 7%
$974,657
Cap Rate 9%
$758,067
Alternative Uses
Best Use
Retail
$974.7K
$852.8K – $1.14M
NOI $68,226 @ 7.0% cap · market cap 4.33%
Second Best
—
—
no second resolved use
Theoretical Best
Office A
$1.25M
$1.09M – $1.46M
NOI $87,371 @ 7.0% cap · market cap 5.55%
Zoning and permitted uses should be independently verified with authorities.
How Realmo checks its estimates
Property Analytics
Who owns this building?
See the owner, sales and loan history
Open Analytics
Current Use
Lease Details
Yes
Highway access
Yes
Paved road access
Location Intelligence
Trade Area within ½ mile
418
Businesses Nearby
16k
Monthly Visits Nearby
Under-served
Demand for This Use
Explore this area
Business Placement
Foot Traffic Nearby
Dining 69%
Shops & Services 31%
Dunkin' Donuts
Dining
7,017 visits/mo
0.2 miles
7-Eleven
Shops & Services
5,171 visits/mo
0.1 miles
Carvel Ice Cream
Dining
3,250 visits/mo
0.1 miles
Valentino's
Dining
988 visits/mo
0.2 miles
Demographics for 07748, NJ
28,169
Population
10,446
Households
2.7
Avg Household Size
43
Median Age
52%
College-Educated
96%
High-School Grad
13.0 sq mi
ZIP Area
2,167
Density / Sq Mi
$152,488
Median Household Income
$72,287
Median Earnings
$1,483
Median Rent
$568,000
Median Home Value
Check the figures for this property
Cap Rate, Value Estimation, Potential NOI and more
View Realmo Analytics
Market
Vacancy Rate% for Retail in Northeast region





Frequently Asked Questions
What type of property is this?
Shopping center - Well-maintained 1980-built plaza with a 4,669-sf retail building and seven tenants, fully leased.
Where is this shopping center located?
The property is located at 34 Leonardville Road Middletown, NJ.
What is the asking price?
The asking price for this property is $1,575,000.
What are key features of this property?
This property features: Multi‑tenant retail center at 34 Leonardville Road, Middletown Township, NJ; Well‑maintained plaza constructed in 1980 with 4,669 SF retail building on 0.88 acres across two parcels; 100% leased to seven (7) tenants


