Mixed-Use Property with Medical
For Sale
$1,750,000
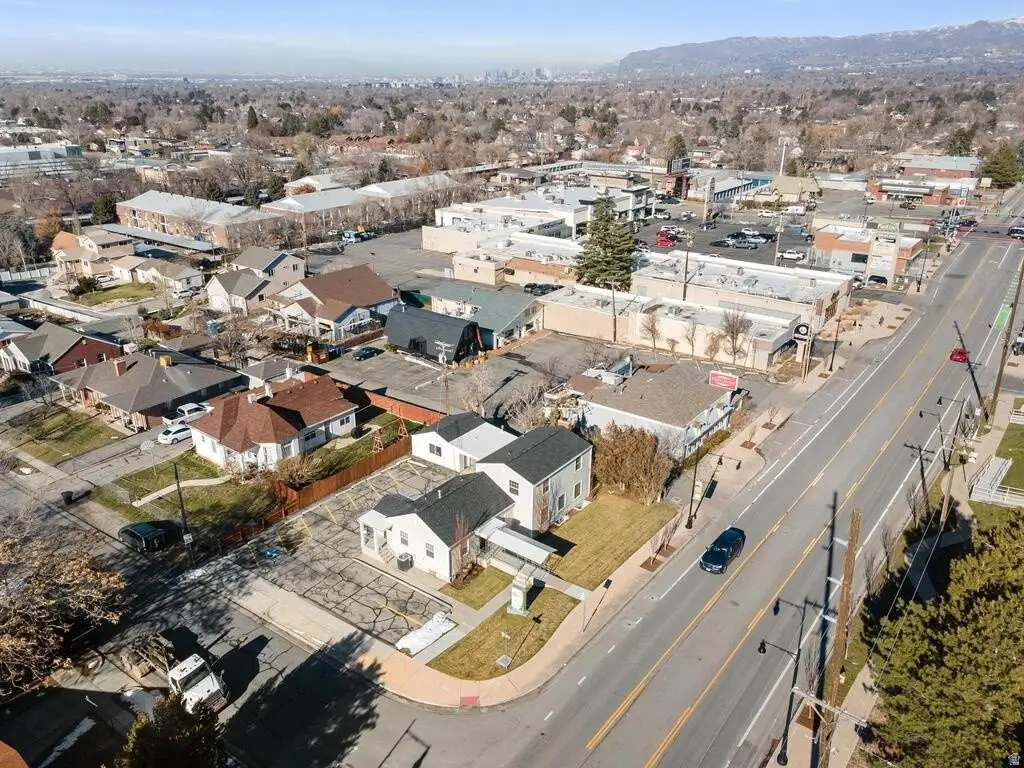
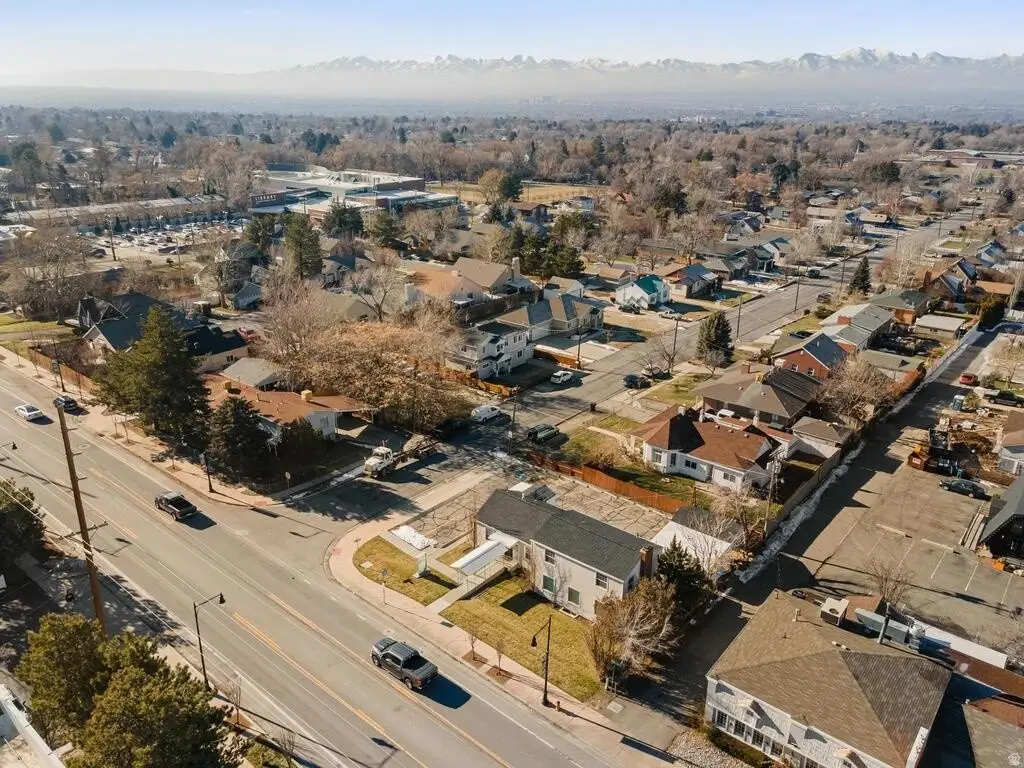
3378 S 2300 E, Millcreek, UT 84109
Commercial Sale, Millcreek, UT
Property Size3,939 SF
Lot Size0.18 Acres
Price / SF$444.28
Days on Market47
Property Features for 3378 S 2300 E
General Information
Property type
Commercial Sale
Property subtype
Office
Zoning
Commercial
Zoning description
R2-10
Interior features
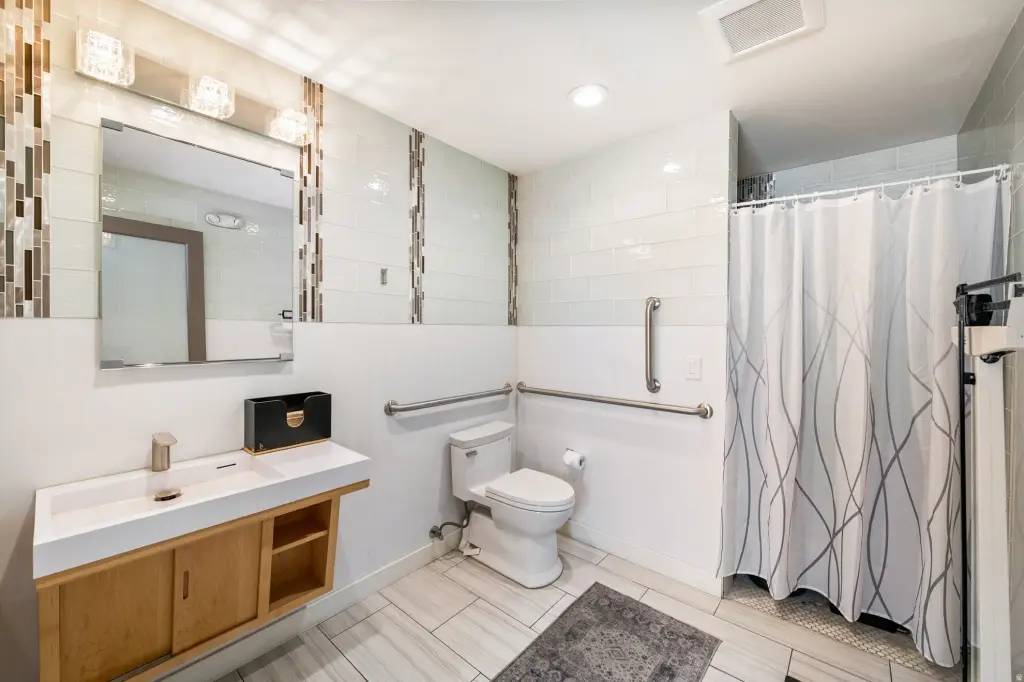
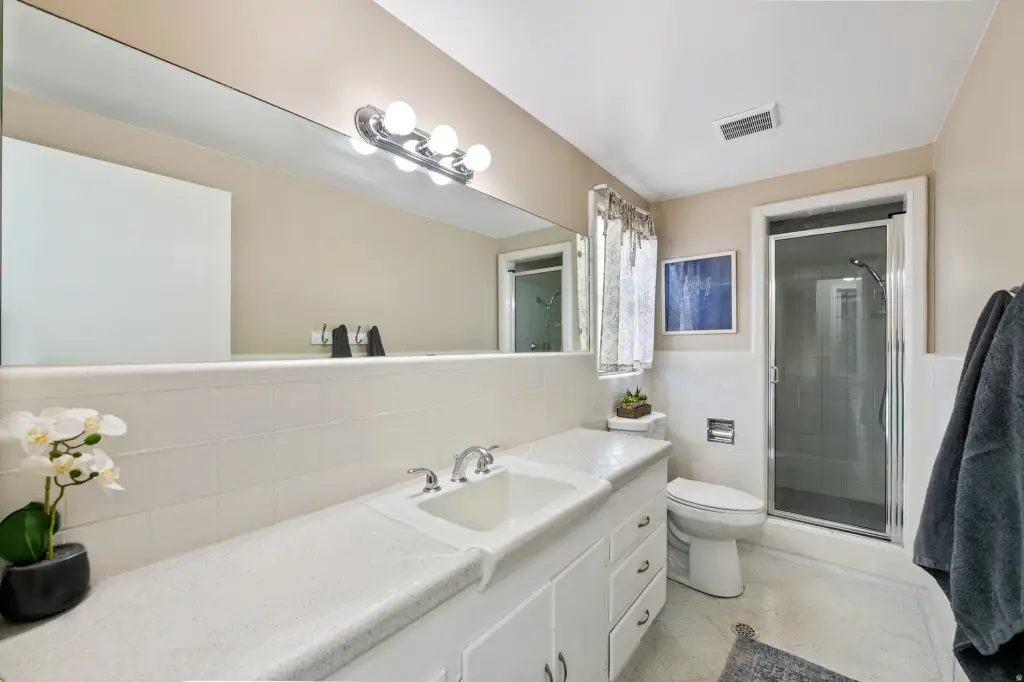
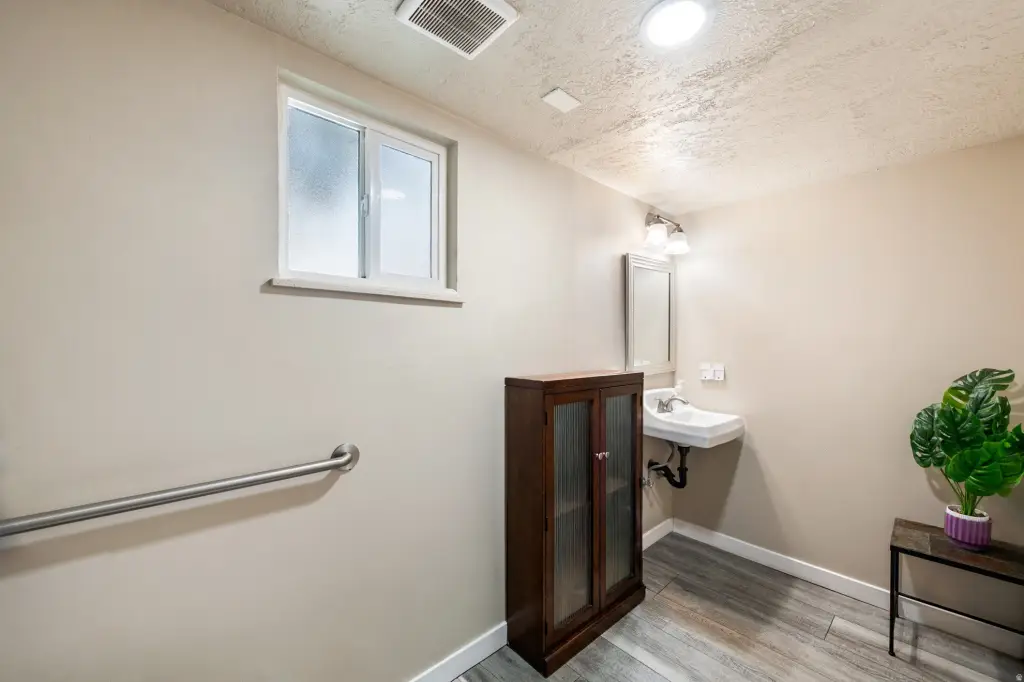
Restroom: Private
Accessibility
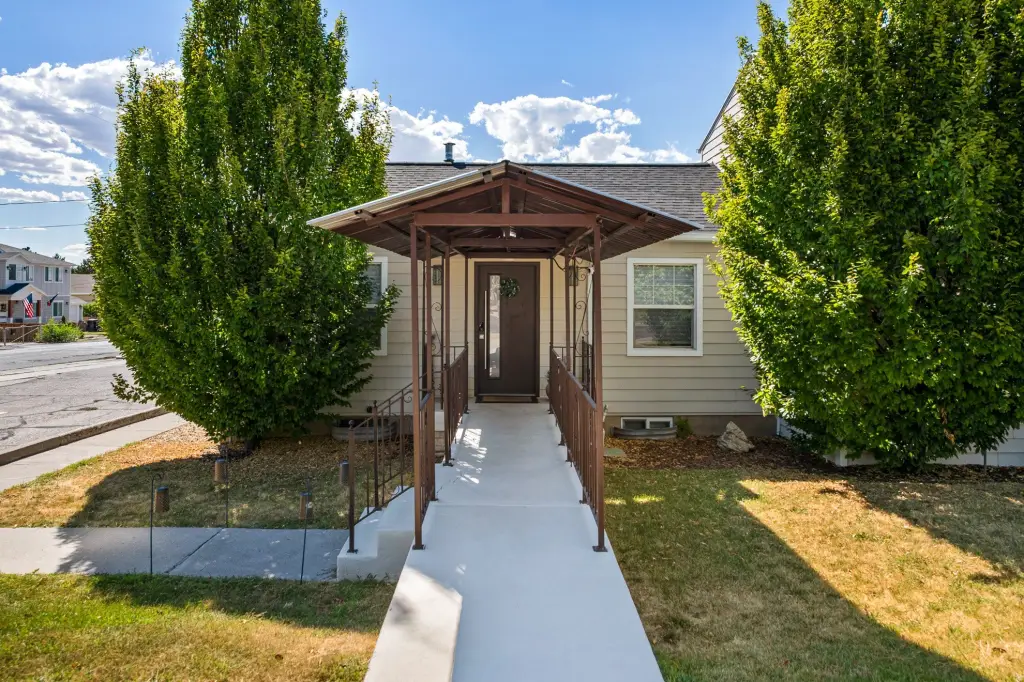
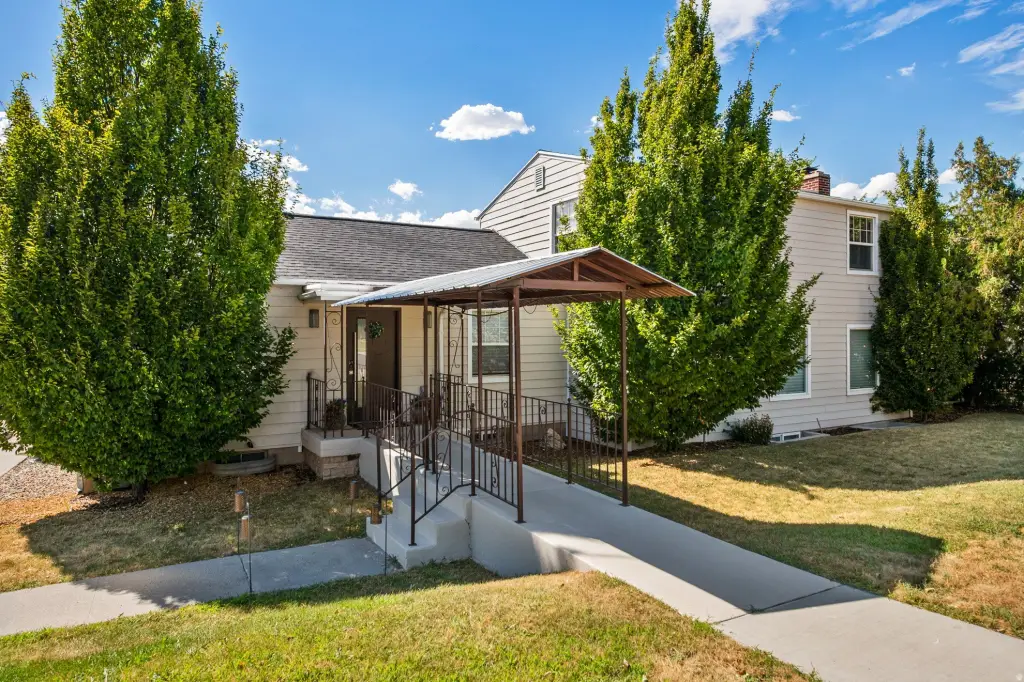
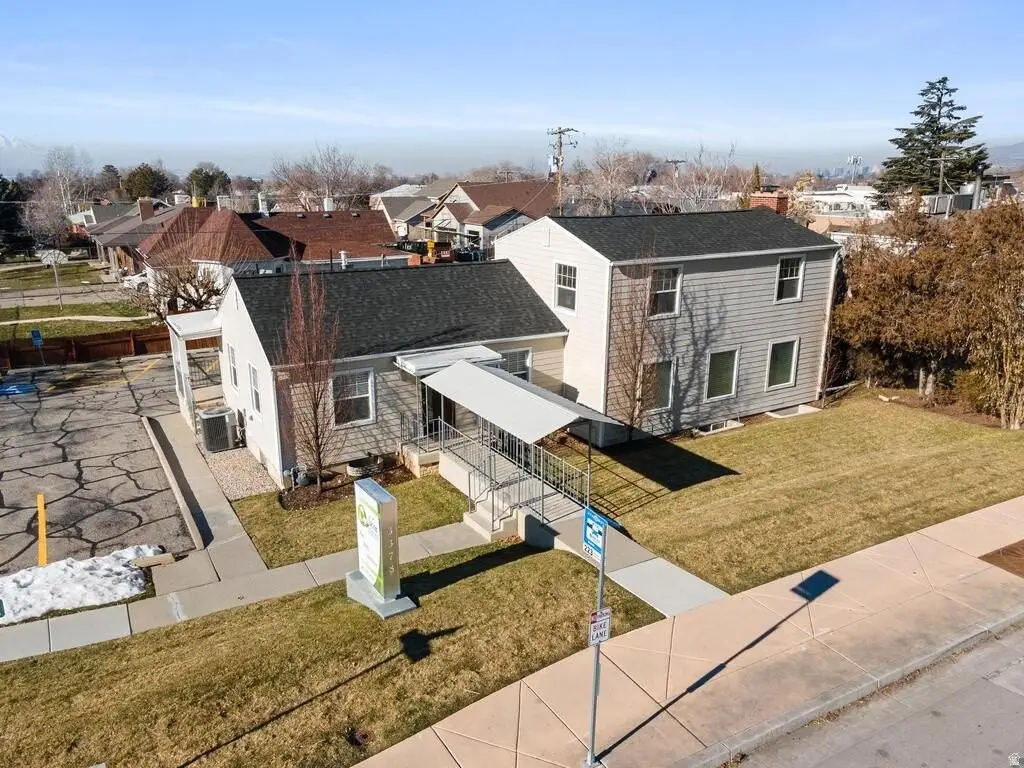
Accessible Approach with Ramp
Subdivision
Salt Lake City; Ft Douglas
Standard status
Active
APN
16-27-376-041
Lot size
0.18 Acres
Taxes and HOA fees
Tax Annual Amount
10864
Utilities
Heating system
Forced Air, Natural Gas
Cooling system
Central Air
Building Details
Year built
1945
Listing Agency:
KW South Valley Keller Williams · Keller Williams Realty
(801) 676-5700
Listed By:
Kody Watts
(801) 948-3783
Added: Sep 9
Changed: Oct 19
Last Checked: Oct 25 at 9:06PM
MLS# 2184245
Copyright © 2026 UtahRealEstate.com. All rights reserved. All information provided by the listing agent/broker is deemed reliable but is not guaranteed and should be independently verified.

Ask AI about this property
Review the available facts, identify missing information and prepare questions for the agent.
Investment Insights
Based on property information with market context.
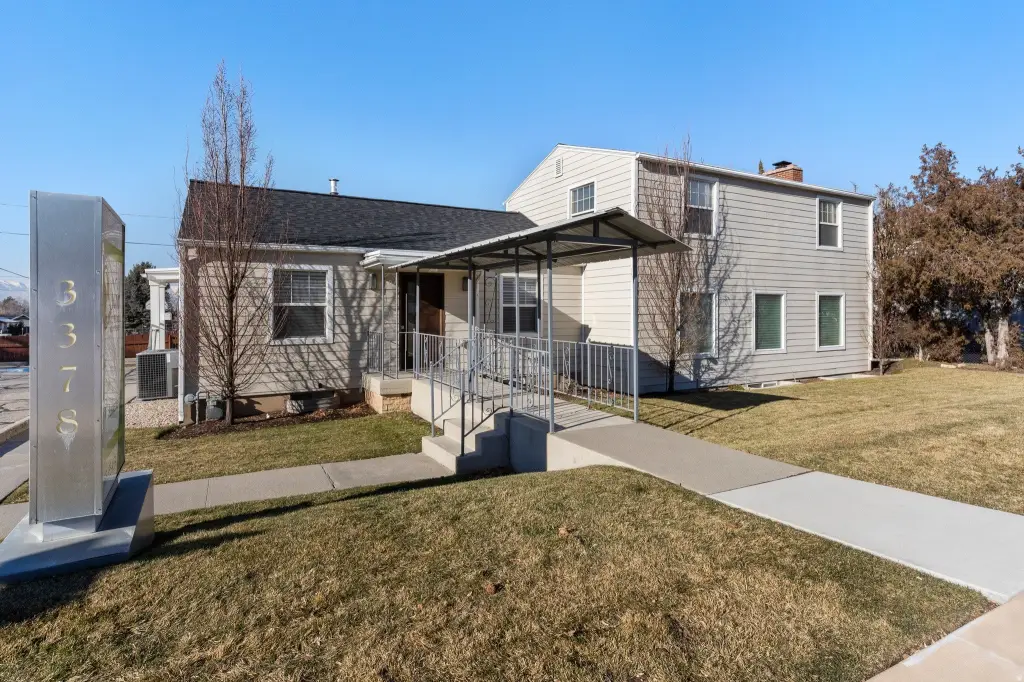
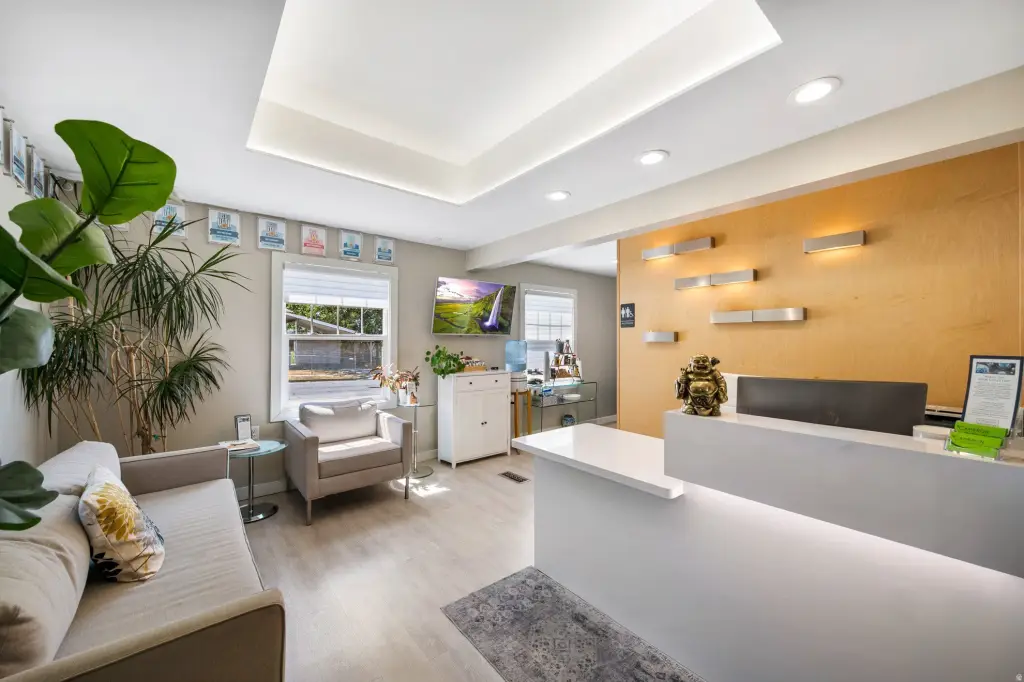
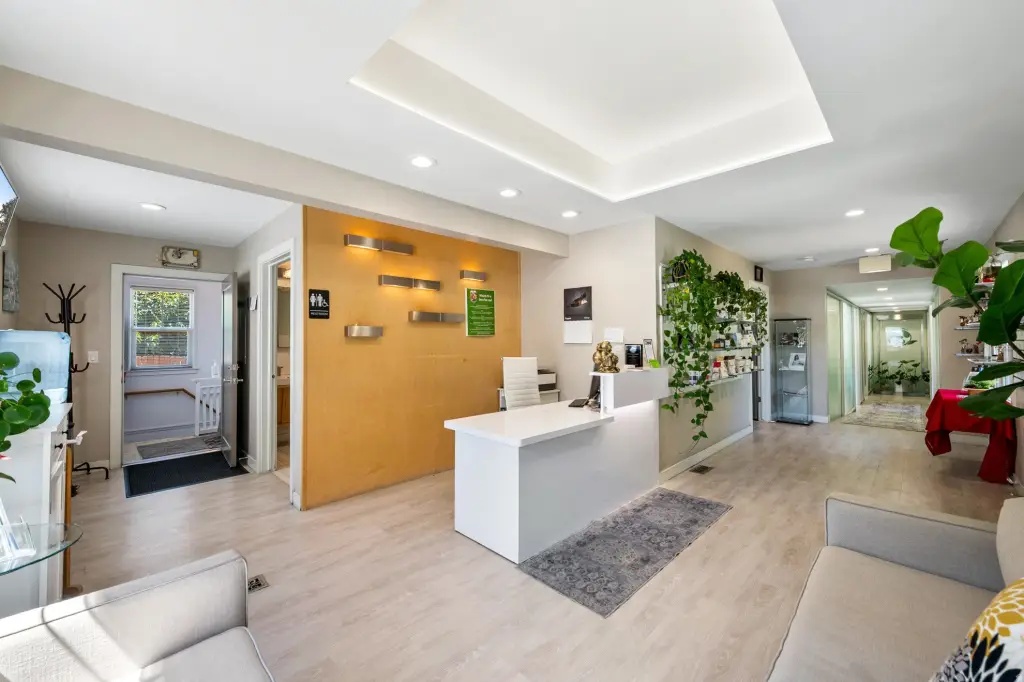
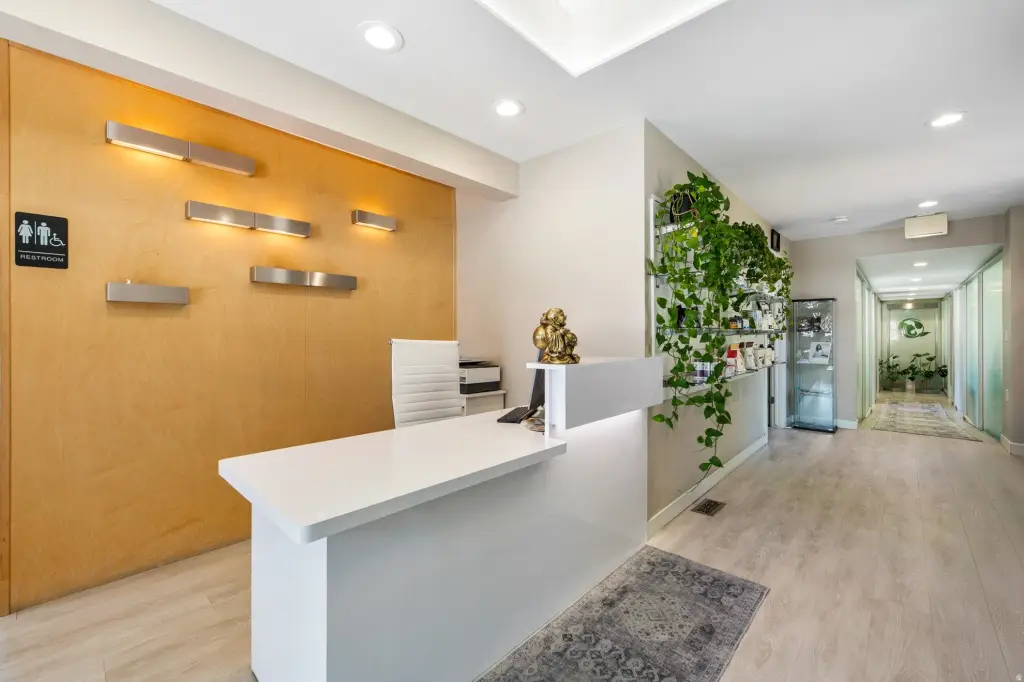
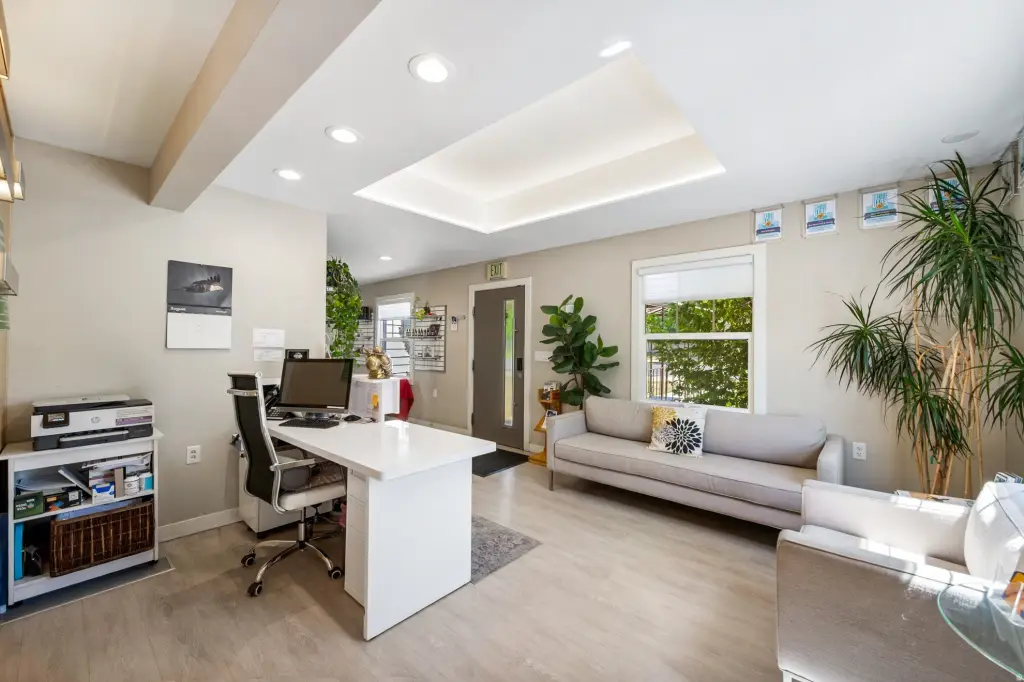
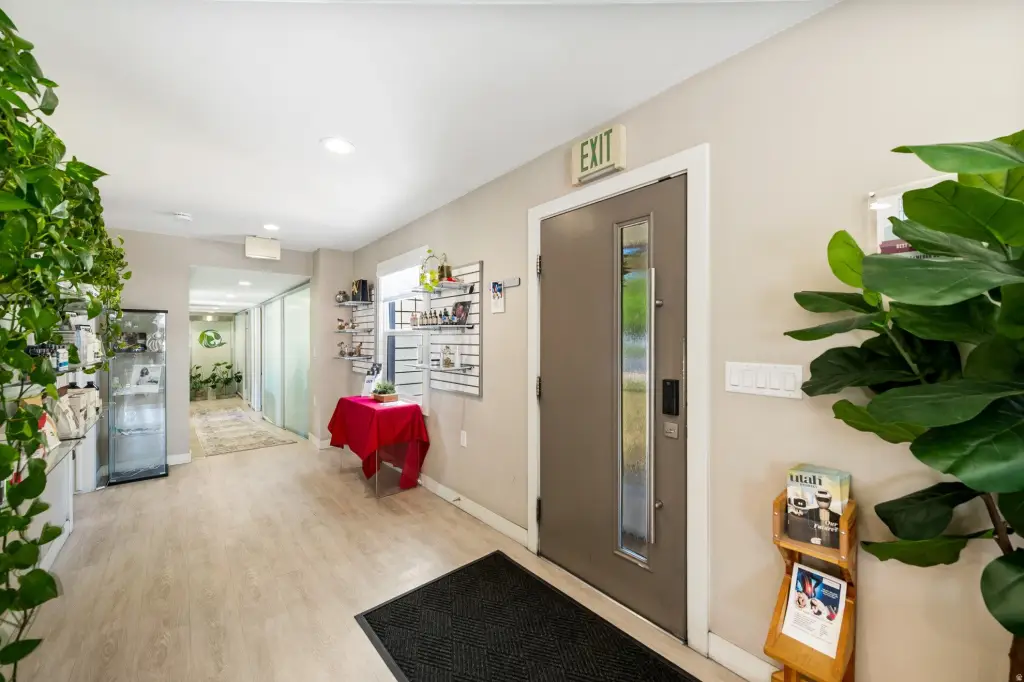
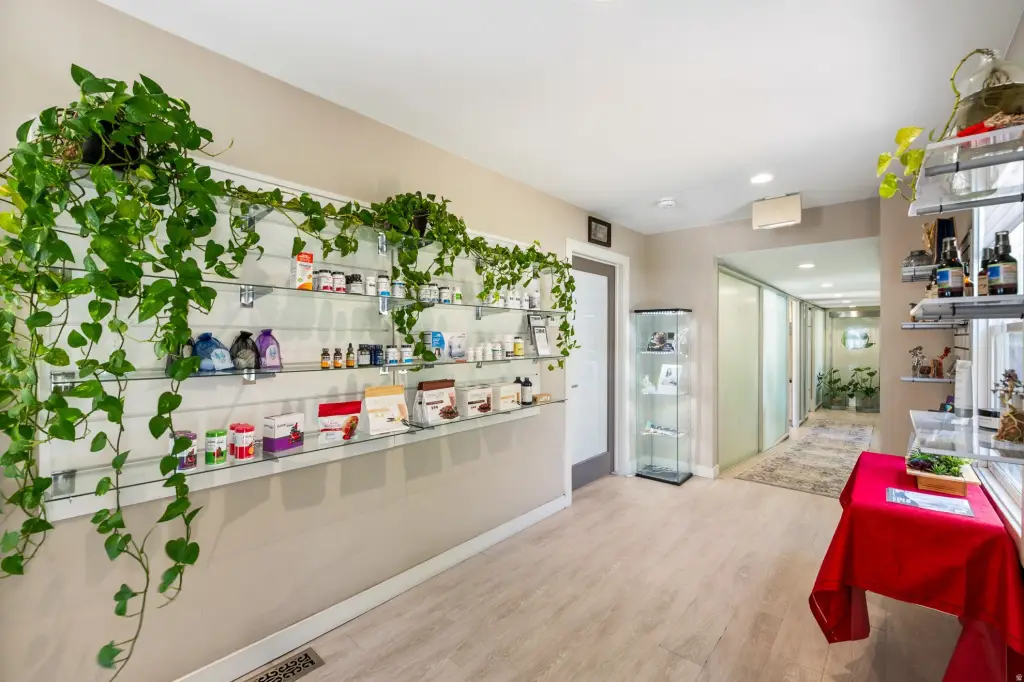
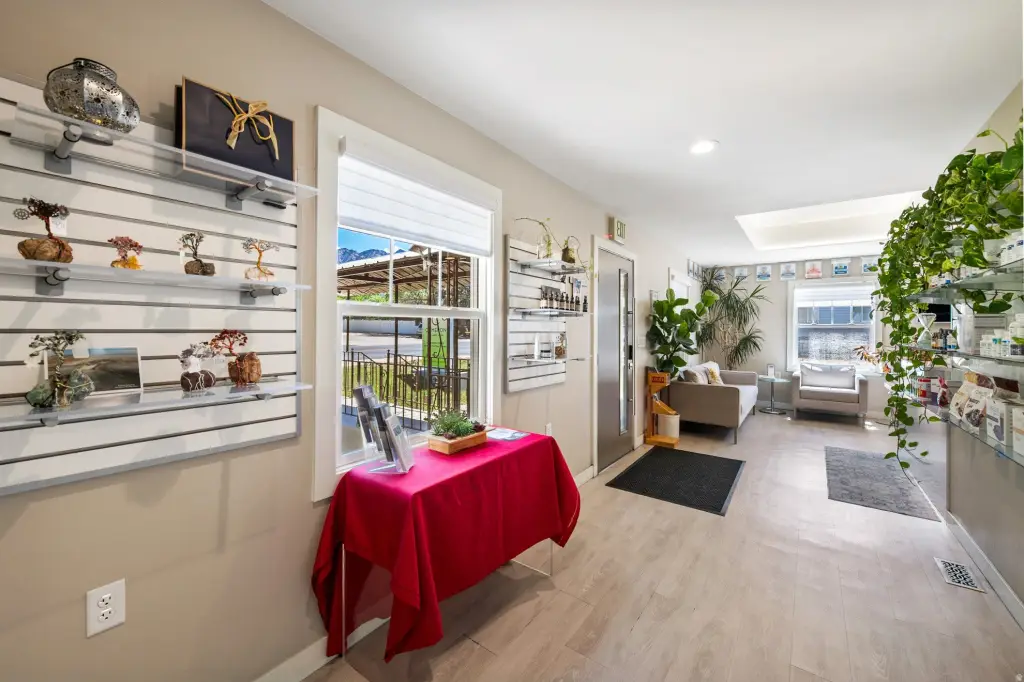
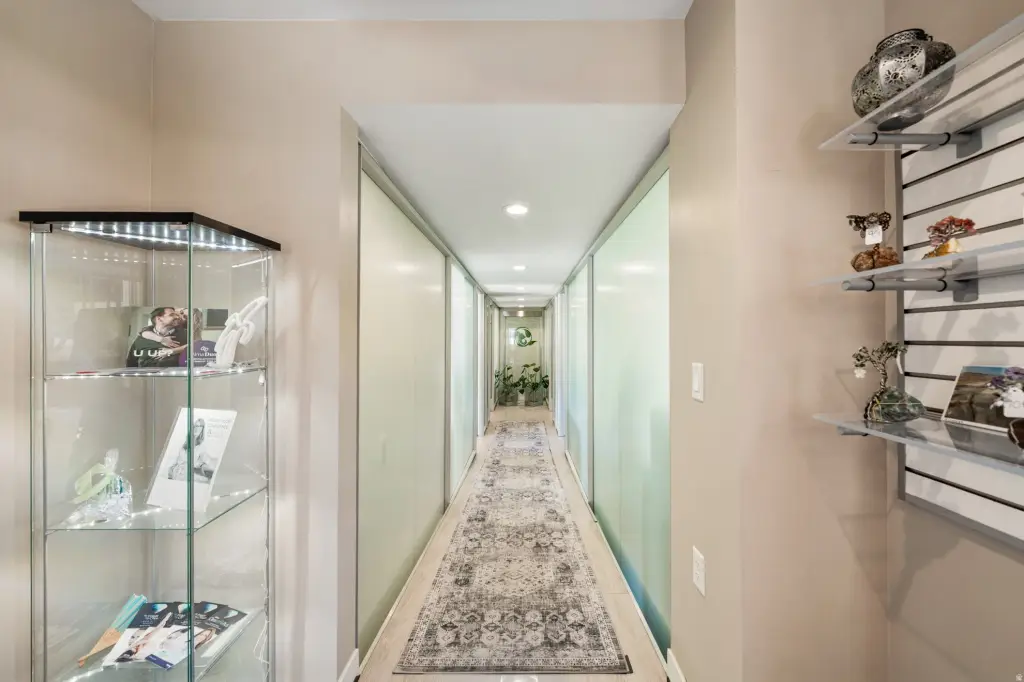
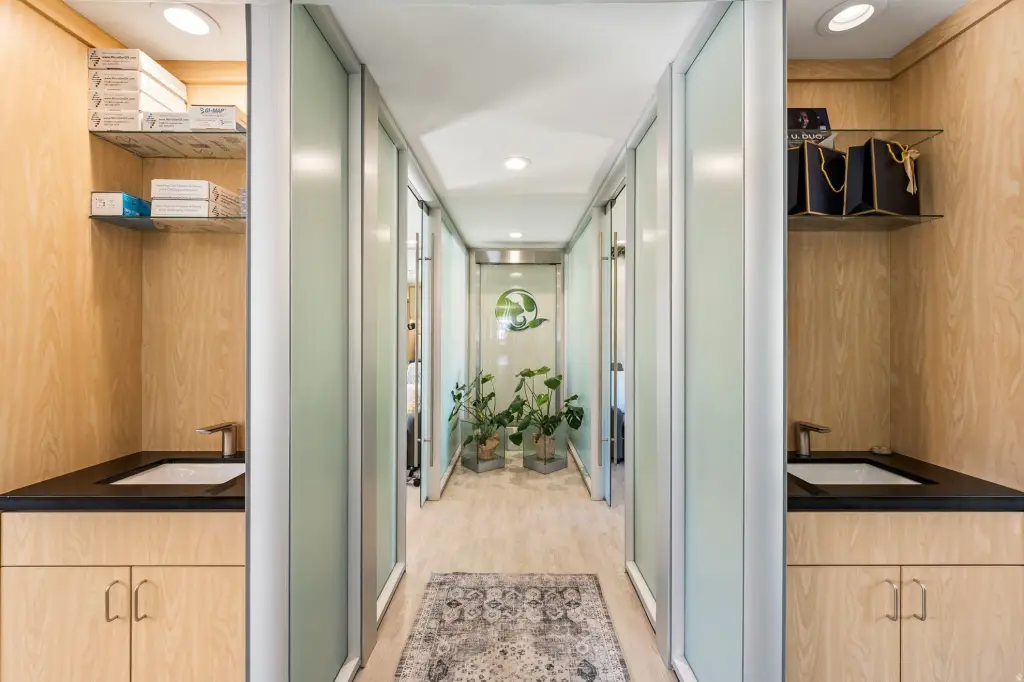
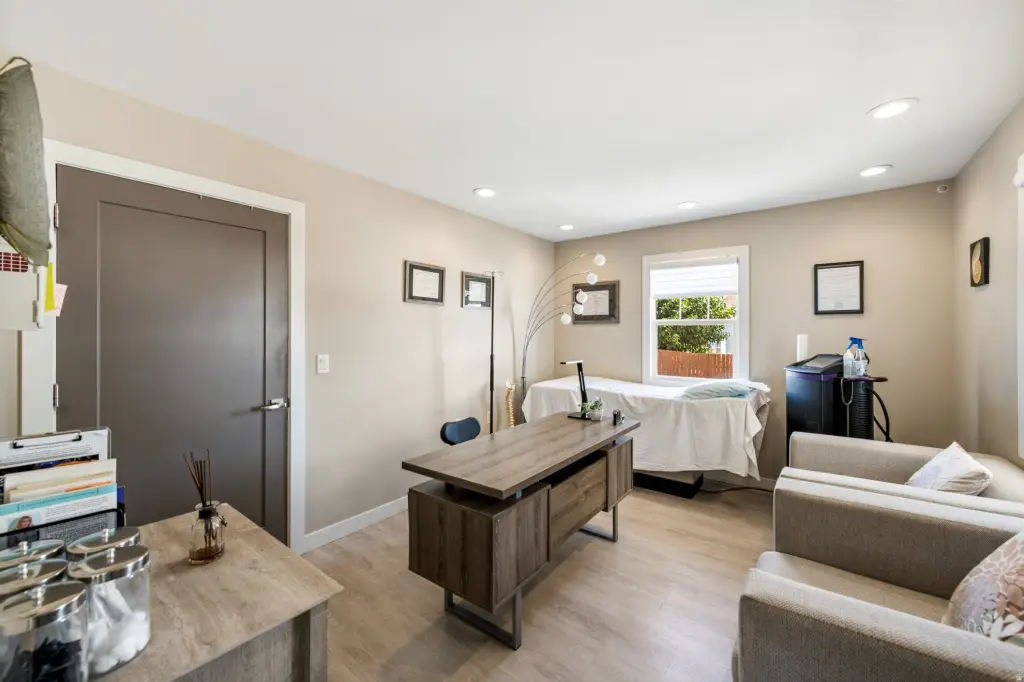
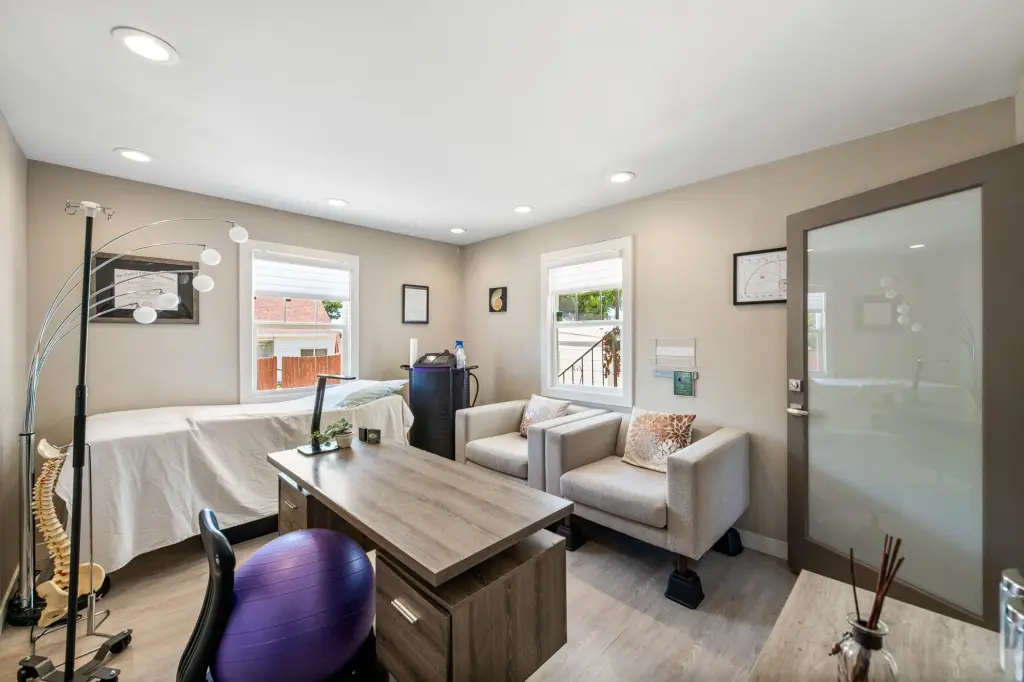
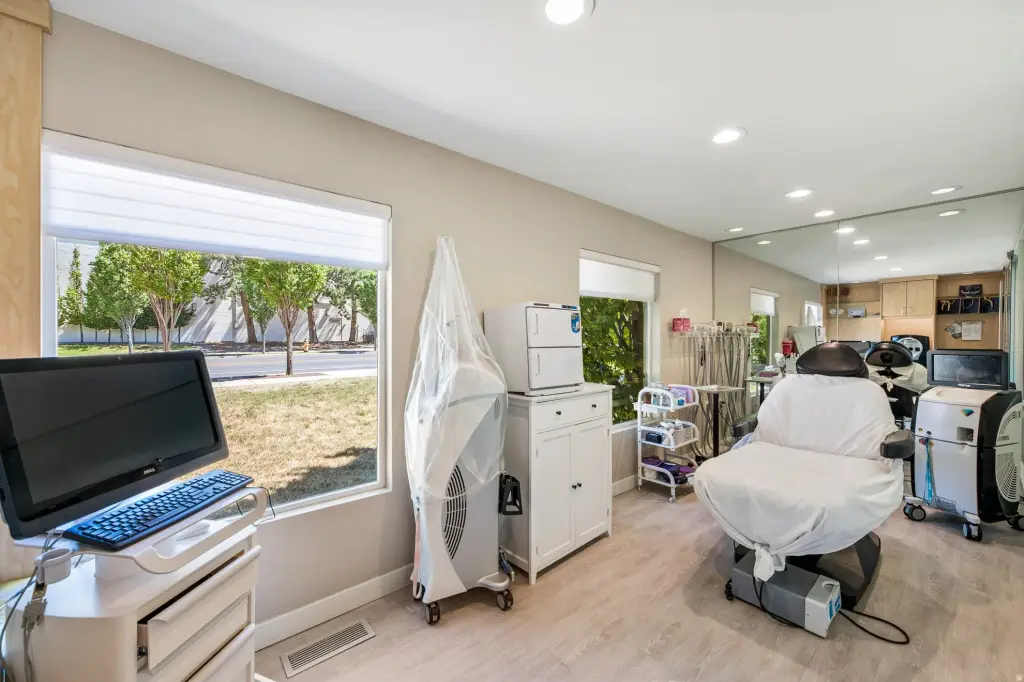
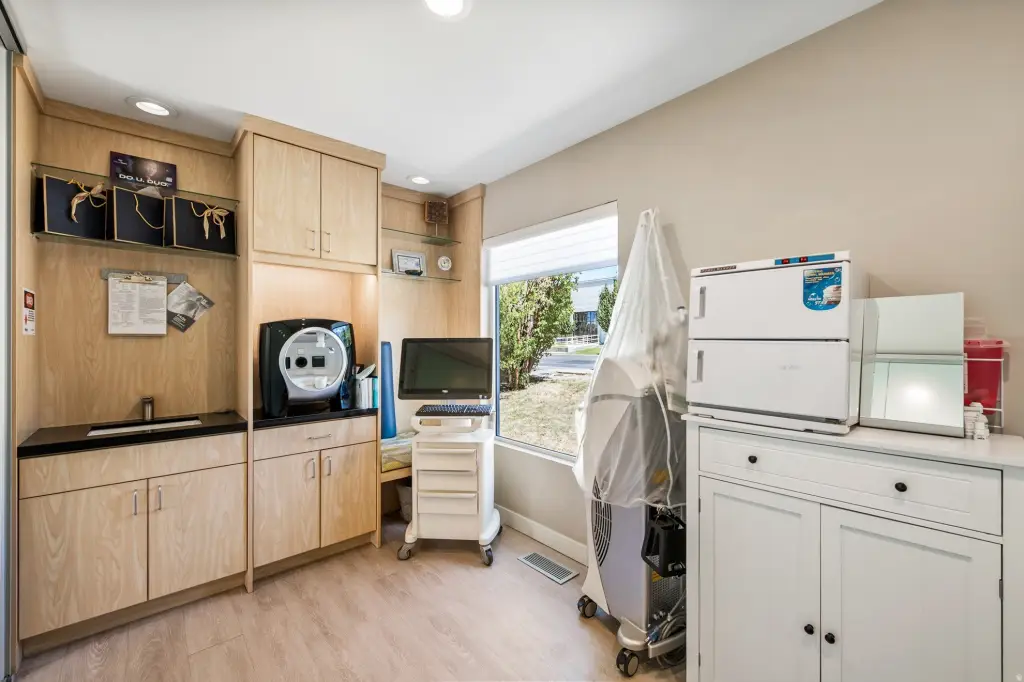
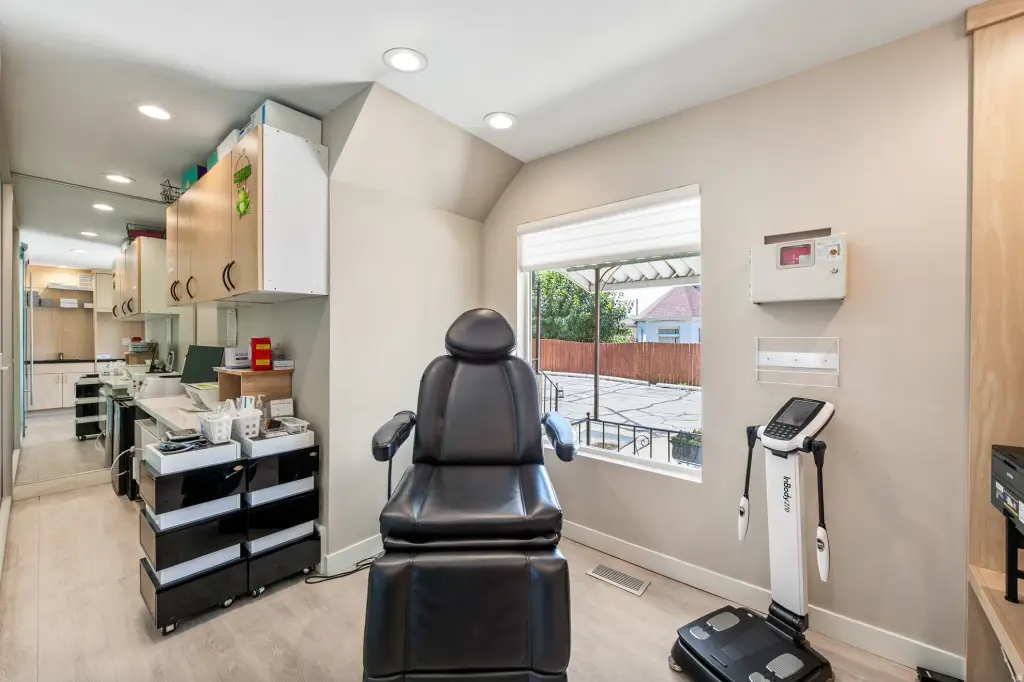
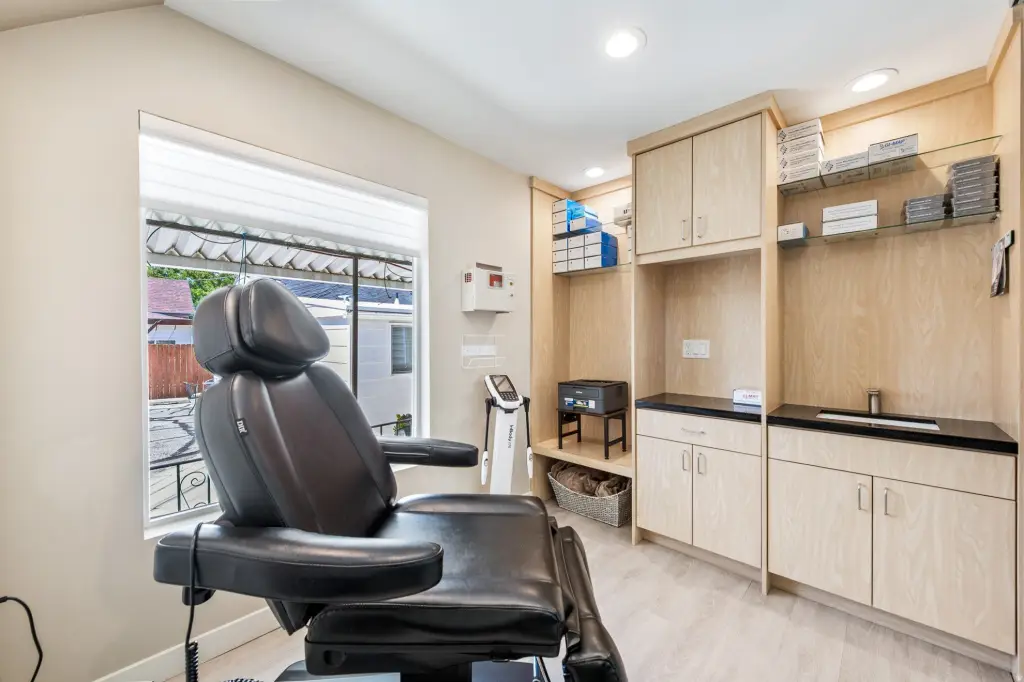
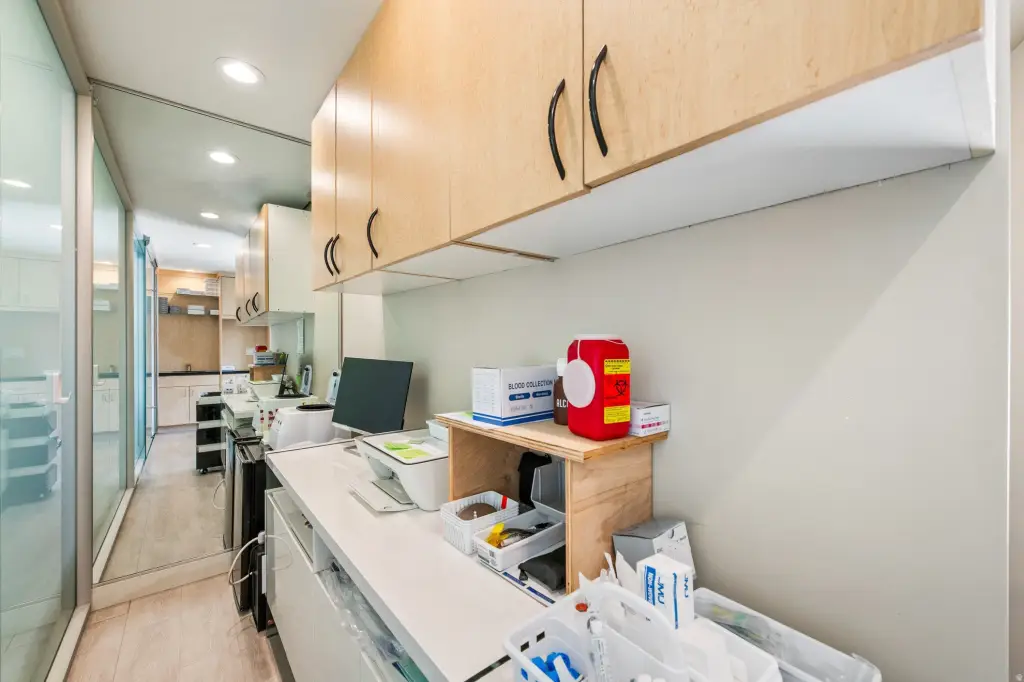
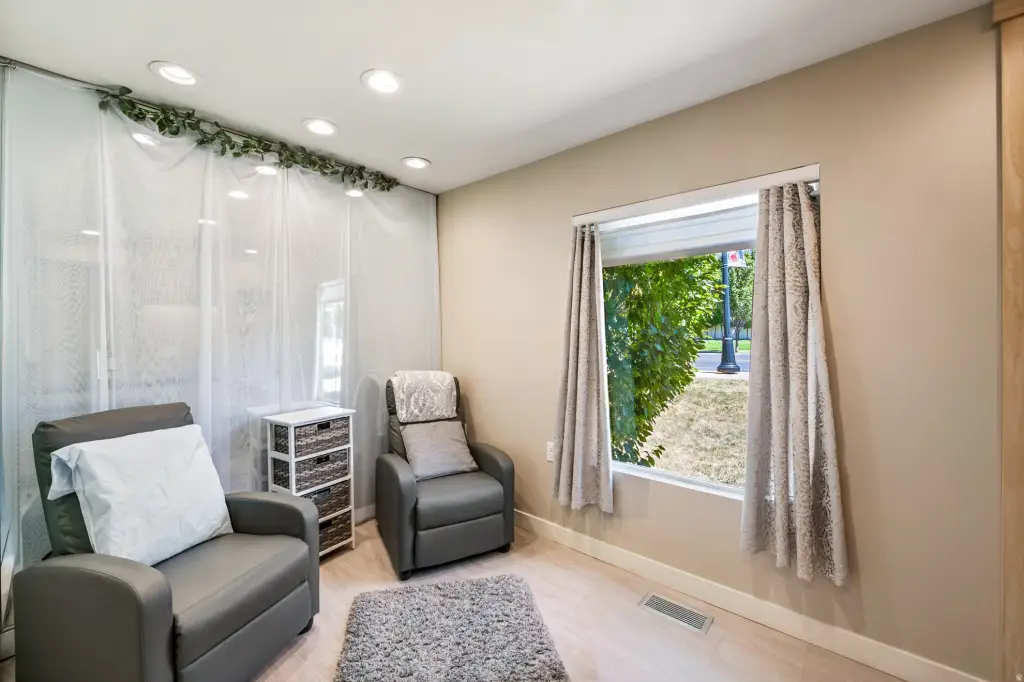
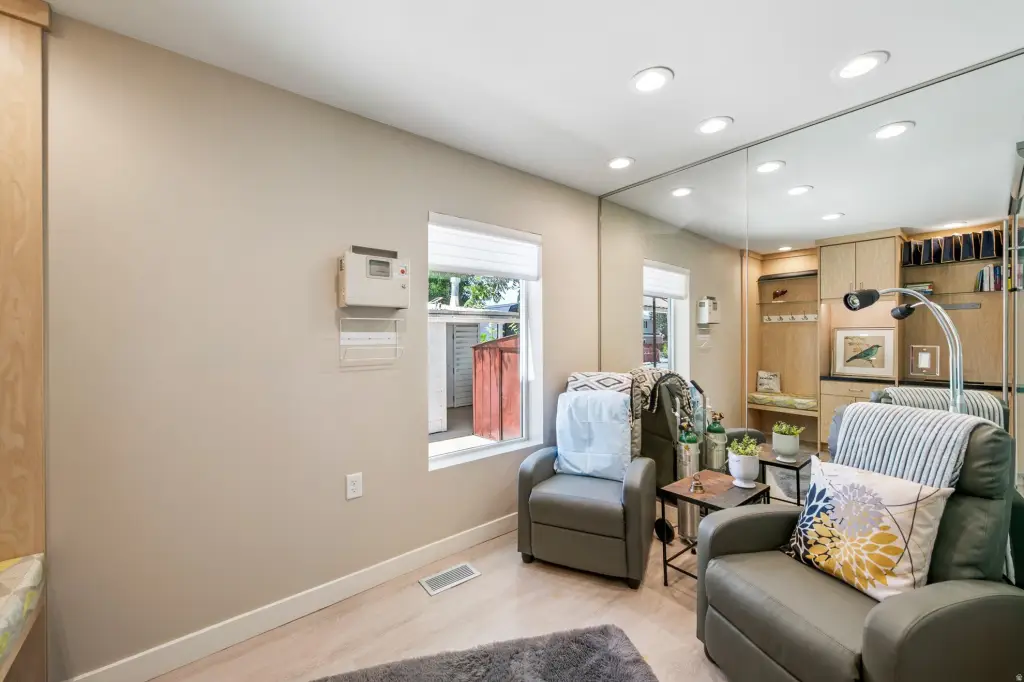
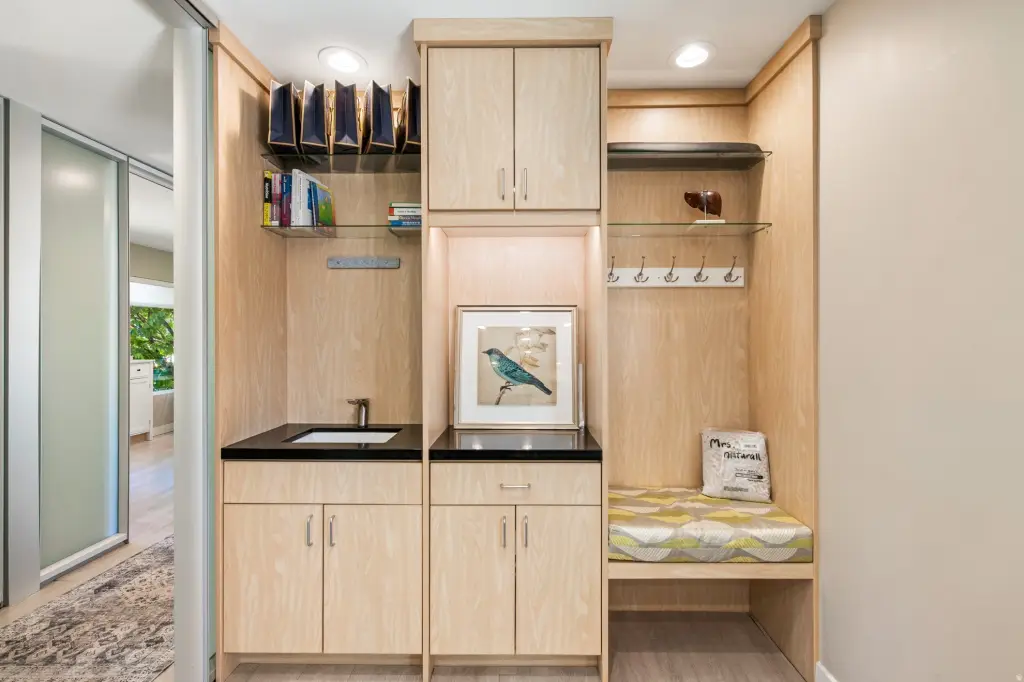
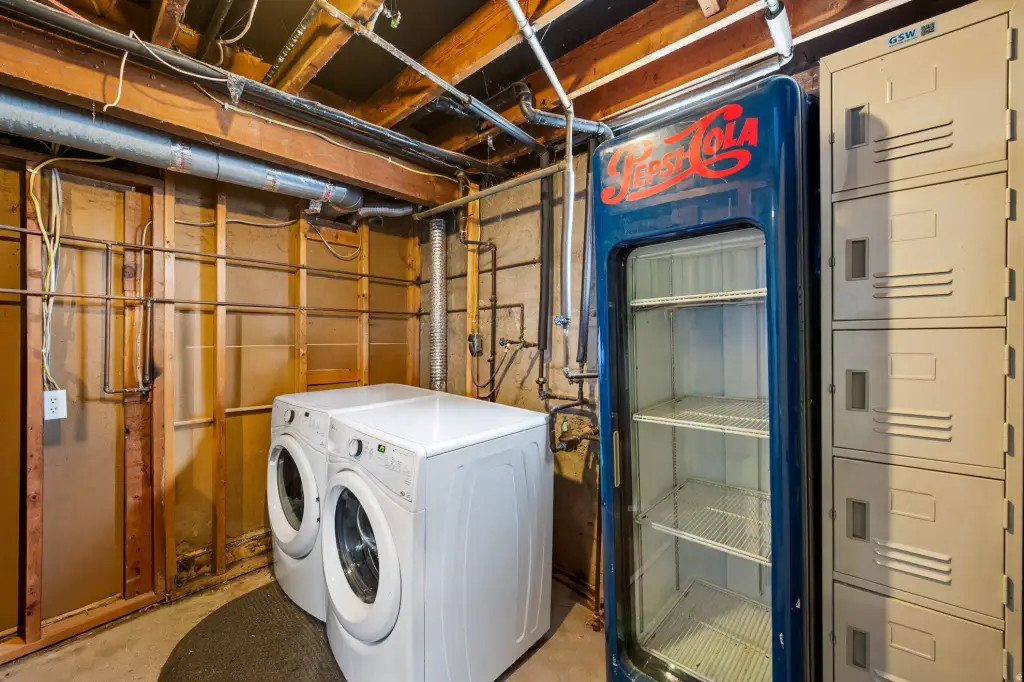
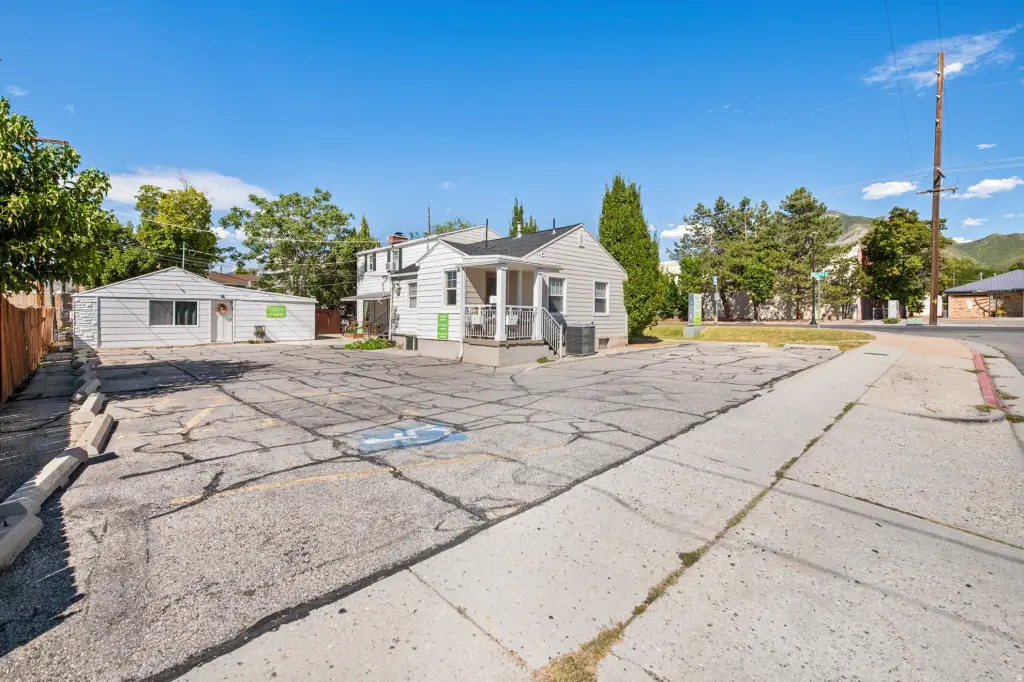
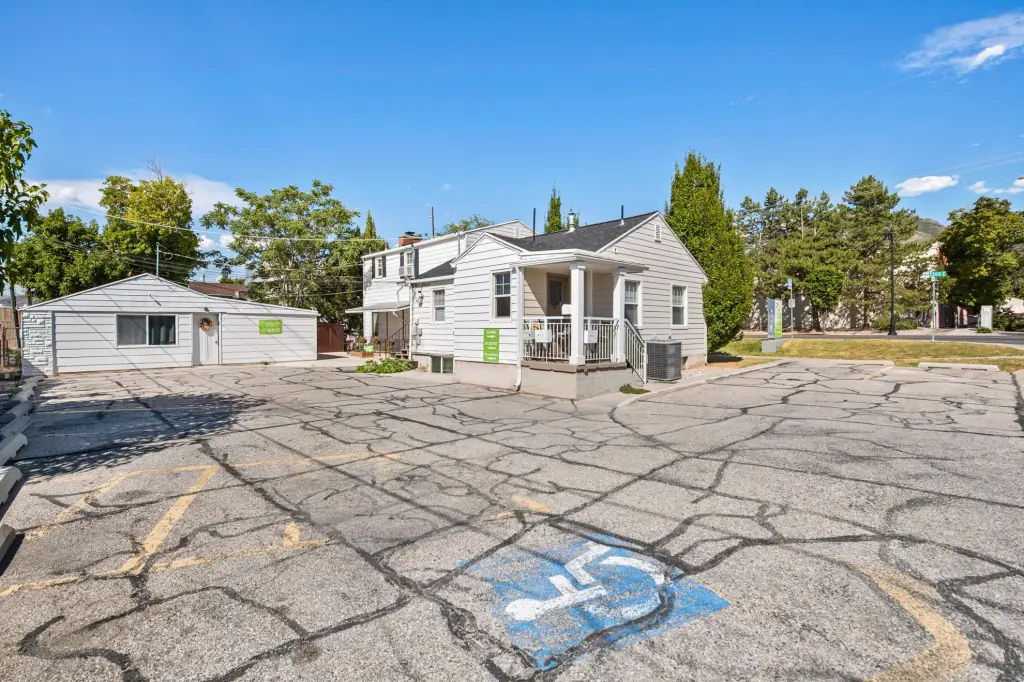
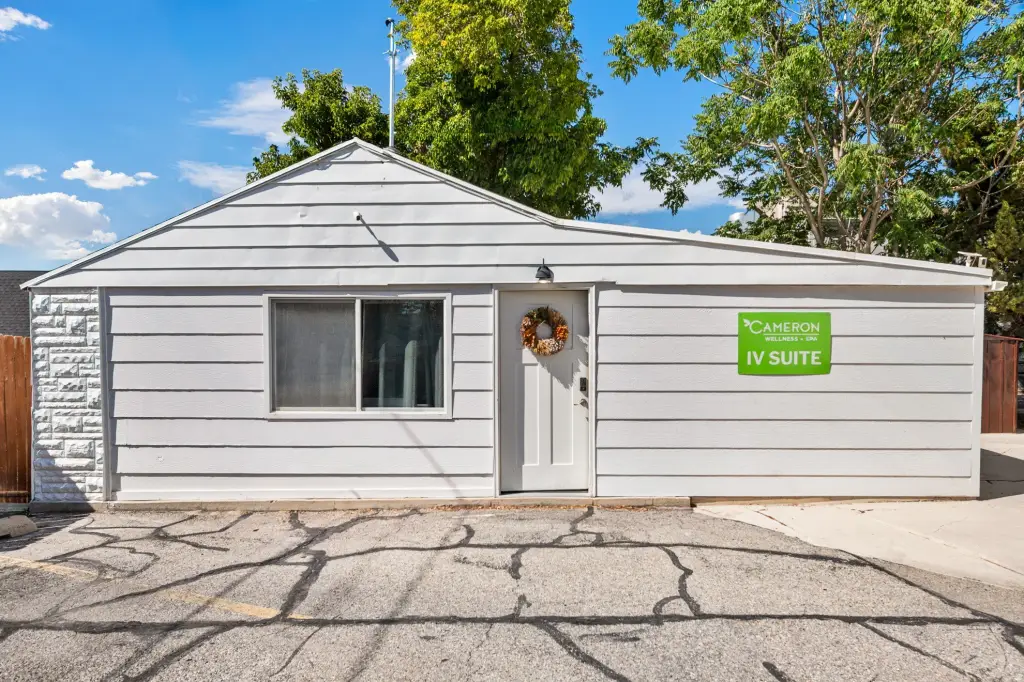
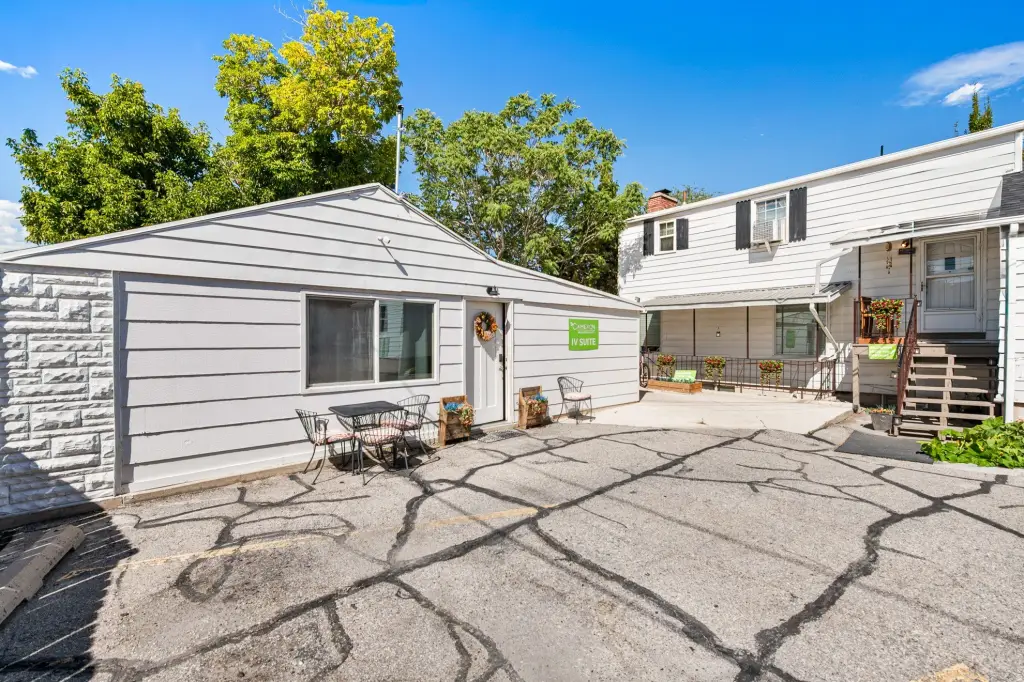
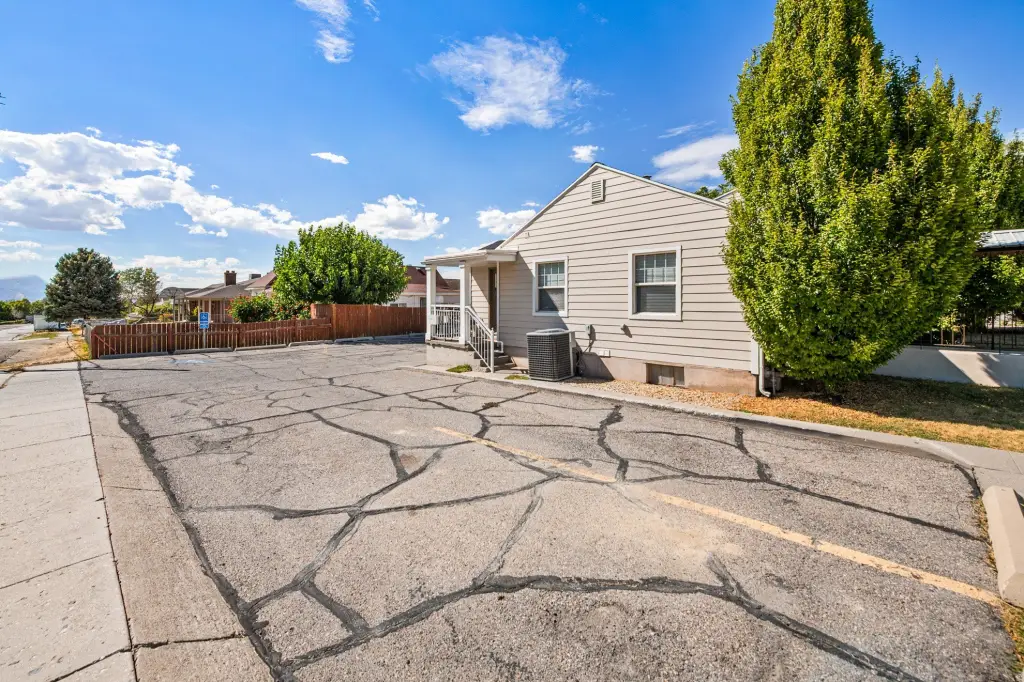
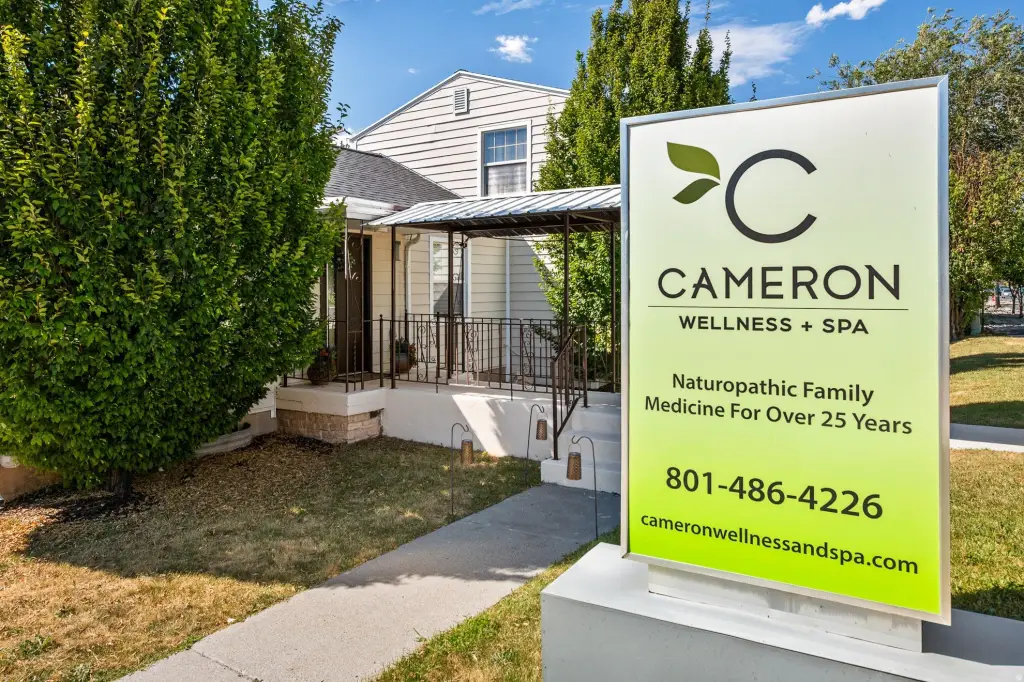
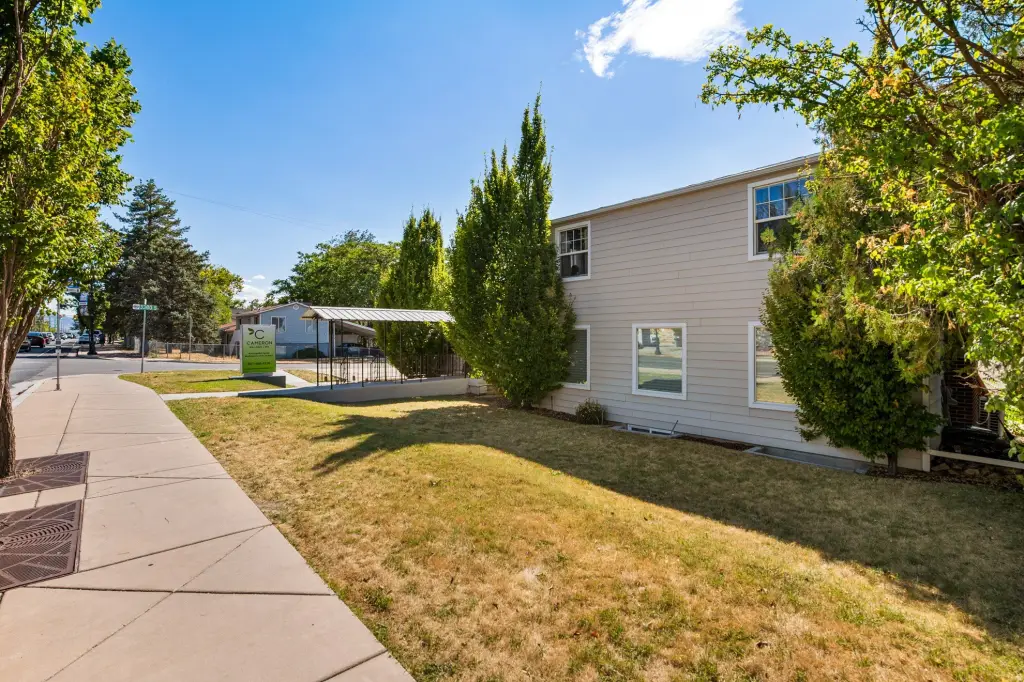
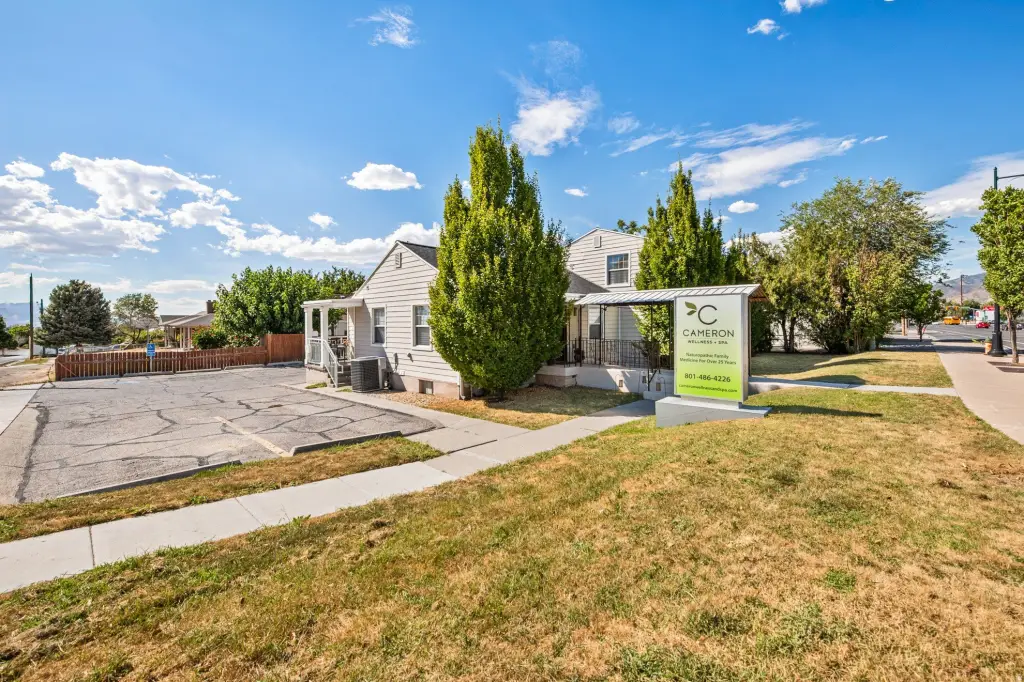
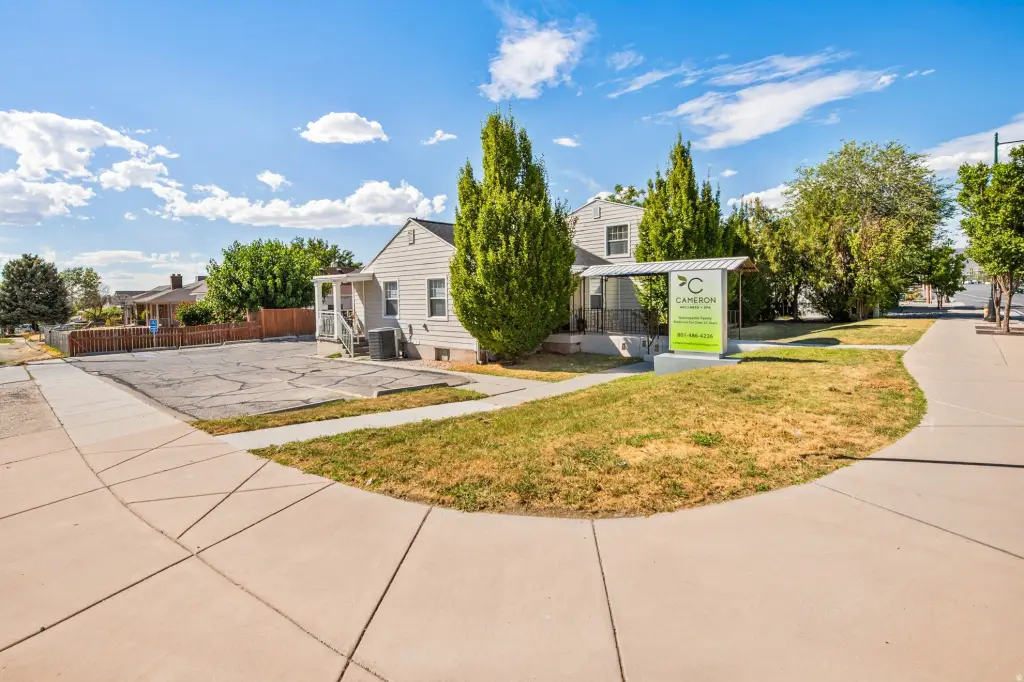
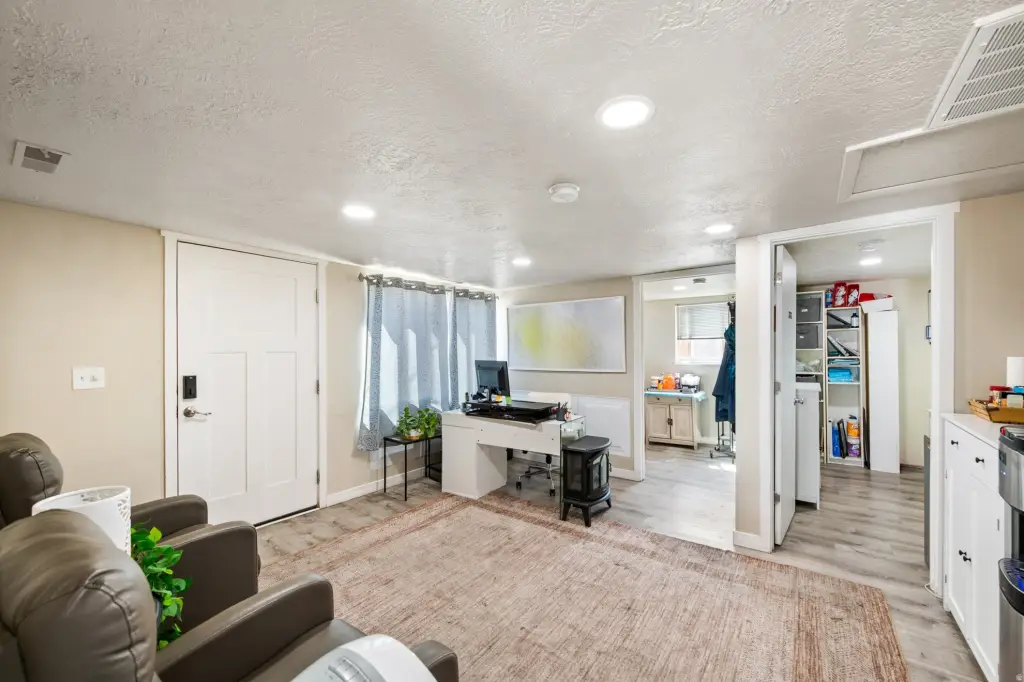
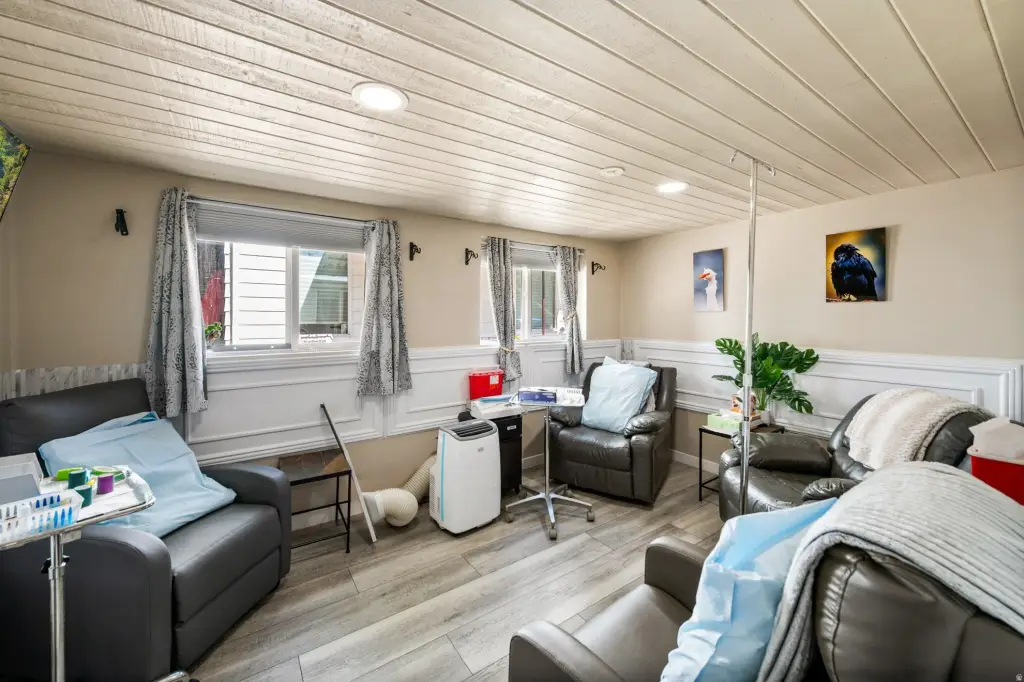
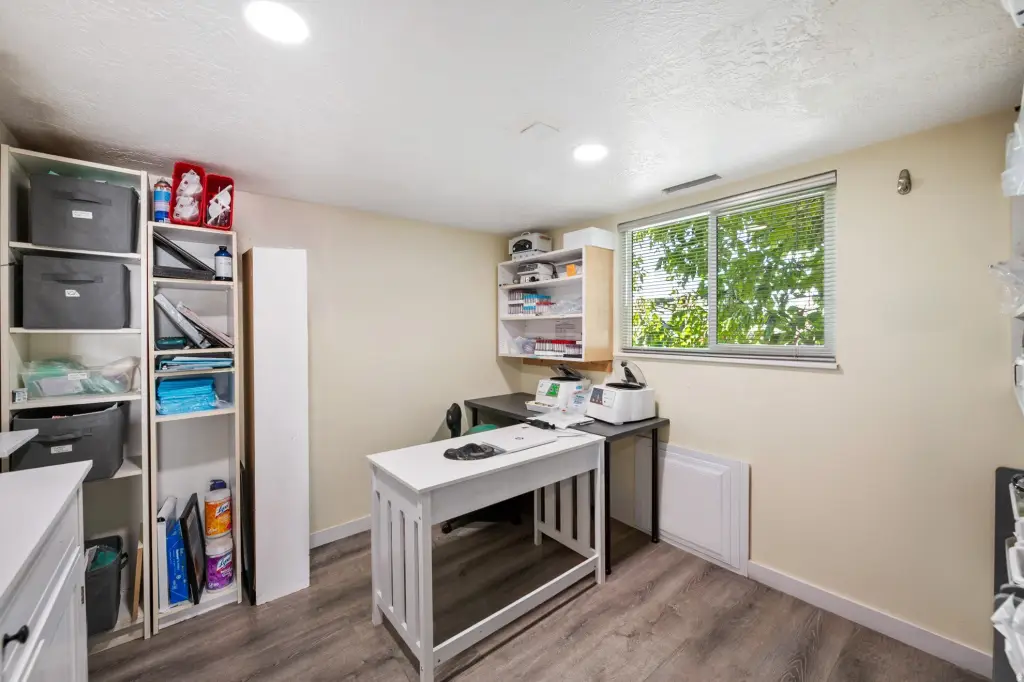
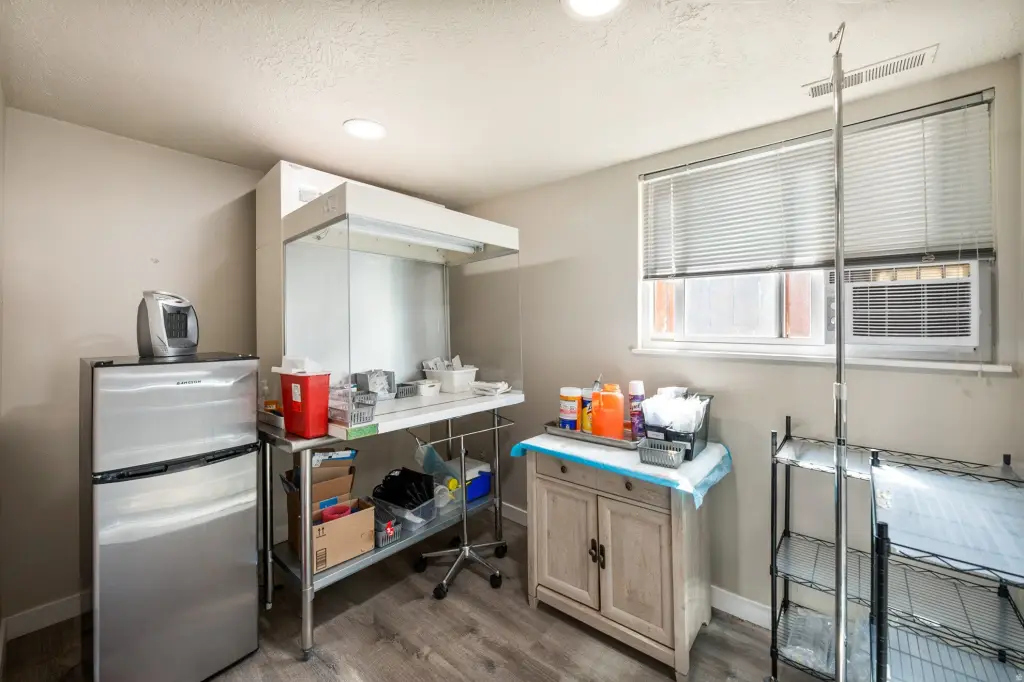
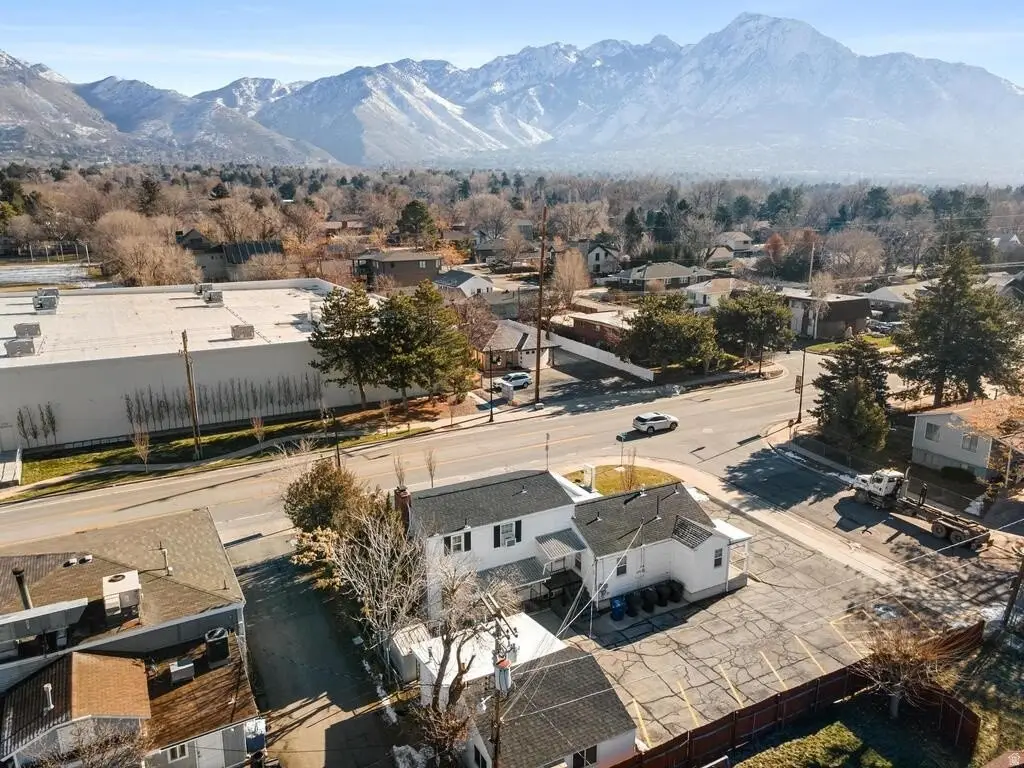
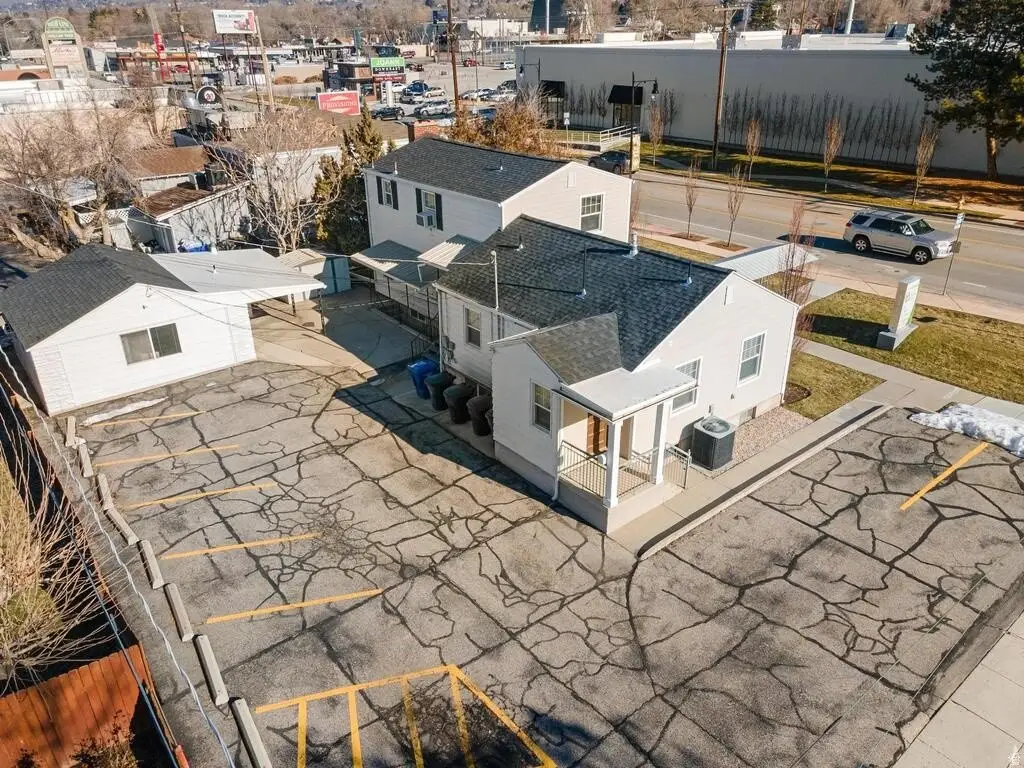
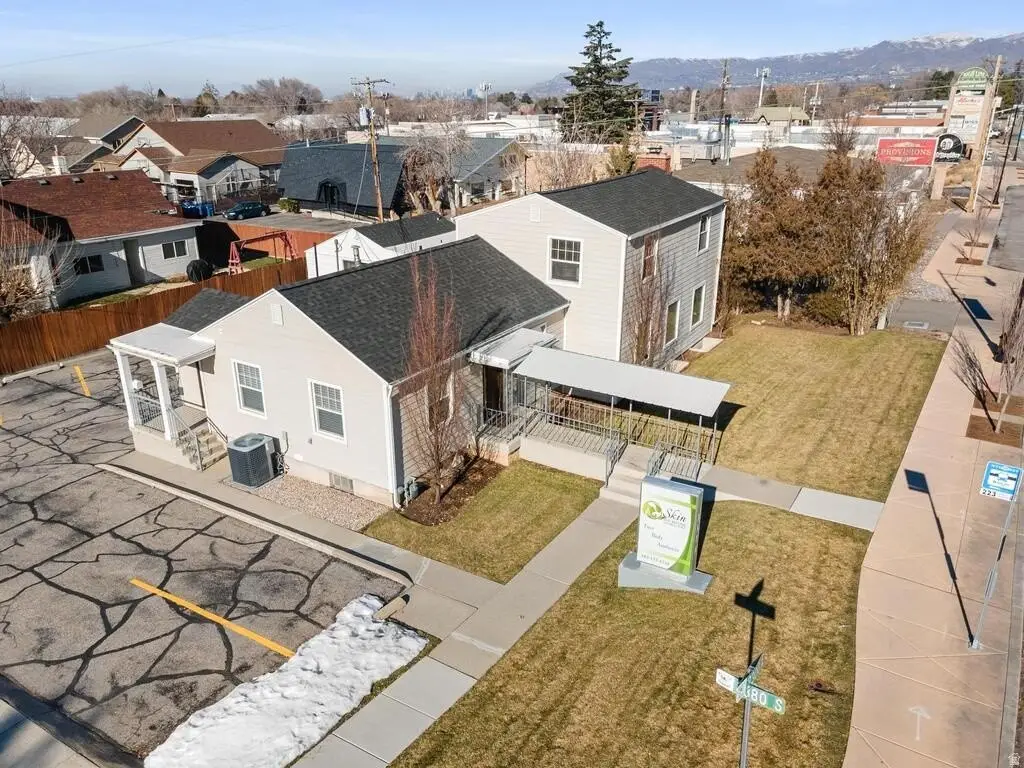
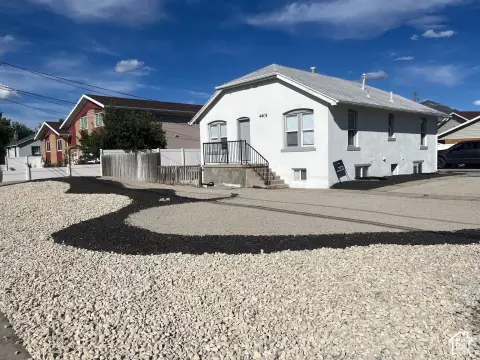
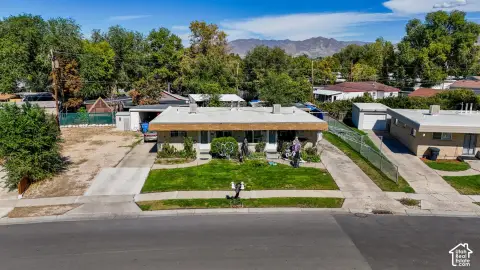
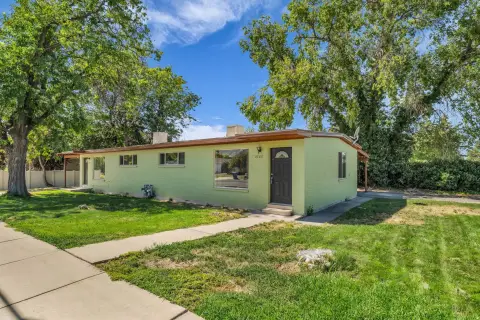
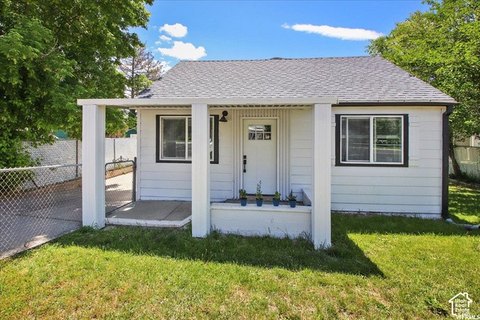
This mixed-use property comprises three buildings totaling approximately 3,939 square feet. The principal commercial structure contains approximately 1,376 square feet arranged for medical office and spa operations, including treatment rooms, office areas, client service space, and a private bathroom. A separate 591-square-foot IV and wellness suite supports a distinct operational area. The property also includes an onsite shed.
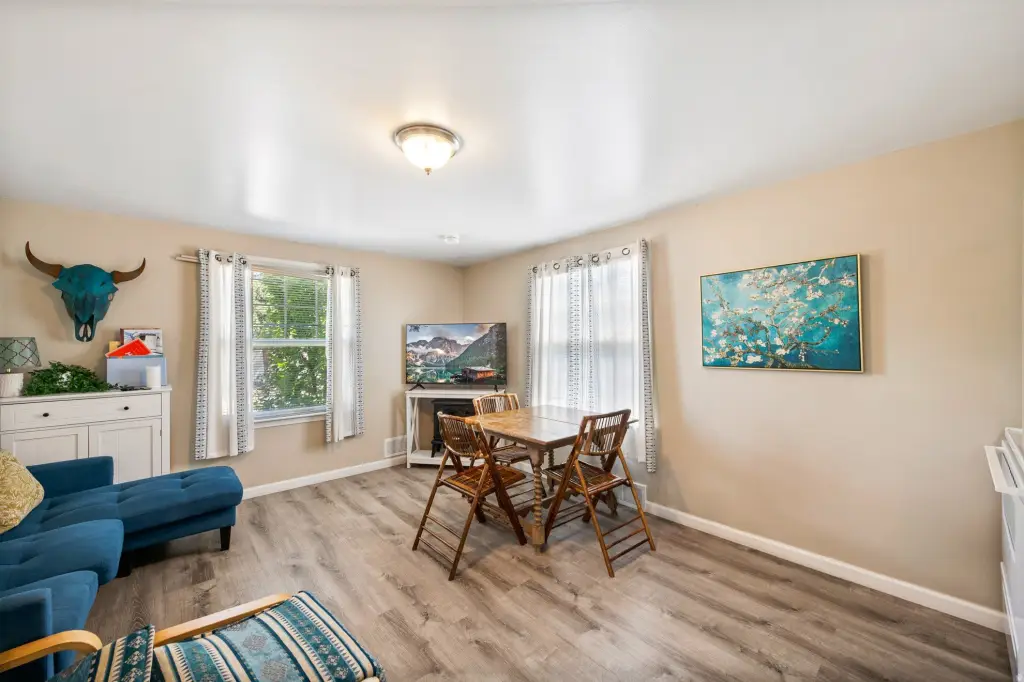
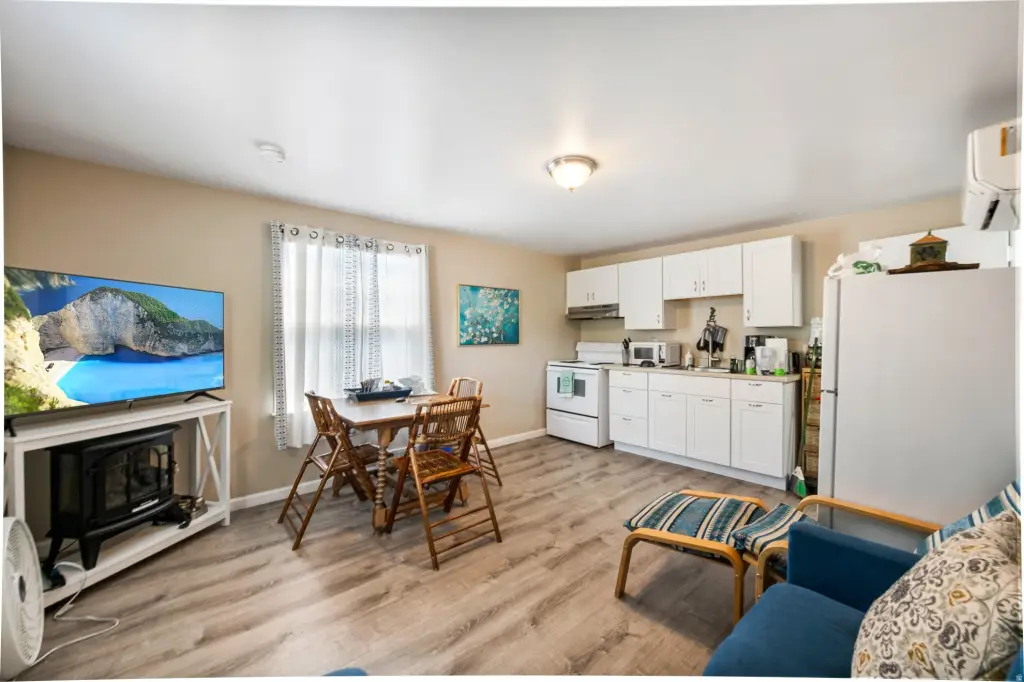
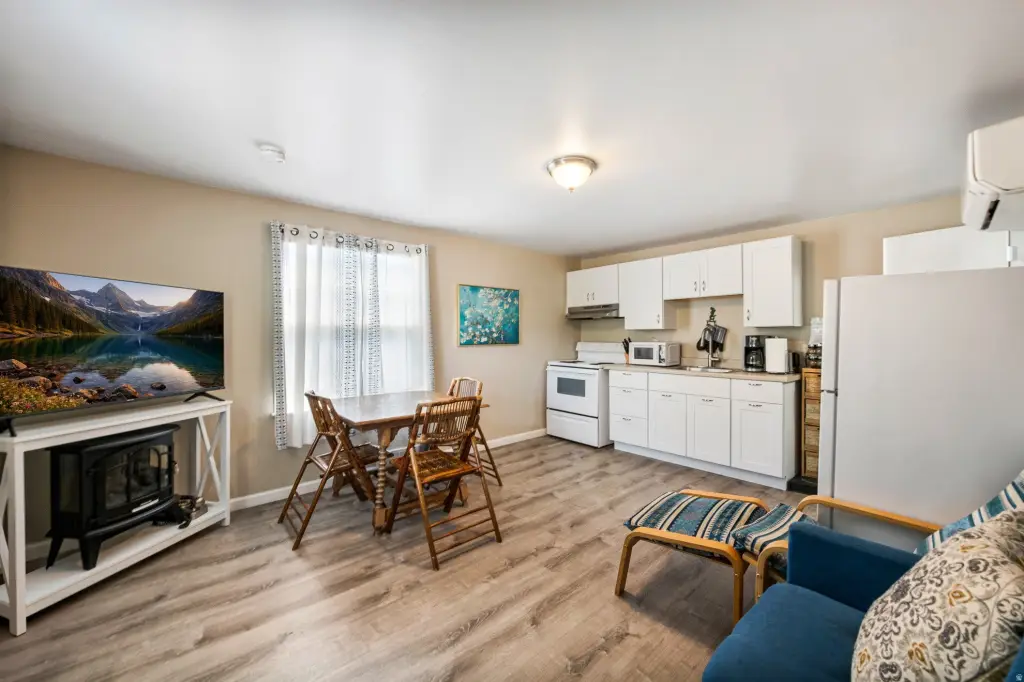
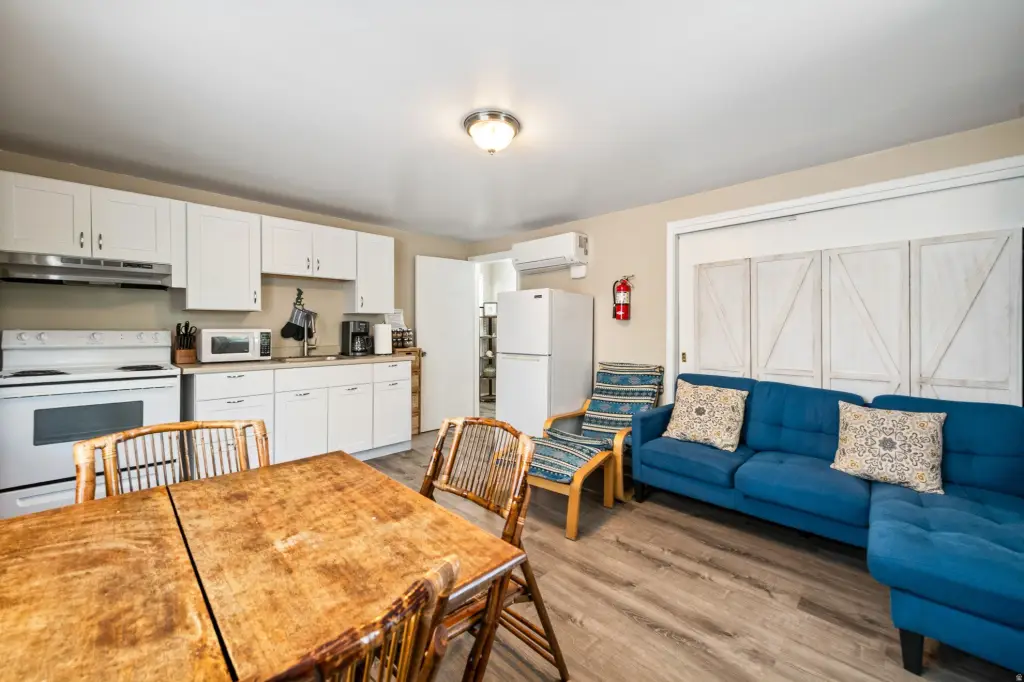
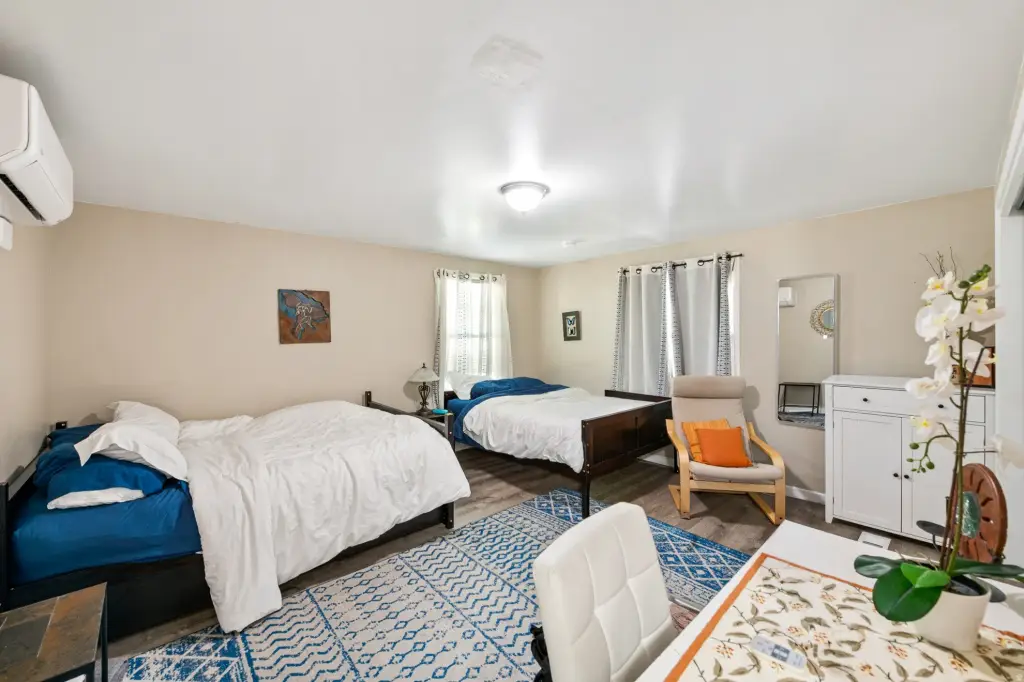
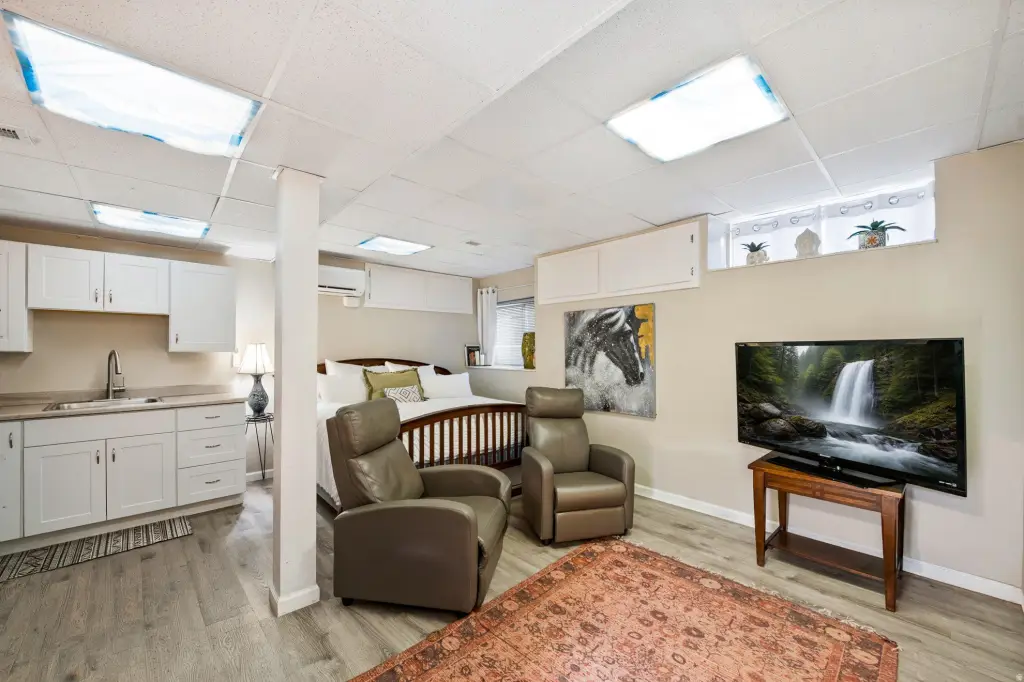
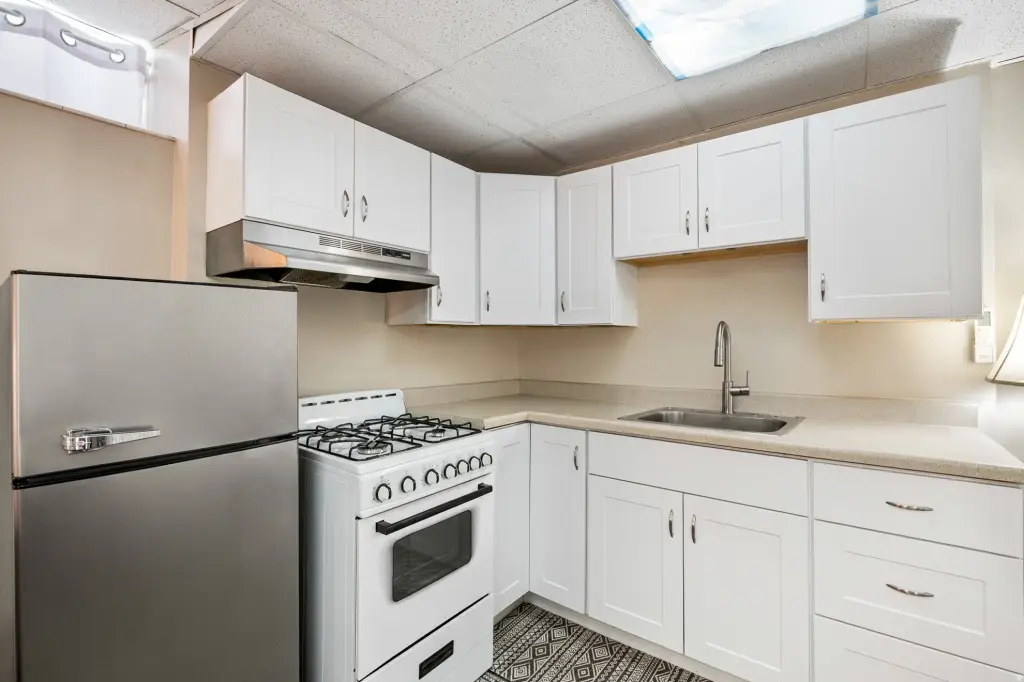
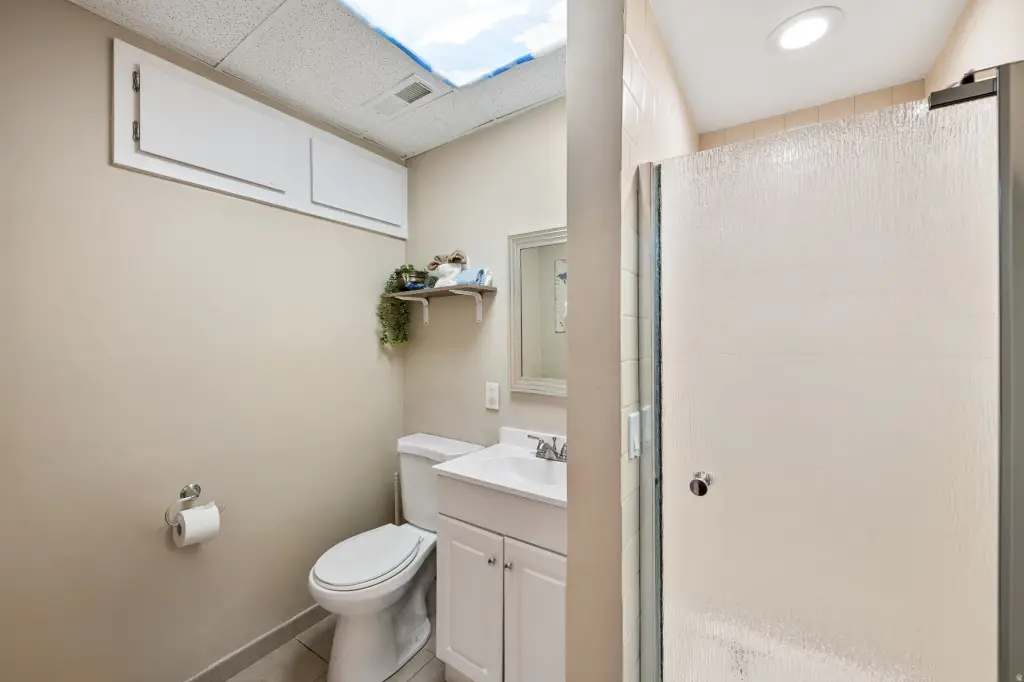
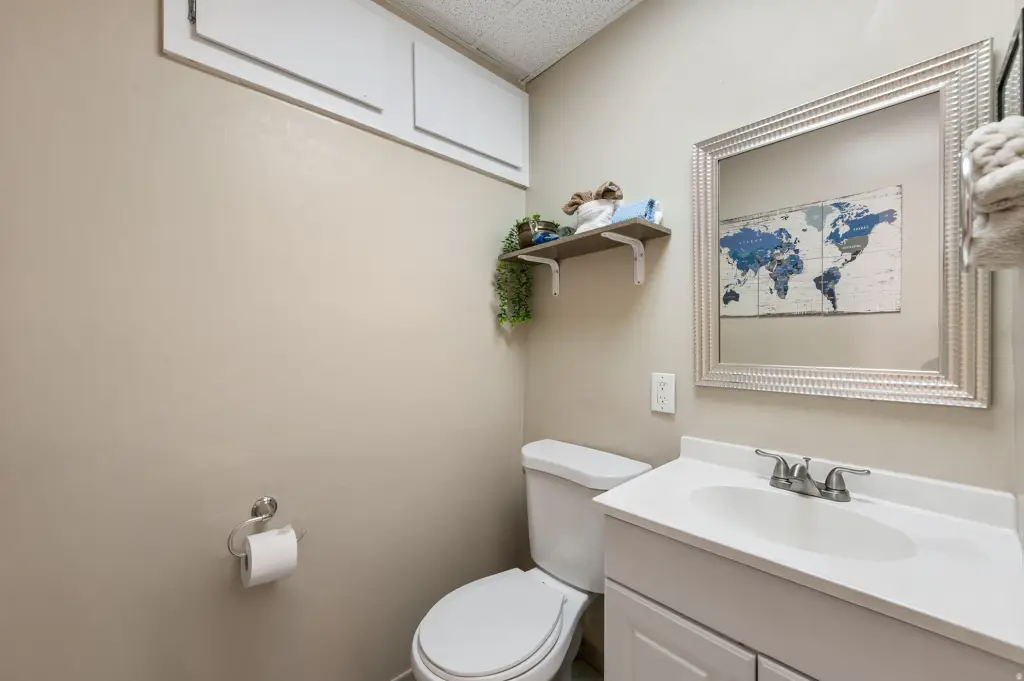
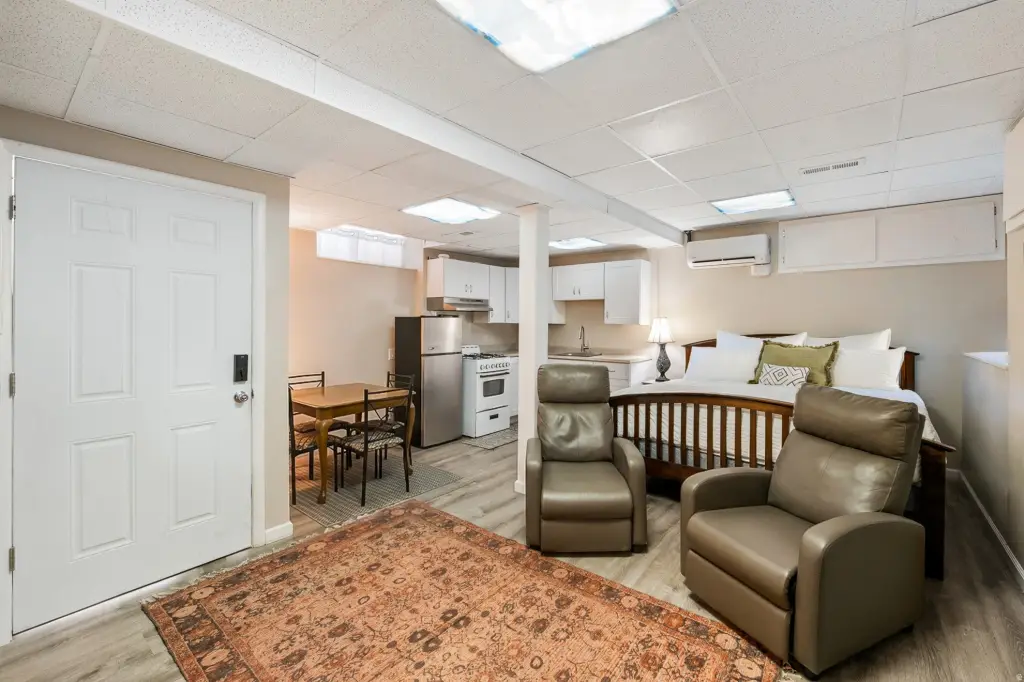
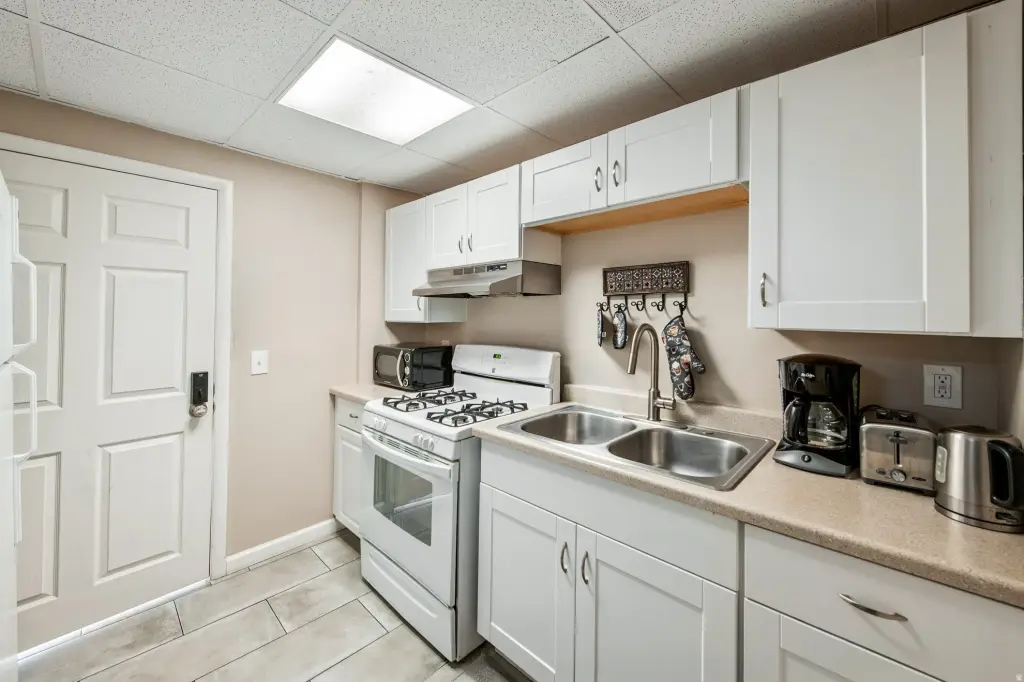
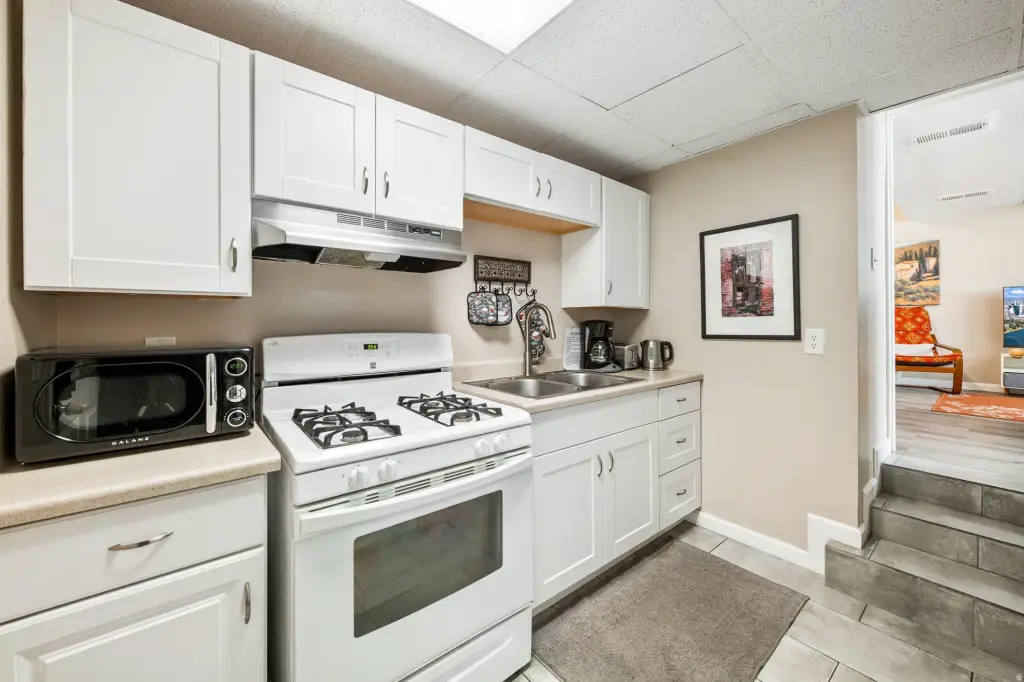
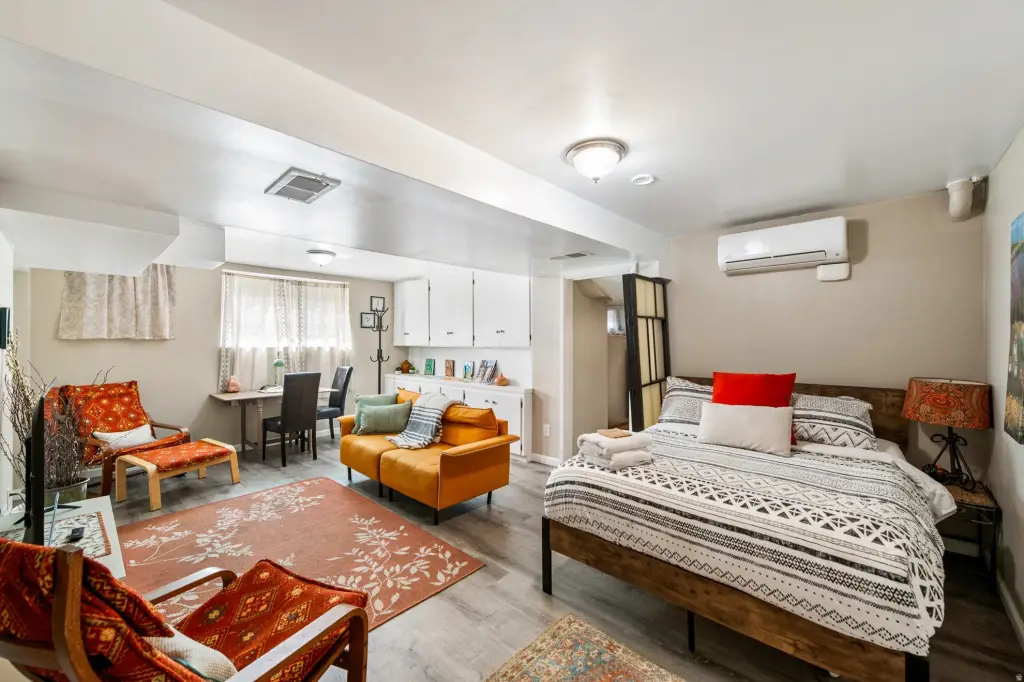
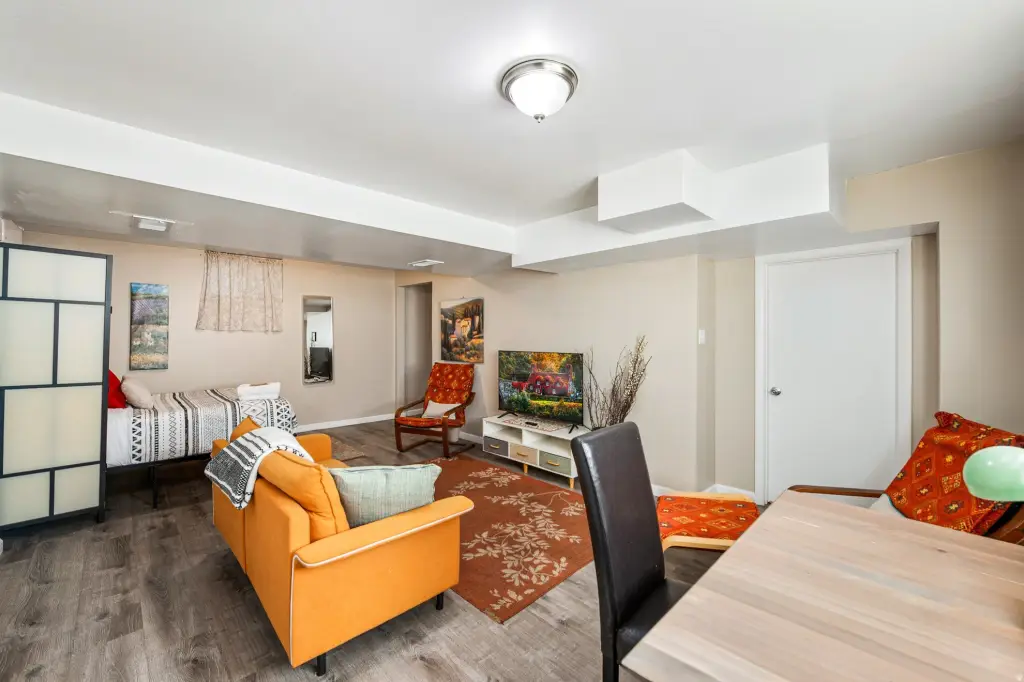
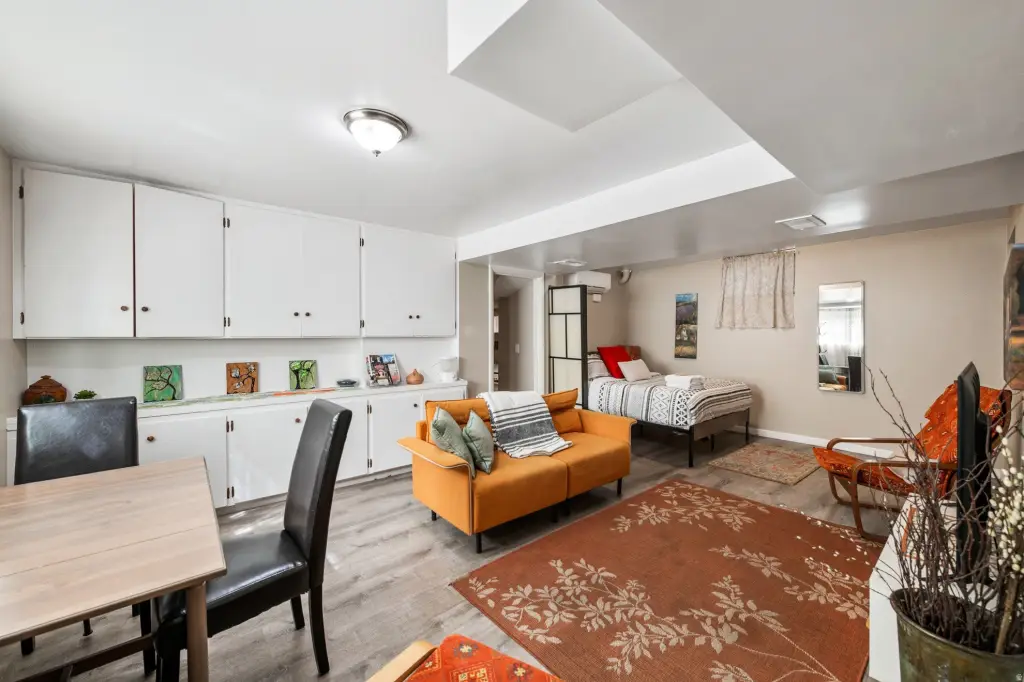
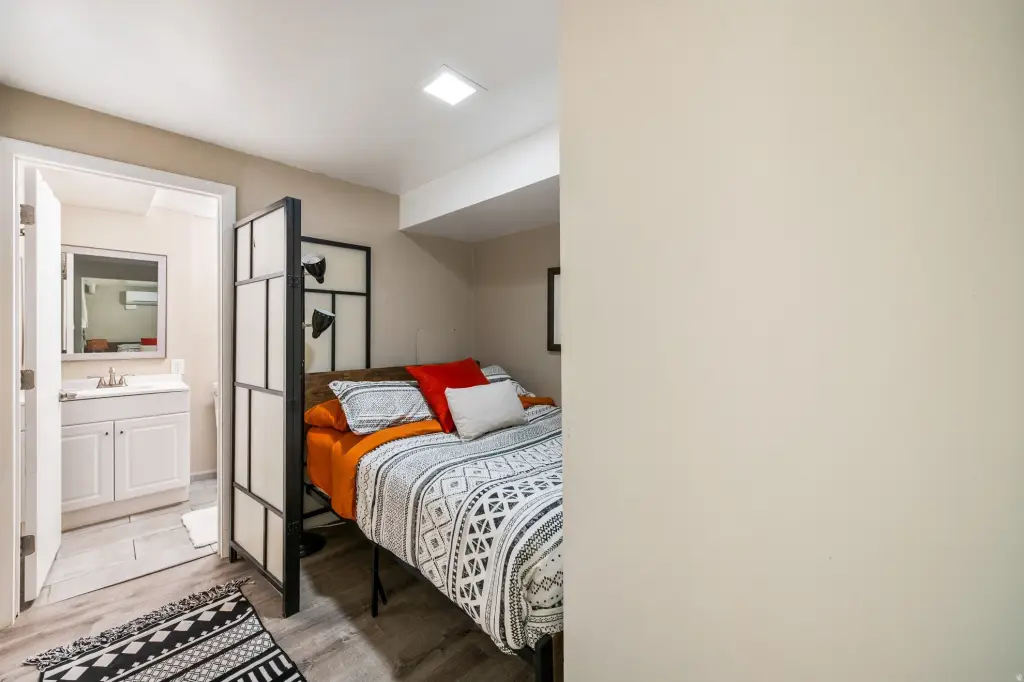
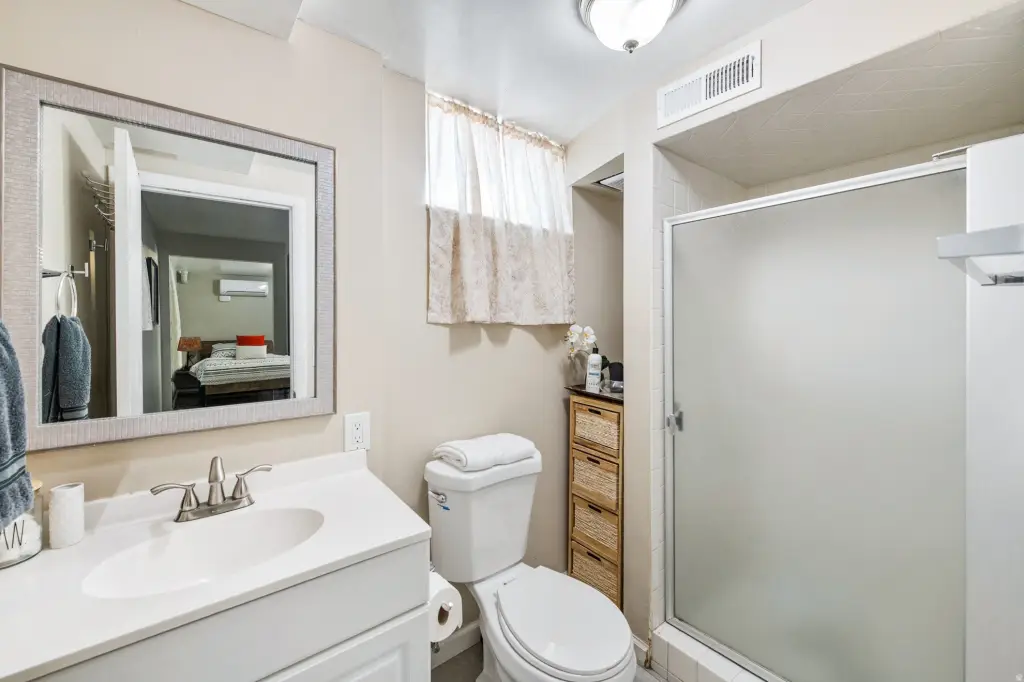
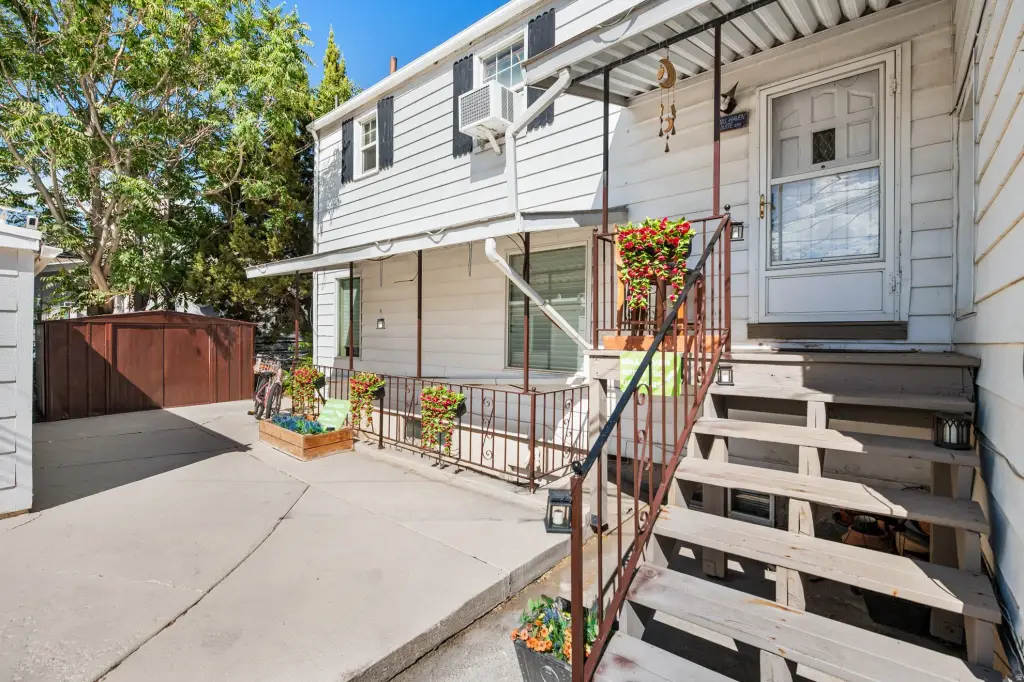
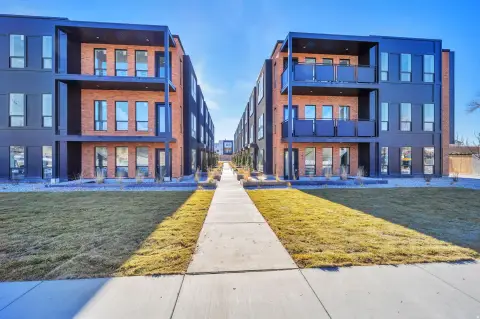
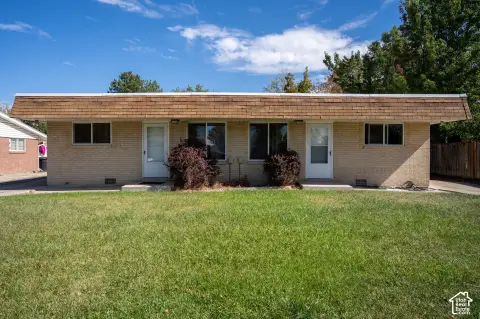
The residential component measures approximately 1,972 square feet and is divided into three apartments. Each apartment has a private entrance, bedroom, and bathroom. Additional parking stalls may be leased from a nearby business. Built in 1945, the property includes natural gas forced-air heating, central air conditioning, and an accessible approach with ramp.
The residential component measures approximately 1,972 square feet and is divided into three apartments. Each apartment has a private entrance, bedroom, and bathroom. Additional parking stalls may be leased from a nearby business. Built in 1945, the property includes natural gas forced-air heating, central air conditioning, and an accessible approach with ramp.
Key Highlights
- Approximately 3,939 square feet across three buildings
- Approximately 1,376‑square‑foot medical office and spa component
- Separate 591 SF IV and wellness suite
Financial Insights
Estimated NOI and Cap Rate
NOI / Yr
$56,991
Cap Rate
3.26%
Suggested Prices Based on Cap Rates
Cap Rate 5%
$1,139,820
$1.1M
Cap Rate 7%
$814,157
$814.2K
Cap Rate 9%
$633,233
$633.2K
Market Conditions
NOI Build-Up for 3,939 SF
Gross rent
$102.6K $26.04/SF
− Vacancy
−$11.4K −$2.89/SF
EGI
$91.2K $23.15/SF
− OpEx
−$34.2K −$8.68/SF
NOI
$57.0K $14.47/SF
Area
Salt Lake County, UT
Vacancy
11.10%
Lease Rate
$26.04 /SF/Yr
Expense Ratio
37.50%
Simulate Cap Rate and NOI
Suggested Prices Based on Cap Rates
Cap Rate 5%
$1,139,820
Cap Rate 7%
$814,157
Cap Rate 9%
$633,233
Alternative Uses
Best Use
Multifamily LT 5
$52.45M
$45.89M – $61.19M
NOI $3,671,447 @ 7.0% cap · market cap 209.80%
Second Best
Apartment 5plus
$46.77M
$40.93M – $54.57M
NOI $3,274,036 @ 7.0% cap · market cap 187.09%
Theoretical Best
—
—
same as Best Use
Zoning and permitted uses should be independently verified with authorities.
How Realmo checks its estimates
Property Analytics
Who owns this building?
See the owner, sales and loan history
Open Analytics
Current Use
Location Intelligence
Trade Area within ½ mile
491
Businesses Nearby
Explore this area
Business Placement
Demographics for 84109, UT
24,768
Population
9,829
Households
2.5
Avg Household Size
37
Median Age
69%
College-Educated
99%
High-School Grad
57.0 sq mi
ZIP Area
435
Density / Sq Mi
$136,823
Median Household Income
$63,758
Median Earnings
$1,584
Median Rent
$679,000
Median Home Value
Check the figures for this property
Cap Rate, Value Estimation, Potential NOI and more
View Realmo Analytics
Market
Vacancy Rate% for Office in West region



Frequently Asked Questions
What type of property is this?
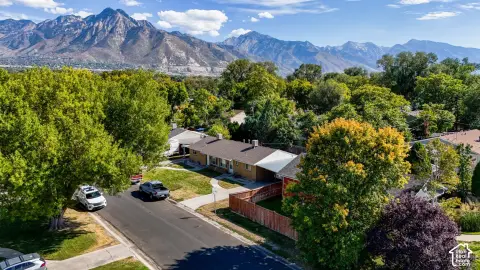
Mixed-use property - Three-building property combines medical and wellness suites with three separately entered apartments.
Where is this mixed-use property located?
The property is located at 3378 S 2300 E Millcreek, UT.
What is the asking price?
The asking price for this property is $1,750,000.
What are key features of this property?
This property features: Approximately 3,939 square feet across three buildings; Approximately 1,376‑square‑foot medical office and spa component; Separate 591 SF IV and wellness suite


