Freestanding Retail Buildings with Rear
For Sale
$1,750,000
336 & 342 South Powerline Road, Deerfield Beach, FL 33442
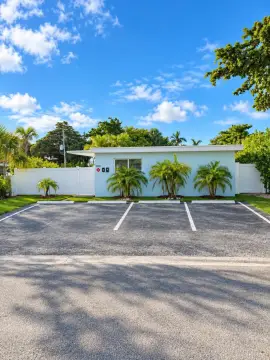
Two freestanding retail buildings zoned B-1 with on-site parking and rear service access for loading.
Property Size4,504 SF
Days on Market90
Property Features for 336 & 342 South Powerline Road
General Information
Standard status
Active
Size
4,504 SF
Property subtype
Retail - Street Retail
Zoning
B-1
Additional Details
Highway Access
Yes
Amenities
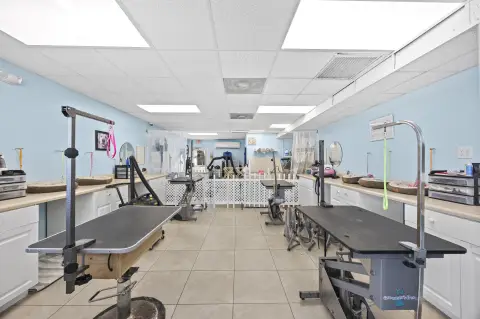
High Ceiling Heights Throughout Select Interior Areas
Rear Service Access & Loading Capability
Strong Frontage Along S Powerline Road
Building Details
Building Size
4,504 SF
Year Built
1996
Buildings
2
Units
2
Listing Agency:
Native Realty
Listed By:
Jaime Sturgis · License #3246270
(954) 595-2999
Source:
Commercialcafe
Added: Jul 29
Changed: Oct 26
Last Checked: Oct 24 at 1:37PM
Displayed information is deemed reliable but is not guaranteed and should be independently verified. All listing content including descriptions, pricing, images are the copyrighted material of Native Realty

Ask AI about this property
Review the available facts, identify missing information and prepare questions for the agent.
Investment Insights
Based on property information with market context.
Two freestanding commercial retail buildings are offered together, totaling 4,504 SF. The property is zoned B-1, which allows for a variety of commercial uses. Select interior areas feature high ceiling heights, supporting flexibility for multiple tenant needs.
The buildings provide strong frontage along S Powerline Road and include on-site parking surrounding the property. Rear service access and loading capability are available, which can support operations that require deliveries beyond primary customer access. The property is centrally located within Broward County with convenient access to I-95, Sawgrass Expressway, and major thoroughfares.
The buildings provide strong frontage along S Powerline Road and include on-site parking surrounding the property. Rear service access and loading capability are available, which can support operations that require deliveries beyond primary customer access. The property is centrally located within Broward County with convenient access to I-95, Sawgrass Expressway, and major thoroughfares.
Key Highlights
- Offered as two freestanding retail buildings totaling 4,504 SF
- B‑1 zoning allows a variety of commercial uses
- Strong frontage along S Powerline Road
Financial Insights
Estimated NOI and Cap Rate
NOI / Yr
$76,159
Cap Rate
4.35%
Suggested Prices Based on Cap Rates
Cap Rate 5%
$1,523,180
$1.5M
Cap Rate 7%
$1,087,986
$1.1M
Cap Rate 9%
$846,211
$846.2K
Market Conditions
NOI Build-Up for 4,504 SF
Gross rent
$118.9K $26.40/SF
− Vacancy
−$10.1K −$2.24/SF
EGI
$108.8K $24.16/SF
− OpEx
−$32.6K −$7.25/SF
NOI
$76.2K $16.91/SF
Area
Broward County, FL
Vacancy
8.50%
Lease Rate
$26.40 /SF/Yr
Expense Ratio
30.00%
Simulate Cap Rate and NOI
Suggested Prices Based on Cap Rates
Cap Rate 5%
$1,523,180
Cap Rate 7%
$1,087,986
Cap Rate 9%
$846,211
Alternative Uses
Best Use
Retail
$1.09M
$952.0K – $1.27M
NOI $76,159 @ 7.0% cap · market cap 4.35%
Second Best
—
—
no second resolved use
Theoretical Best
Office A
$2.29M
$2.00M – $2.67M
NOI $159,955 @ 7.0% cap · market cap 9.14%
Zoning and permitted uses should be independently verified with authorities.
How Realmo checks its estimates
Property Analytics
Who owns this building?
See the owner, sales and loan history
Open Analytics
Current Use
Lease Details
Yes
Highway access
Location Intelligence
Trade Area within ½ mile
1,039
Businesses Nearby
98k
Monthly Visits Nearby
Explore this area
Business Placement
Foot Traffic Nearby
Dining 34%
Apparel 33%
Groceries 27%
Shops & Services 6%
Ross Dress for Less
Apparel
32,912 visits/mo
0.5 miles
Aldi
Groceries
26,577 visits/mo
0.5 miles
Panda Express
Dining
22,027 visits/mo
0.5 miles
Chipotle Mexican Grill
Dining
7,519 visits/mo
0.5 miles
Napa Auto Parts
Shops & Services
3,790 visits/mo
0.5 miles
Demographics for 33442, FL
32,340
Population
21,595
Households
1.5
Avg Household Size
52
Median Age
32%
College-Educated
92%
High-School Grad
6.9 sq mi
ZIP Area
4,687
Density / Sq Mi
$53,413
Median Household Income
$42,035
Median Earnings
$1,952
Median Rent
$231,400
Median Home Value
Check the figures for this property
Cap Rate, Value Estimation, Potential NOI and more
View Realmo Analytics
Market
Vacancy Rate% for Retail in South region








Frequently Asked Questions
What type of property is this?
Retail space - Two freestanding retail buildings zoned B-1 with on-site parking and rear service access for loading.
Where is this retail space located?
The property is located at 336 & 342 South Powerline Road Deerfield Beach, FL.
What is the asking price?
The asking price for this property is $1,750,000.
What are key features of this property?
This property features: Offered as two freestanding retail buildings totaling 4,504 SF; B‑1 zoning allows a variety of commercial uses; Strong frontage along S Powerline Road


