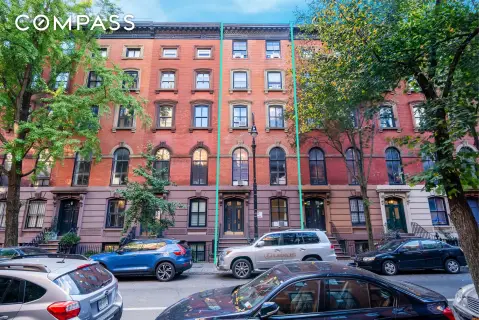
Renovated Detached Multi-Family
For Sale
Contact for pricing
336 East 16th Street, New York, NY 10003
Renovated detached home with multiple residential levels and updated systems, including new 2026 heating and water equipment.
Property Size2,860 SF
Price / SF$926.57
Days on Market148
Property Features for 336 East 16th Street
General Information
Standard status
Active
Size
2,860 SF
Property subtype
Multifamily
Zoning
r3x
Site & Location
Neighborhood
South Slope
Additional Details
Multifamily Units
3
Building Details
Year Built
1920
Year Renovated
2017
Buildings
1
Stories
3
Tenancy
Multi
Listing Agency:
Landmark International Real Estate
Listed By:
Dongyue Niu · License #10401282827
(347) 870-1239
Source:
Crexi
Added: May 29
Changed: Oct 15
Last Checked: Oct 23 at 3:59AM
Displayed information is deemed reliable but is not guaranteed and should be independently verified. All listing content including descriptions, pricing, images are the copyrighted material of Landmark International Real Estate

Ask AI about this property
Review the available facts, identify missing information and prepare questions for the agent.
Investment Insights
Based on property information with market context.
This renovated detached residence is set up as a multi-level income property with distinct living spaces. The first floor features three spacious bedrooms and includes a fully renovated kitchen and bathroom. New plumbing and electrical were installed throughout the home as part of the 2017 renovation. The second floor provides a separate two-bedroom apartment, while the third floor includes a stand-up attic with a one-bedroom apartment. A separate, own entrance is also described for the basement.
The property is located in the Ditmars Park area, with walking distance access to the Q train at Cortelyou Rd. The public remarks also note ample nearby shopping, supporting everyday convenience for tenants.
For prospective buyers, this configuration may appeal to those seeking an owner-occupant or investor opportunity centered on a renovated detached structure with updated major systems. With heating and hot water equipment replaced at the beginning of 2026, the home offers clear, documented improvements. The multi-level layout can provide flexibility for tenants who want separate spaces within the same building.
The property is located in the Ditmars Park area, with walking distance access to the Q train at Cortelyou Rd. The public remarks also note ample nearby shopping, supporting everyday convenience for tenants.
For prospective buyers, this configuration may appeal to those seeking an owner-occupant or investor opportunity centered on a renovated detached structure with updated major systems. With heating and hot water equipment replaced at the beginning of 2026, the home offers clear, documented improvements. The multi-level layout can provide flexibility for tenants who want separate spaces within the same building.
Key Highlights
- Detached home (built 1920) with multiple residential levels, including basement with separate own entrance
- Owner fully renovated the home in 2017, including a fully renovated kitchen and bathroom
- First floor offers 3 bedrooms and 1,225 sqft
Financial Insights
Estimated NOI and Cap Rate
NOI / Yr
$96,793
Cap Rate
3.65%
Suggested Prices Based on Cap Rates
Cap Rate 5%
$1,935,860
$1.9M
Cap Rate 7%
$1,382,757
$1.4M
Cap Rate 9%
$1,075,478
$1.1M
Market Conditions
NOI Build-Up for 2,860 SF
Gross rent
$145.9K $51.00/SF
− Vacancy
−$7.6K −$2.65/SF
EGI
$138.3K $48.35/SF
− OpEx
−$41.5K −$14.50/SF
NOI
$96.8K $33.84/SF
Area
New York, NY
Vacancy
5.20%
Lease Rate
$51.00 /SF/Yr
Expense Ratio
30.00%
Simulate Cap Rate and NOI
Suggested Prices Based on Cap Rates
Cap Rate 5%
$1,935,860
Cap Rate 7%
$1,382,757
Cap Rate 9%
$1,075,478
Alternative Uses
Best Use
Multifamily LT 5
$1.38M
$1.21M – $1.61M
NOI $96,793 @ 7.0% cap · market cap 3.65%
Second Best
Apartment 5plus
$1.28M
$1.12M – $1.49M
NOI $89,482 @ 7.0% cap · market cap 3.38%
Theoretical Best
Specialty Retail
$7.12M
$6.23M – $8.31M
NOI $498,326 @ 7.0% cap · market cap 18.80%
Zoning and permitted uses should be independently verified with authorities.
How Realmo checks its estimates
Property Analytics
Contact the owner directly
Get the owner's phone numbers and email
Open Analytics
Lease Details
3
Residential units
Multi-tenant
Tenancy
Location Intelligence
Trade Area within ½ mile
5,124
Businesses Nearby
Explore this area
Business Placement
Demographics for 10003, NY
57,076
Population
30,730
Households
1.9
Avg Household Size
32
Median Age
82%
College-Educated
96%
High-School Grad
0.6 sq mi
ZIP Area
95,127
Density / Sq Mi
$153,750
Median Household Income
$82,560
Median Earnings
$2,772
Median Rent
$1,137,000
Median Home Value
Check the figures for this property
Cap Rate, Value Estimation, Potential NOI and more
View Realmo Analytics
Market
Vacancy Rate% for Multifamily in Northeast region



Frequently Asked Questions
What type of property is this?
Quadplex - Renovated detached home with multiple residential levels and updated systems, including new 2026 heating and water equipment.
Where is this quadplex located?
The property is located at 336 East 16th Street New York, NY.
What is the asking price?
The asking price for this property is $2,650,000.
What are key features of this property?
This property features: Detached home (built 1920) with multiple residential levels, including basement with separate own entrance; Owner fully renovated the home in 2017, including a fully renovated kitchen and bathroom; First floor offers 3 bedrooms and 1,225 sqft


