Renovated Three-Unit Residential
325 Woodford Street Portland, ME 04103
325 Woodford Street, Portland, ME, 04103
$948,000
For Sale
$948,000
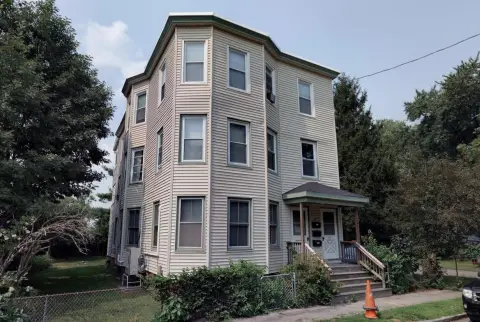
Three-unit property with multiple electrical panels and renovations, plus exterior space potentially suited for an accessory dwelling unit.
Property Size3,067 SF
Price / SF$309.10
Days on Market25
Property Features for 325 Woodford Street
General Information
- Standard status
- Active
- Size
- 3,067 SF
- Property subtype
- Multi-family
Building Details
- Year Built
- 1897
Listing agency
CENTURY 21 Advantage
Listed by
Brendan Johnson
(603) 433-3350
Source
Greatislandrealty
Added: Jun 28 Updated: Jul 21 at 7:57AM Checked: Jul 22 at 6:56AM
Displayed information is deemed reliable but is not guaranteed and should be independently verified. All listing content including descriptions, pricing, images are the copyrighted material of CENTURY 21 Advantage
Investment Insights
Based on property information with market context.
This renovated three-unit residential income property has been well maintained under current ownership and is prepared for the next owner. The building features three separate electrical panels, and much of the major work has already been completed to support a smooth transition.
The first-floor unit includes hardwood floors, custom trim, and a fully remodeled kitchen. The upper-level unit offers exposed beams, while the remaining spaces have been updated with an emphasis on both functionality and finishes. Outside, there is generous space for gathering, gardening, or exploring the potential for a future accessory dwelling unit, subject to city approvals.
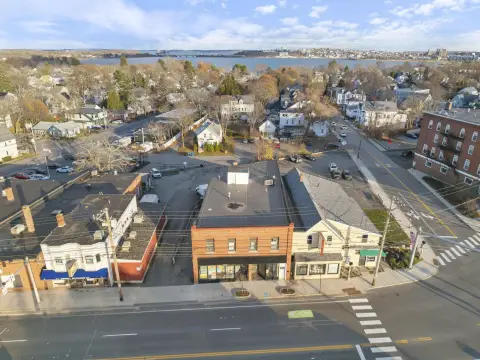
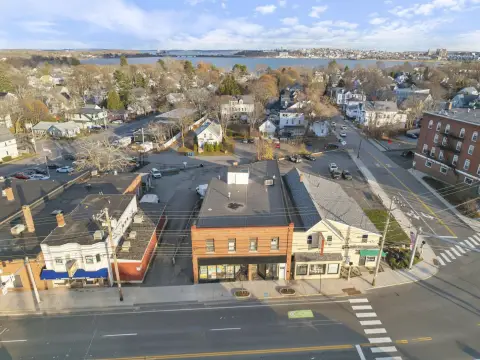
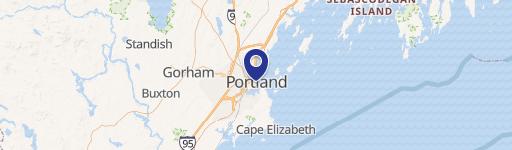
Located in Portland’s Deering Center neighborhood, the property is just moments from local shops, restaurants, schools, and everyday amenities, with proximity to both 295 and 95 for travel throughout Greater Portland and beyond.
The first-floor unit includes hardwood floors, custom trim, and a fully remodeled kitchen. The upper-level unit offers exposed beams, while the remaining spaces have been updated with an emphasis on both functionality and finishes. Outside, there is generous space for gathering, gardening, or exploring the potential for a future accessory dwelling unit, subject to city approvals.
Located in Portland’s Deering Center neighborhood, the property is just moments from local shops, restaurants, schools, and everyday amenities, with proximity to both 295 and 95 for travel throughout Greater Portland and beyond.
Key Highlights
- Three‑unit property built in 1897 in Portland’s Deering Center neighborhood
- Renovated and well maintained; much of the major work already completed during current ownership
- Three separate electrical panels
Local Financial Insights For Multifamily LT 5
Simulate Cap Rate and NOI
NOI Build-Up
- Vacancy
- income lost from leasable area expected to sit empty during the year — subtracted from gross rent.
- EGI (Effective Gross Income)
- gross rent minus vacancy losses — the realistic income before paying operating costs.
- OpEx (Operating Expenses)
- recurring costs to operate the property (property tax, insurance, utilities, maintenance, management) — excludes financing and capital improvements.
- NOI (Net Operating Income)
- income a property generates after operating costs but before financing and taxes.
| Component | $ | $/SF |
|---|---|---|
| Gross rent | $82.8k | $27.00 |
| − Vacancy | −$5.4k | −$1.76 |
| EGI | $77.4k | $25.25 |
| − OpEx | −$23.2k | −$7.57 |
| NOI | $54.2k | $17.67 |
3,067 SF · lease $27.00/SF/yr · vacancy 6.50% · expense 30.00%
Alternative Uses
Best Use
Multifamily LT 5
$774.3K
$677.5K – $903.3K
NOI $54,198 @ 7.0% cap · market cap 5.72%
Second Best
Apartment 5plus
$720.3K
$630.3K – $840.4K
NOI $50,423 @ 7.0% cap · market cap 5.32%
Theoretical Best
Office A
$843.0K
$737.6K – $983.5K
NOI $59,008 @ 7.0% cap · market cap 6.22%
Zoning and permitted uses should be independently verified with local authorities.
Property Analytics
Location Intelligence
Current Use by Public Records
Triplexes
Similar For Sale Nearby
FAQs
What type of property is this?
Triplex - Three-unit property with multiple electrical panels and renovations, plus exterior space potentially suited for an accessory dwelling unit.
Where is this triplex located?
The property is located at 325 Woodford Street Portland, ME.
What is the asking price?
The asking price for this property is $948,000.
What are key features of this property?
This property features: Three‑unit property built in 1897 in Portland’s Deering Center neighborhood; Renovated and well maintained; much of the major work already completed during current ownership; Three separate electrical panels


