Modern Two-Bedroom

For Sale
$221,000
3231 NW 52ND AVENUE Road, Ocala, FL 34482
Residential, OCALA, FL
Property Size1,562 SF
Lot Size0.10 Acres
Price / SF$141.49
Days on Market68
Property Features for 3231 NW 52ND AVENUE Road
General Information
Property type
Residential Multi Family
Property subtype
Duplex
Zoning
PUD
Bedrooms
2
Bathrooms
2
Full bathrooms
2
Rooms
Bedroom 2, Bathroom 2, Dining Room, Bathroom 1, Bedroom 1
Parking features
Oversize
Pets allowed
Yes
Interior features
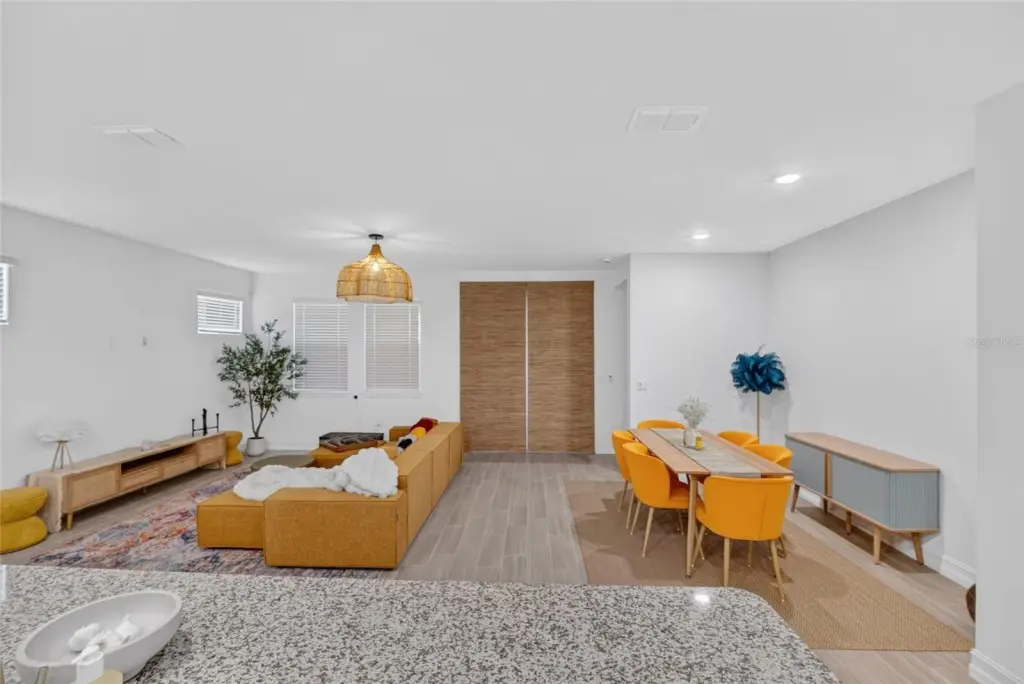
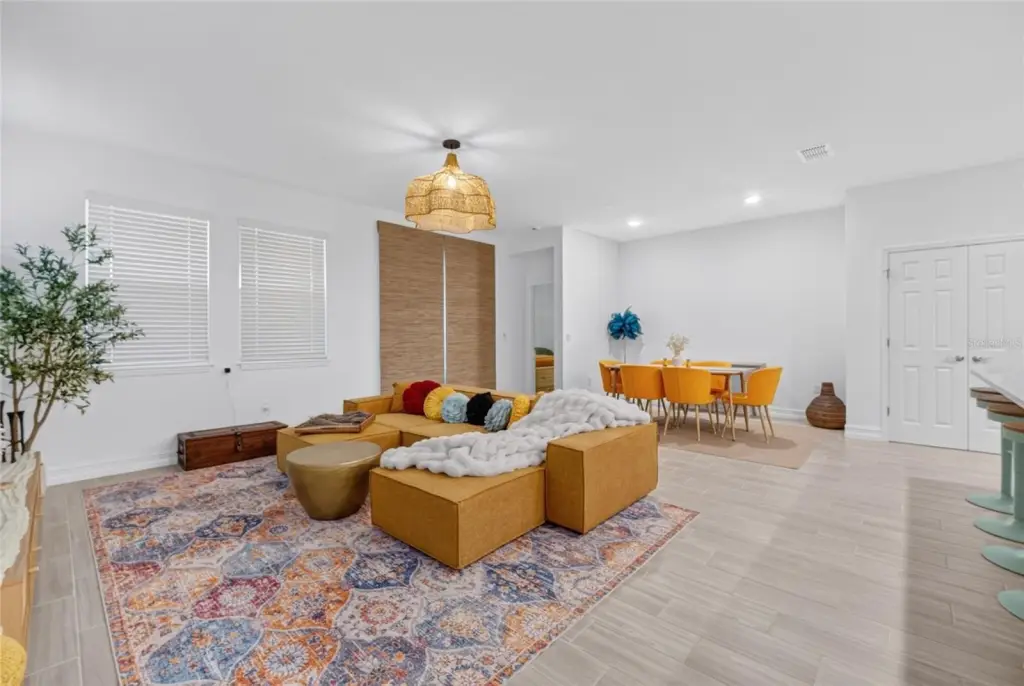
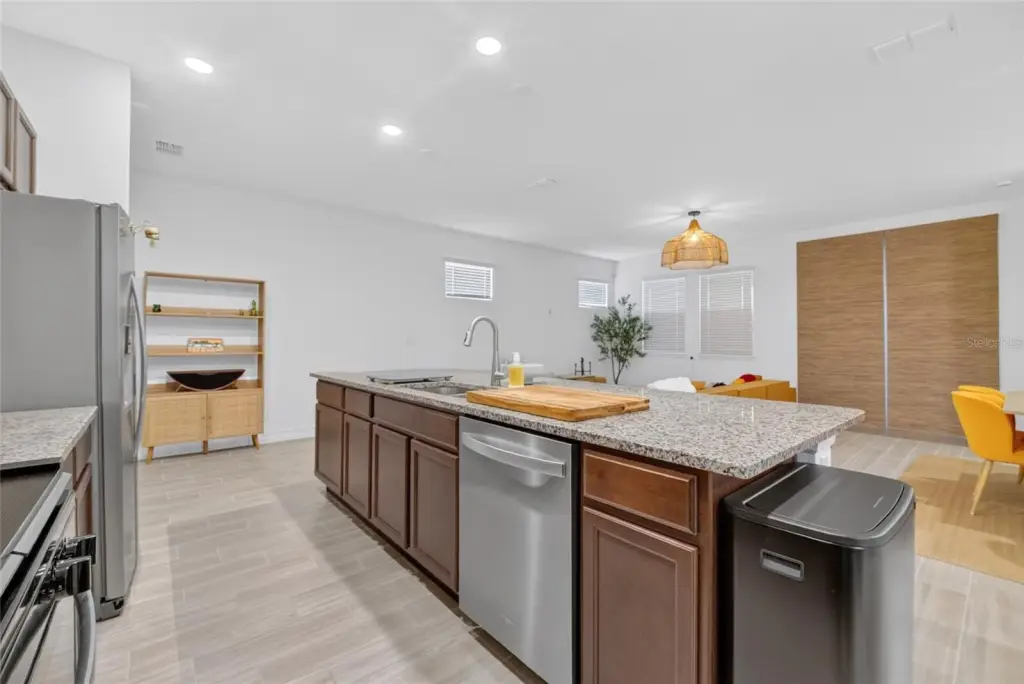
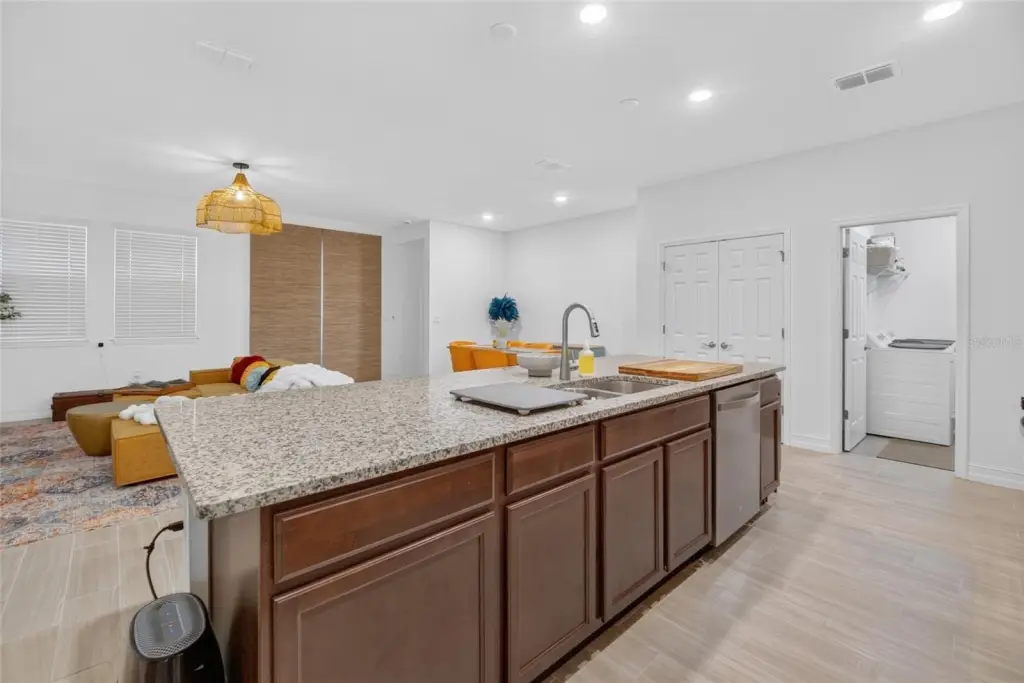
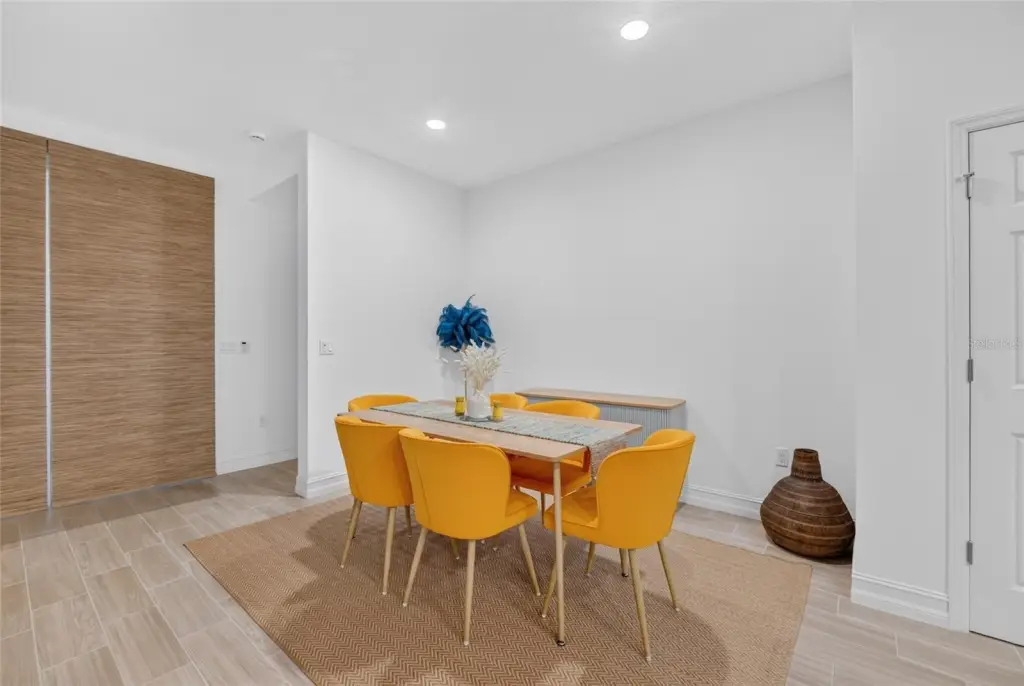
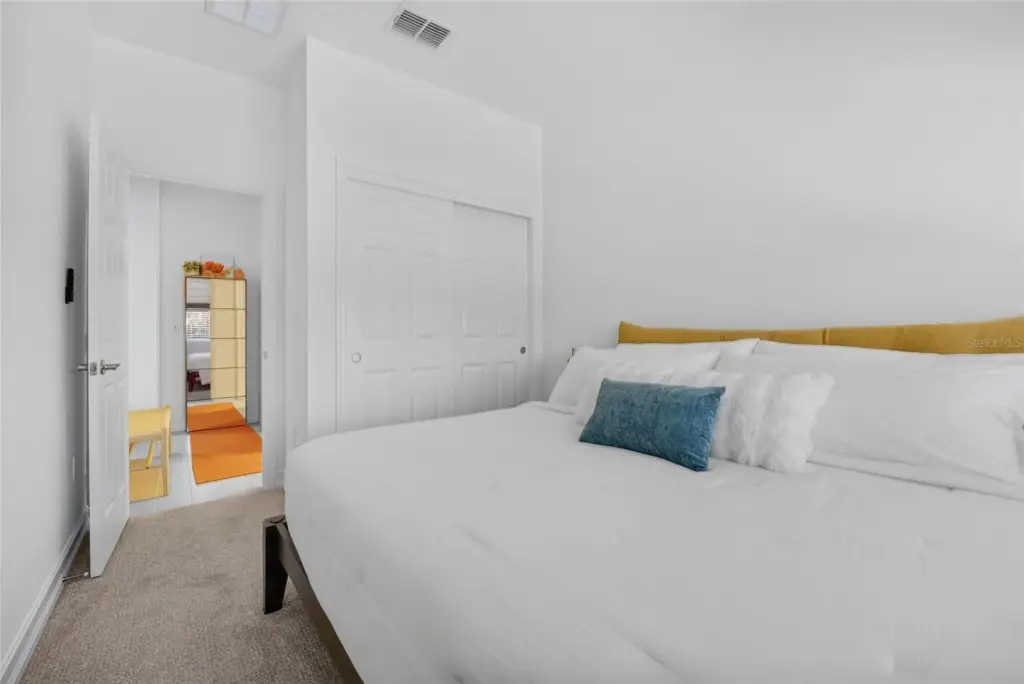
Ceiling Fans(s), High Ceilings, Living Room/Dining Room Combo, Primary Bedroom Main Floor, Smart Home, Solid Wood Cabinets, Split Bedroom, Stone Counters, Thermostat, Walk-In Closet(s), Window Treatments
Exterior features
Rain Gutters, Sidewalk
Appliances
Dishwasher, Dryer, Microwave, Range, Refrigerator, Tankless Water Heater, Washer, Water Filtration System
Subdivision
OCALA PRESERVE PH 18B
Lot features
Cleared, Corner Lot, Sidewalk, Street Dead- End, Paved, Private
Elementary school
College Park Elementary School
Middle school
Howard Middle School
High school
West Port High School
Directions
Take US-27 N to turn right onto NW 55th Ave. At the traffic circle, take the 1st exit & stay on NW 55th Ave, turn right onto NW 34th St & turn right onto NW 54th Ct. The destination will be on the left.
Standard status
Active
APN
1368-1334-00
Size
1,562 SF
Lot size
0.10 Acres
Taxes and HOA fees
Tax Year
2025
Tax Description
SEC 4 TWP 15 RGE 21 PLAT BOOK 015 PAGE 093 OCALA PRESERVE PHASE 18B LOT 1334
Tax Annual Amount
790
Legal Description
SEC 4 TWP 15 RGE 21 PLAT BOOK 015 PAGE 093 OCALA PRESERVE PHASE 18B LOT 1334
Utilities
Sewer type
Public Sewer
Heating system
Natural Gas
Cooling system
Central Air
Water source
Public
Amenities
gated community
smart home
whole-home water softener system
built-in alarm/security system
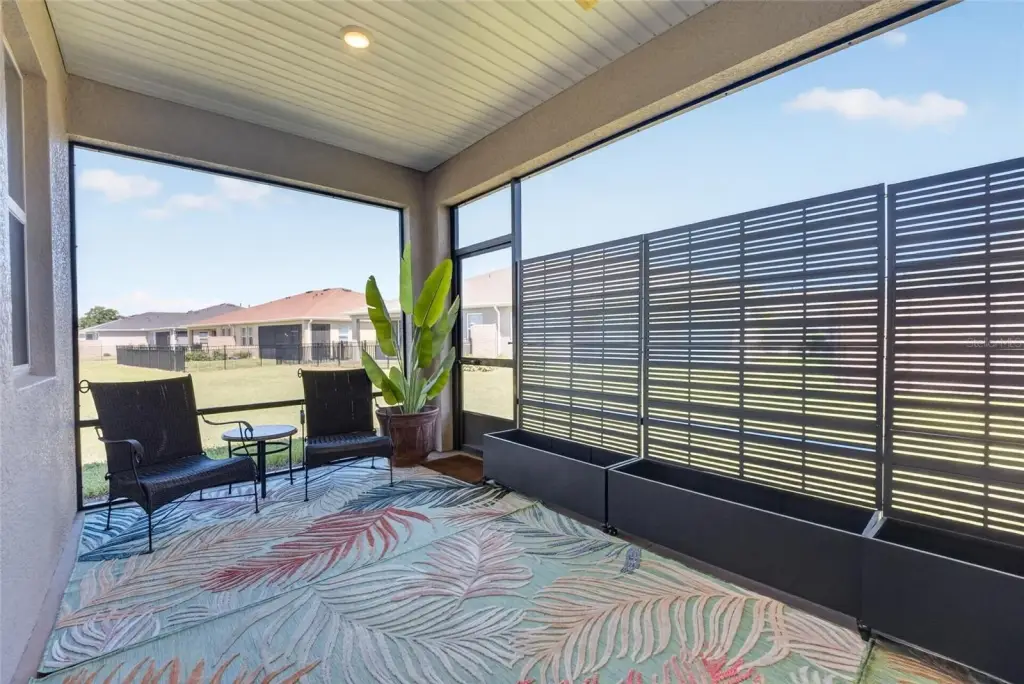
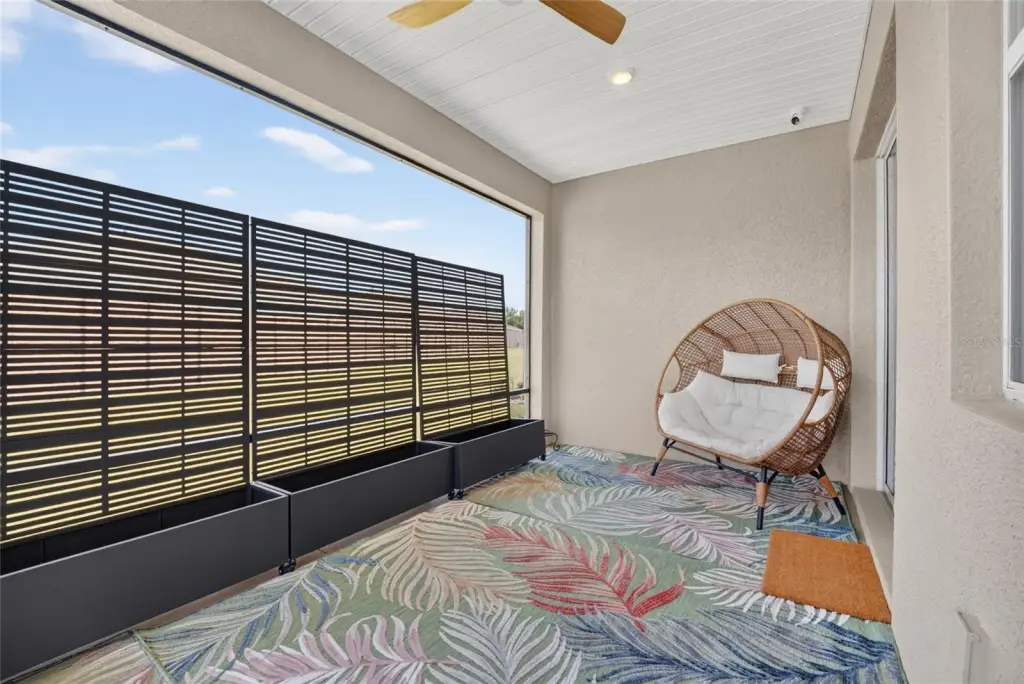
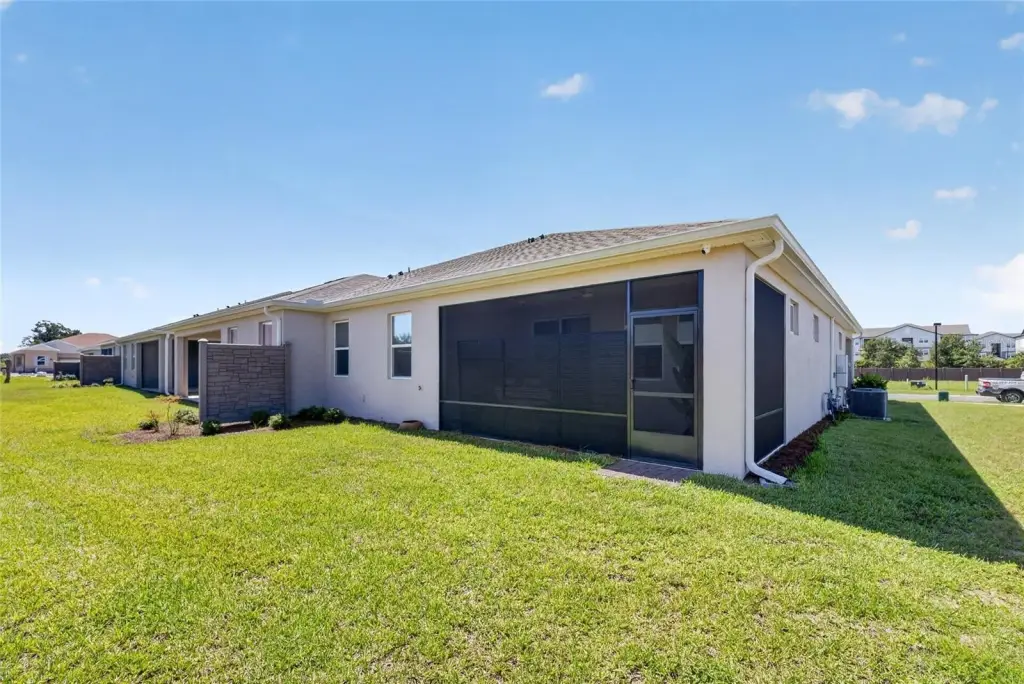
screened-in porch
clubhouse
resort pool
fitness center
on-site restaurant and bar
walking and biking trails
nature trails
dog parks
Building Details
Year built
2025
Floors in Building
1
Flooring type
Tile, Carpet
Building materials
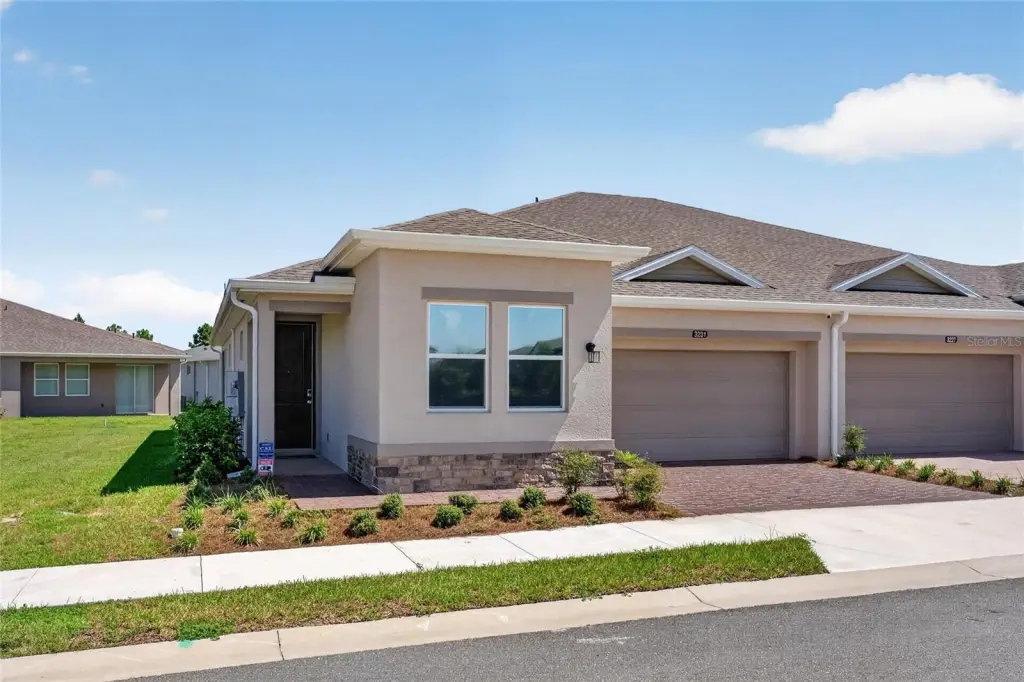
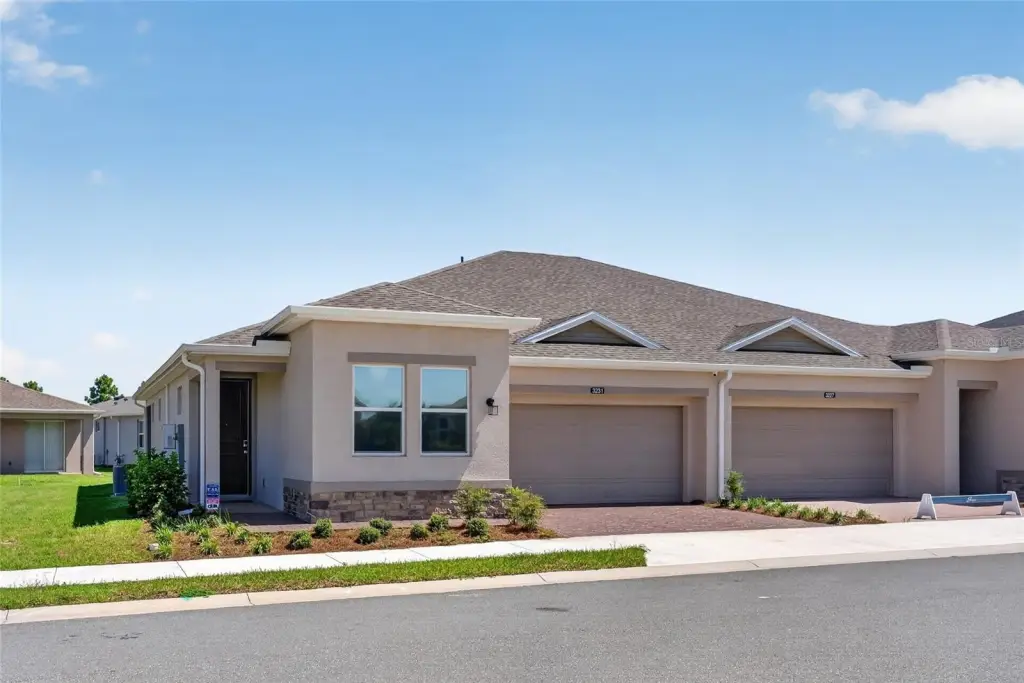
Block, Concrete, Stucco
Roof type
Shingle
Listing Agency:
COLDWELL REALTY SOLD GUARANTEE
(352) 209-0000
Listed By:
Scott Coldwell · License #3077217
(352) 387-2383
Added: Jul 27
Changed: Oct 2
Last Checked: Oct 2 at 3:06PM
MLS# OM729267
Copyright © 2026 Stellar MLS. All rights reserved. All information provided by the listing agent/broker is deemed reliable but is not guaranteed and should be independently verified.
Investment Insights
Based on property information with market context.
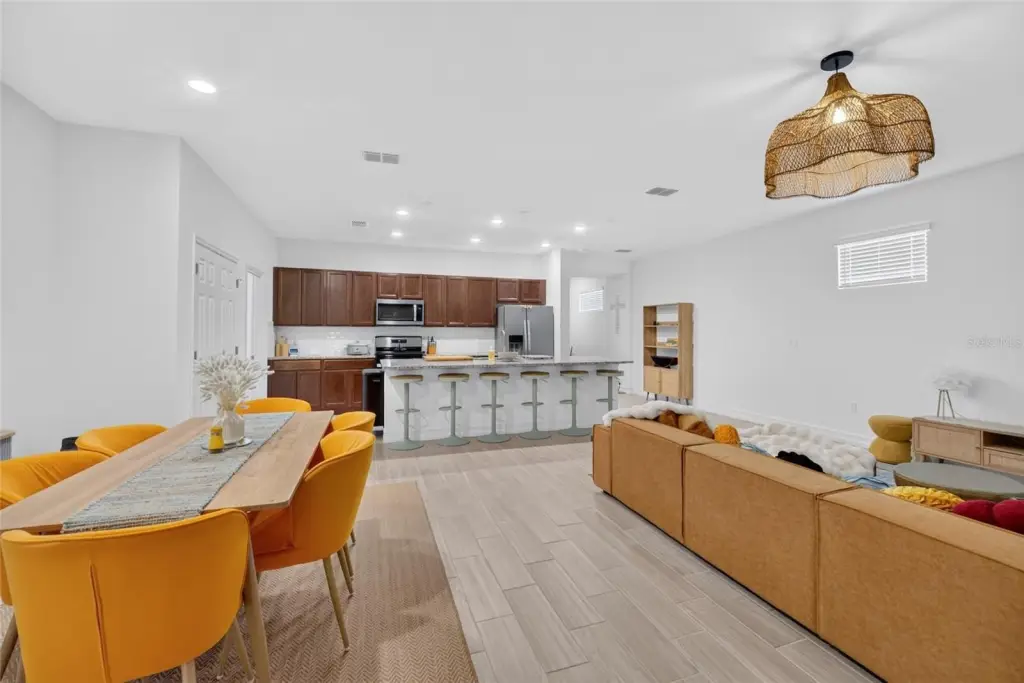
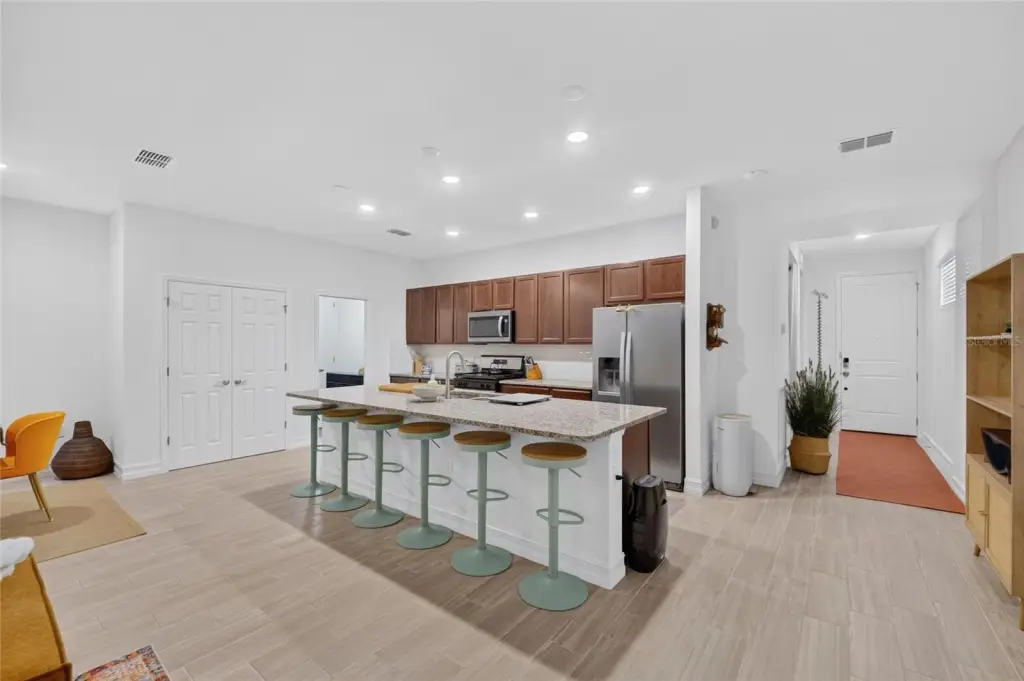
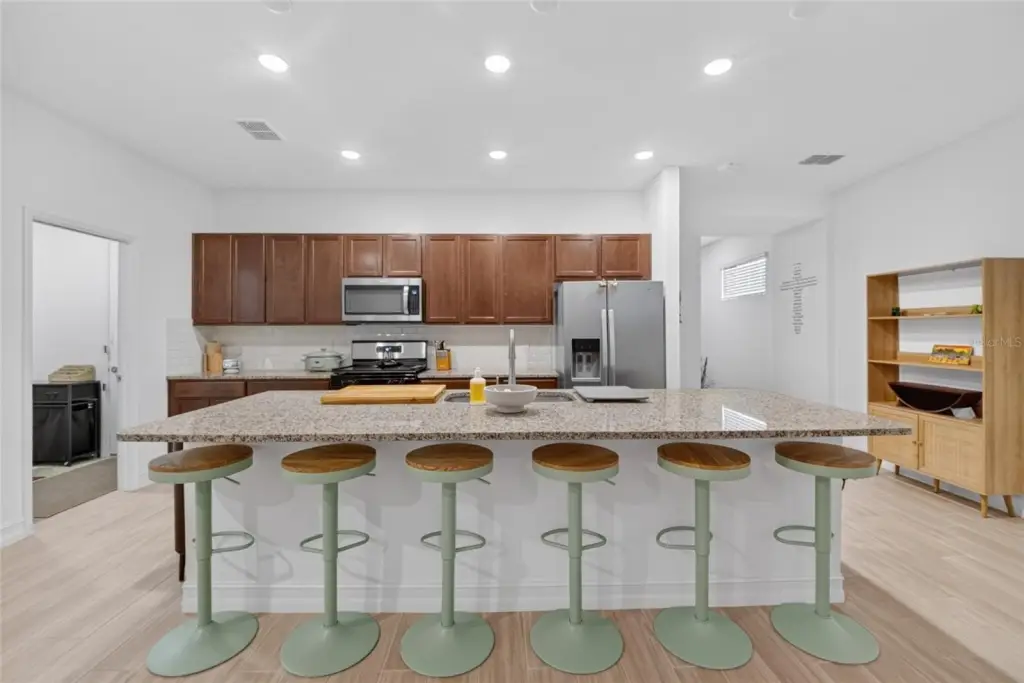
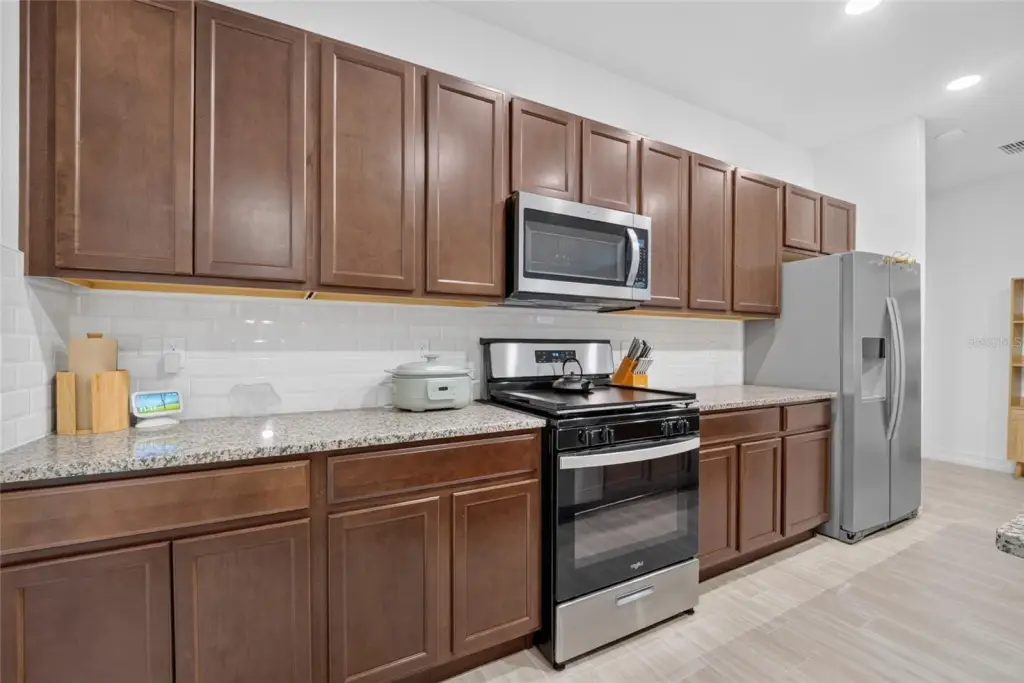
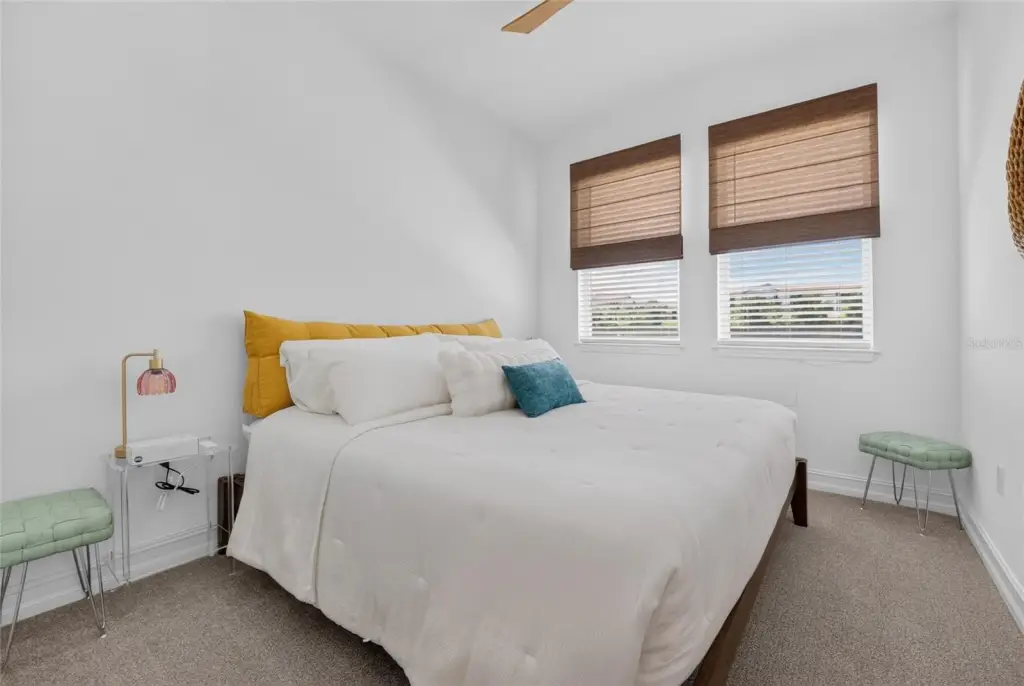
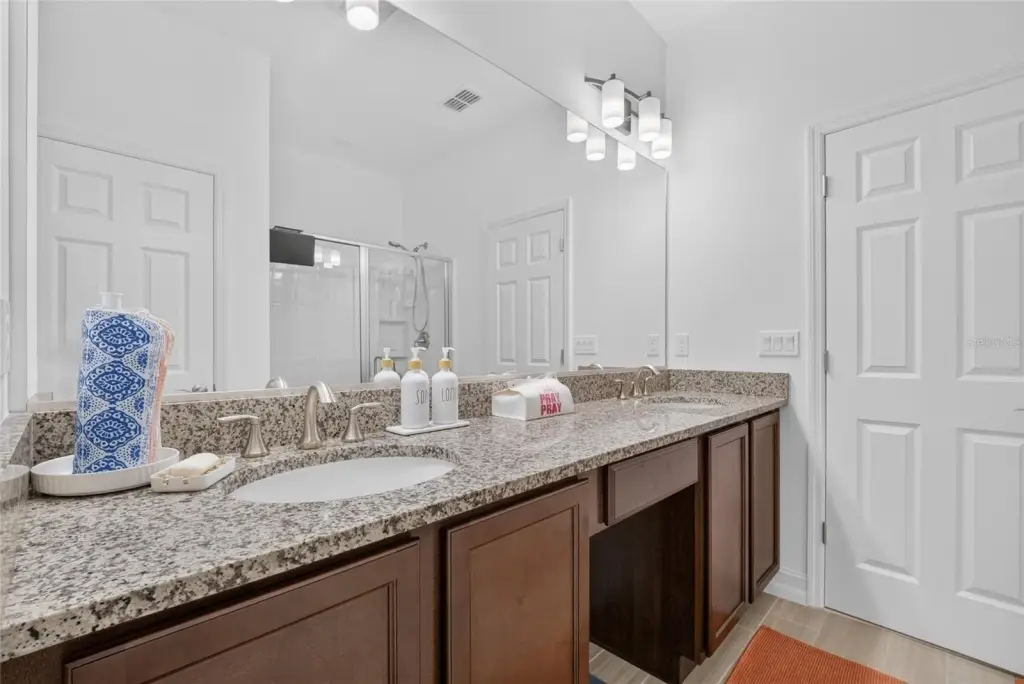
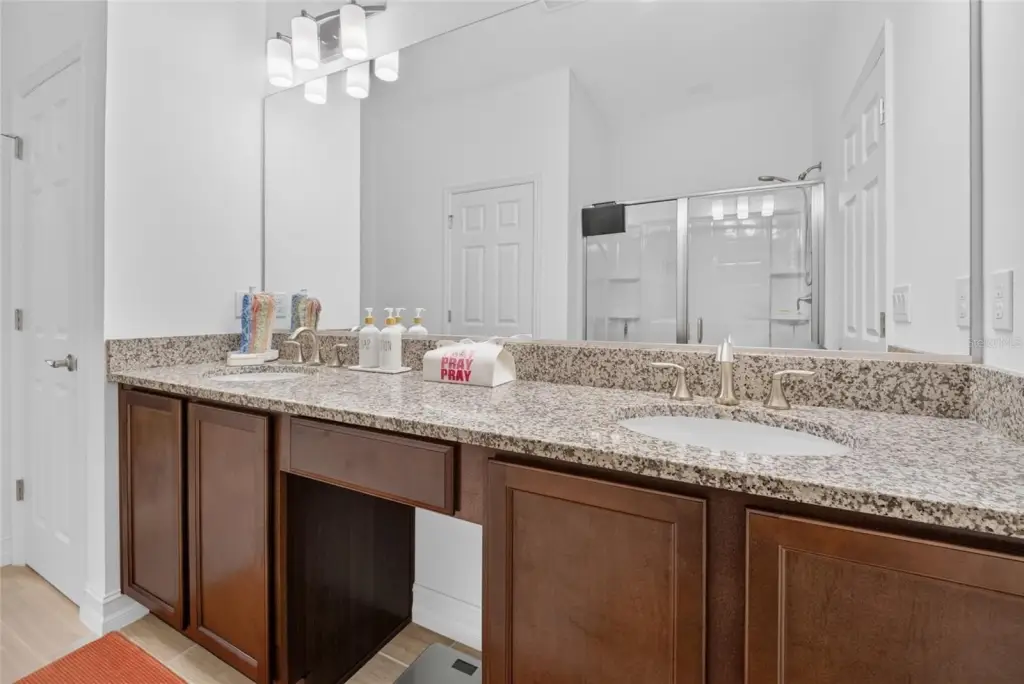
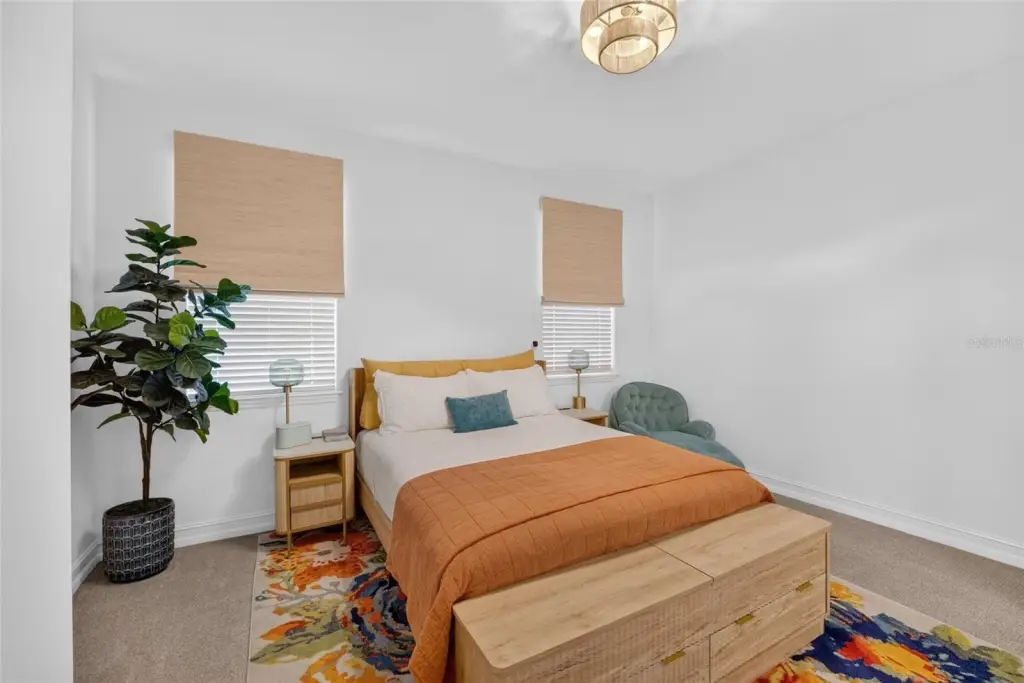
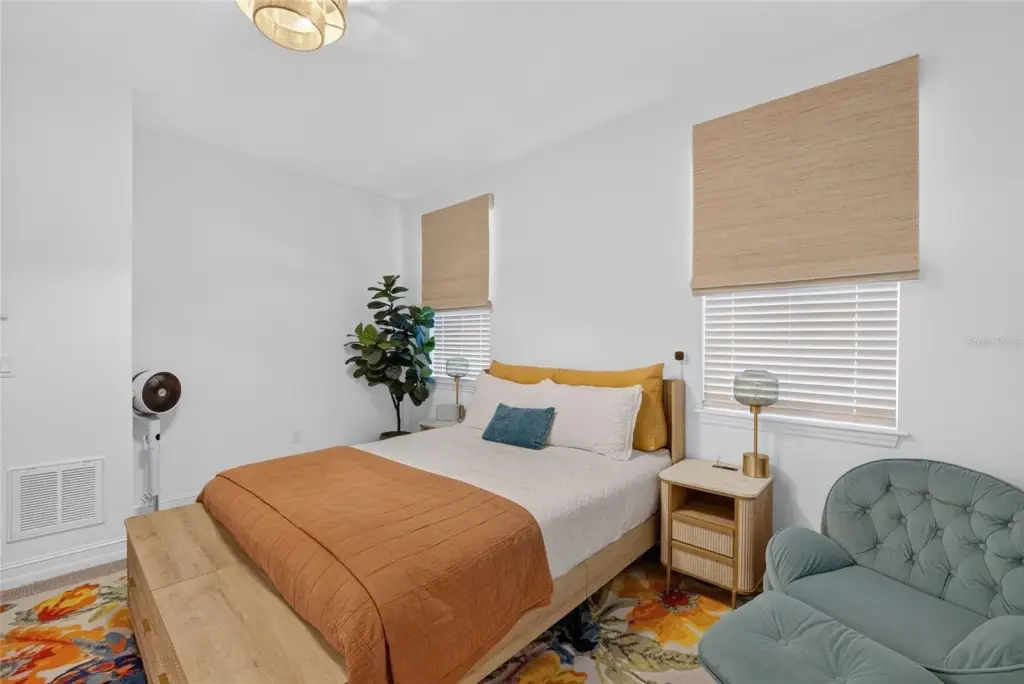
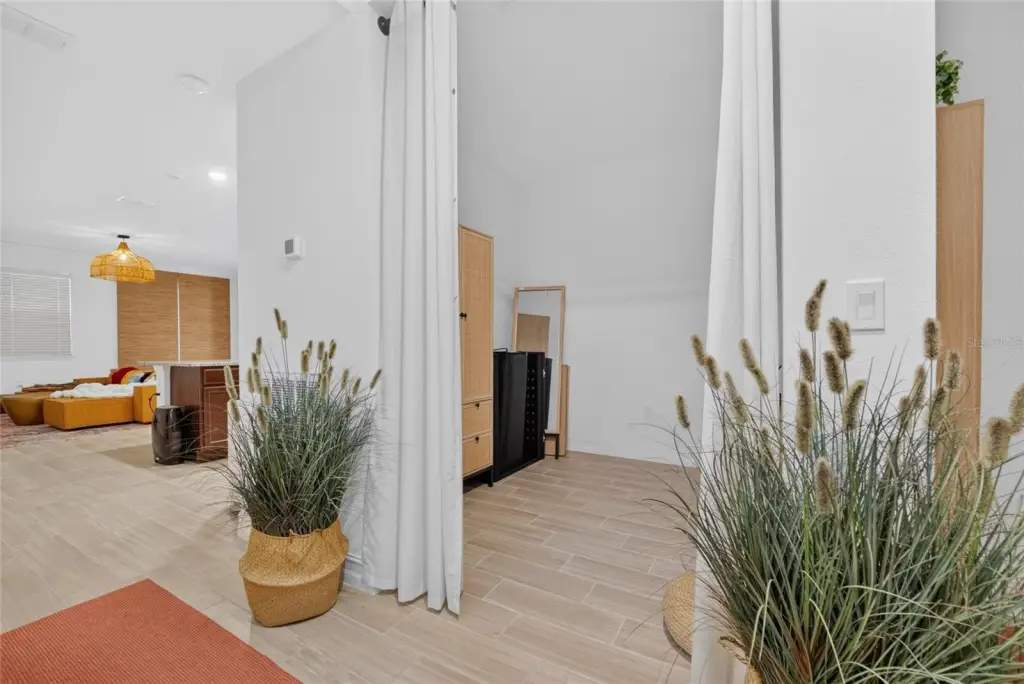
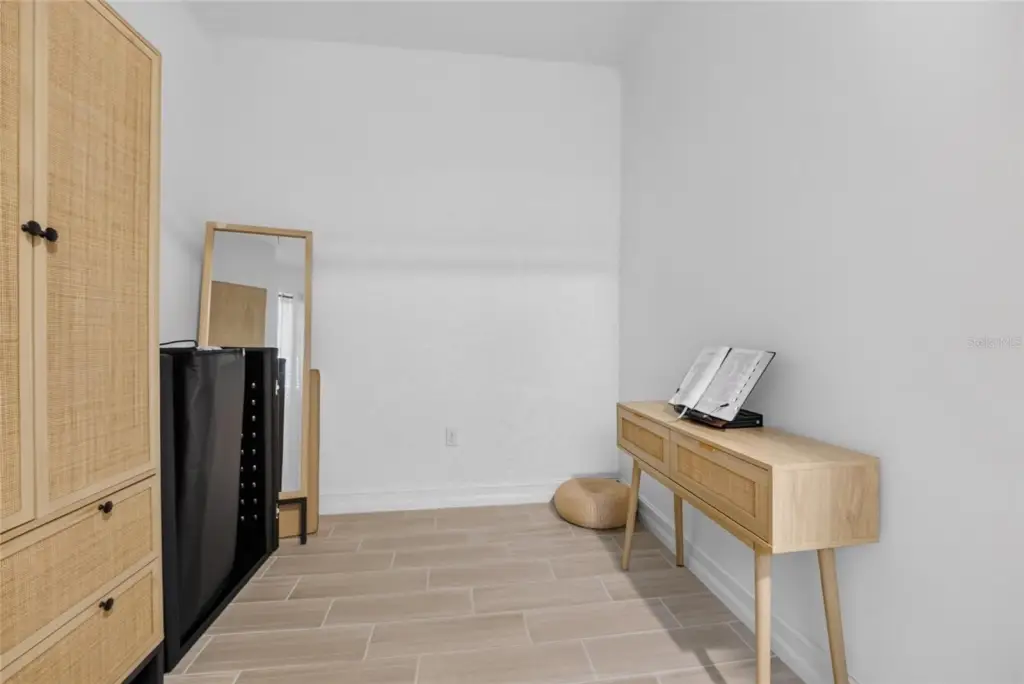
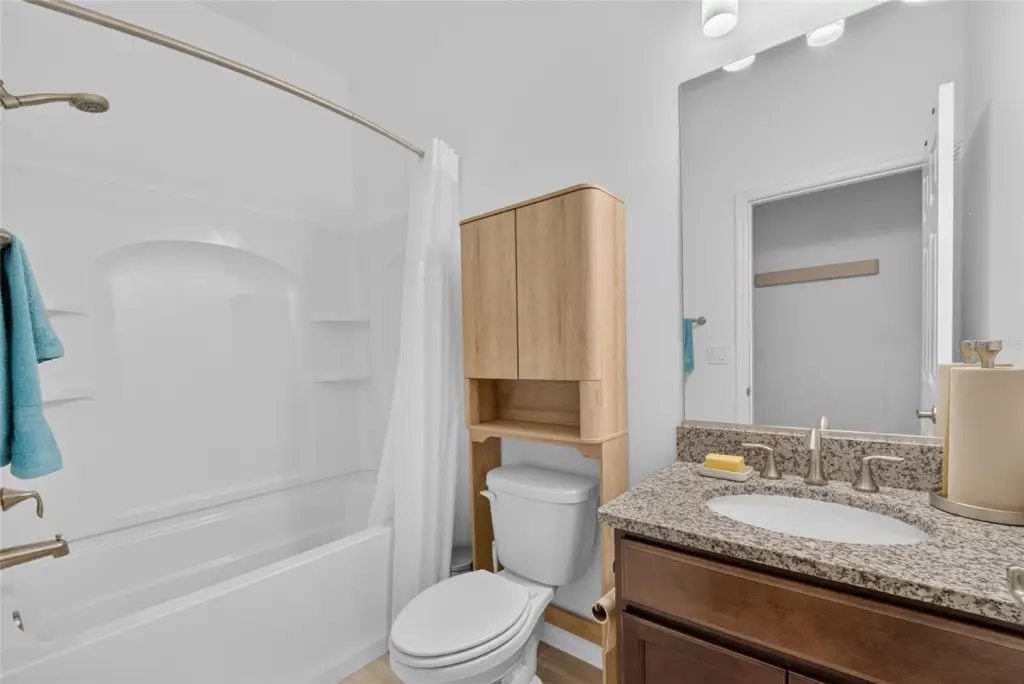
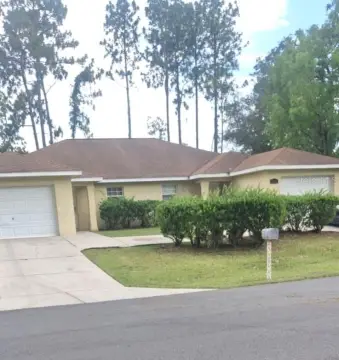
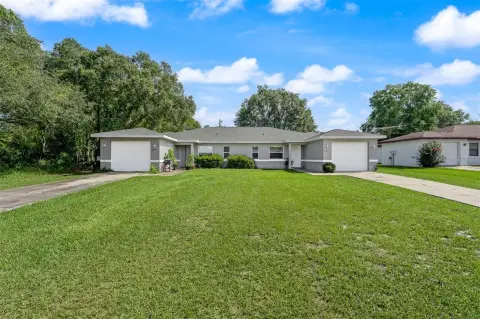
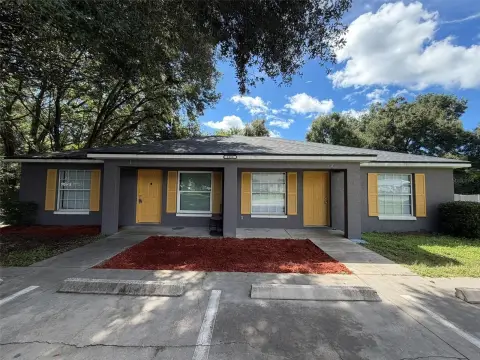
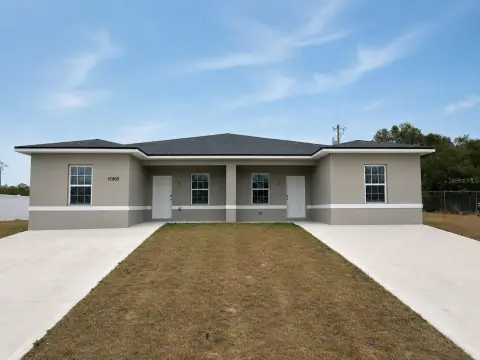
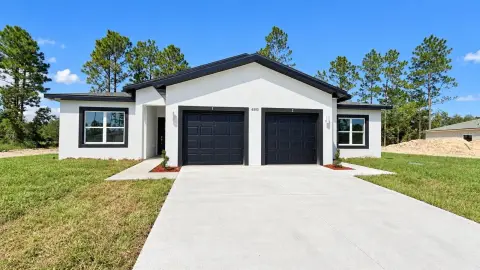
Built in 2025, this 1,562-square-foot duplex offers two bedrooms, two bathrooms, and a practical layout with a dedicated office area. Interior features include high ceilings, stone counters, solid wood cabinets, a walk-in closet, tile and carpet flooring, and a combined living and dining area. Smart-home functionality supports phone-based control of lighting, temperature, and security. The residence also includes a screened porch, whole-home water filtration, a built-in alarm system, tankless water heating, and oversized parking.
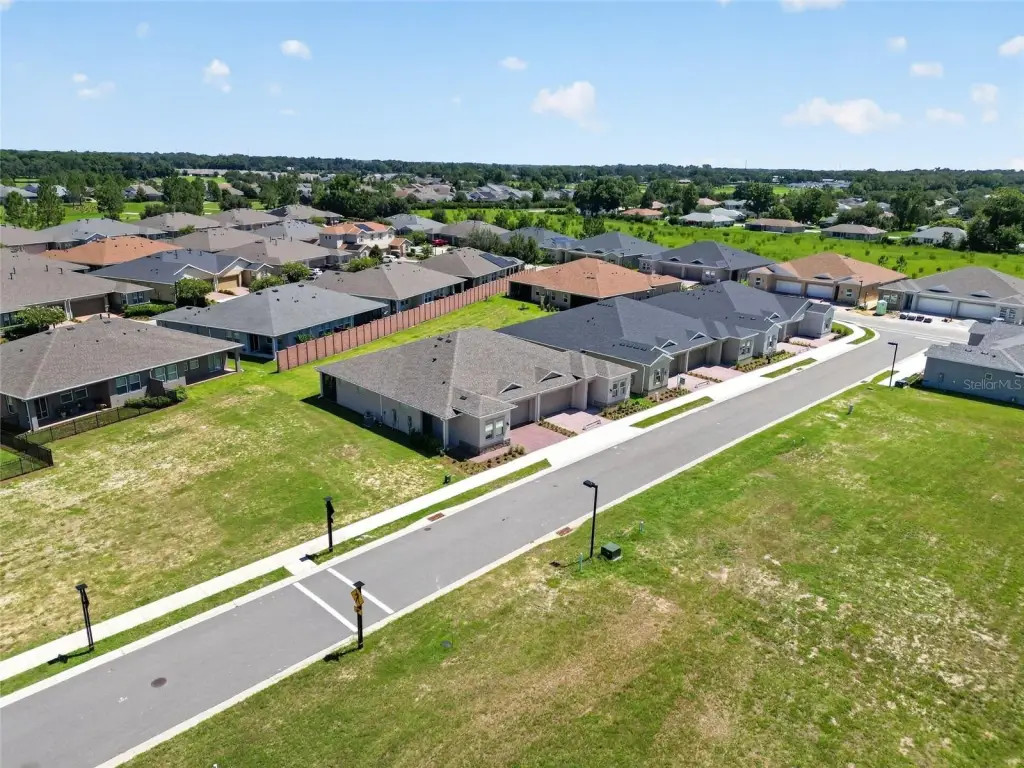
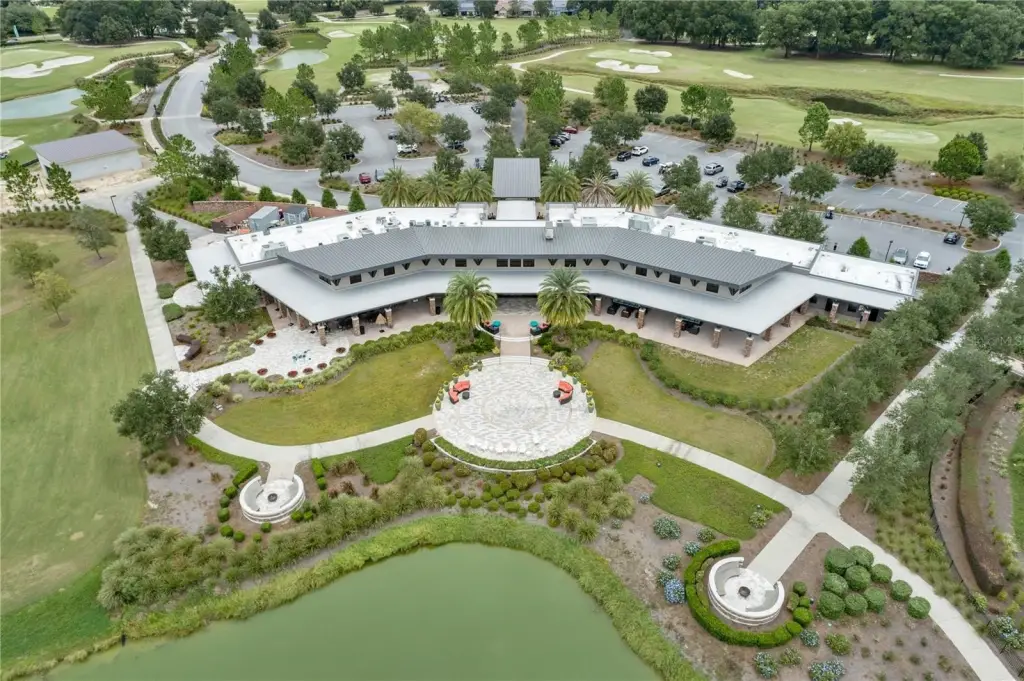
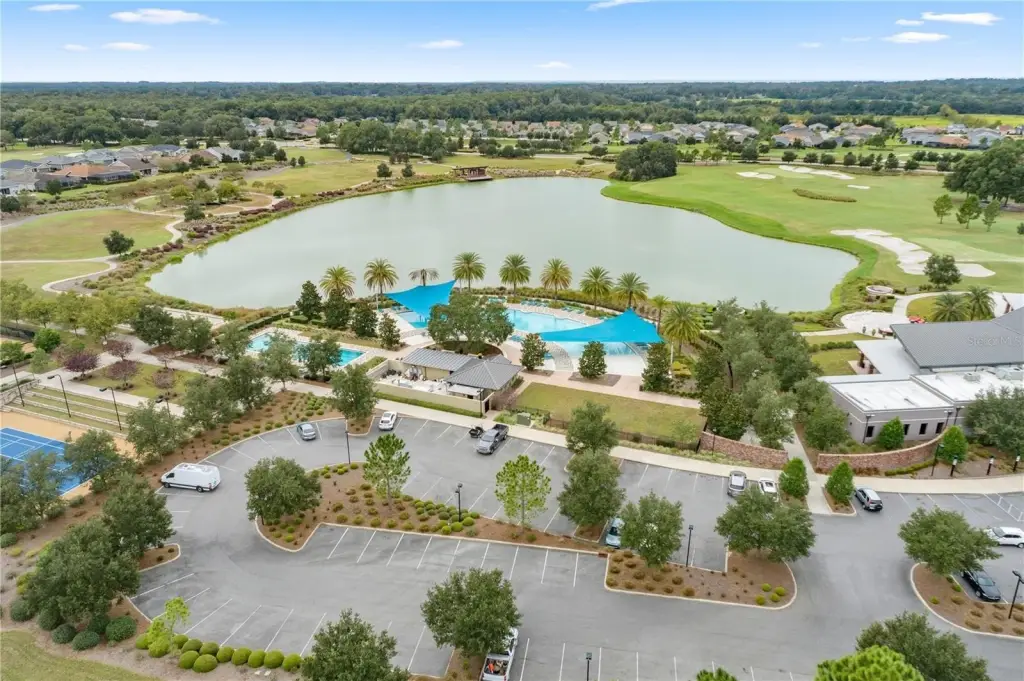
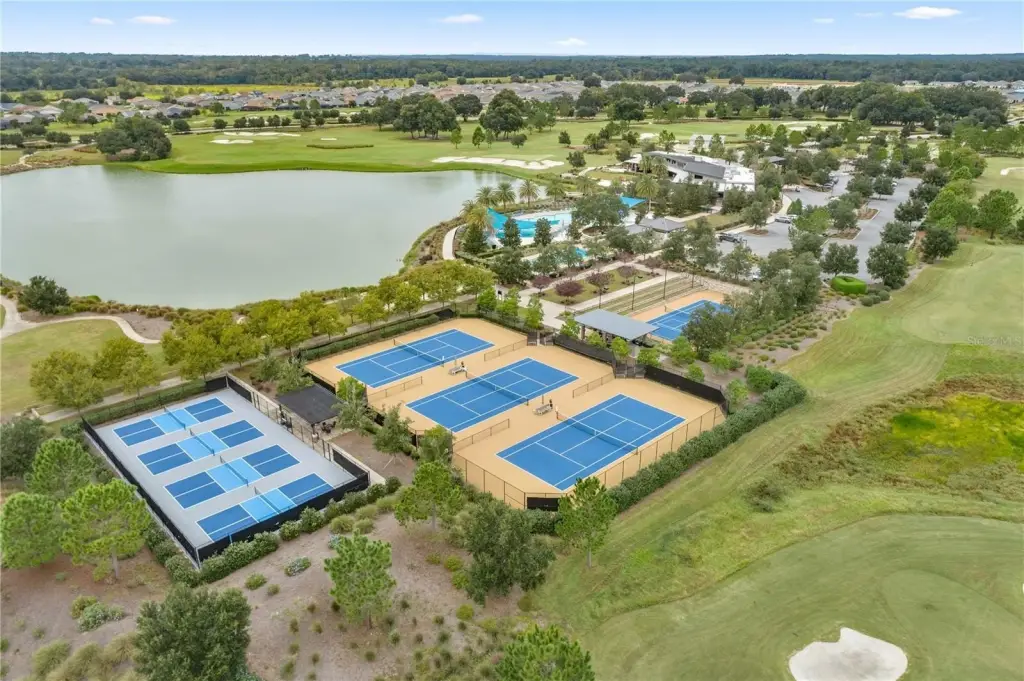
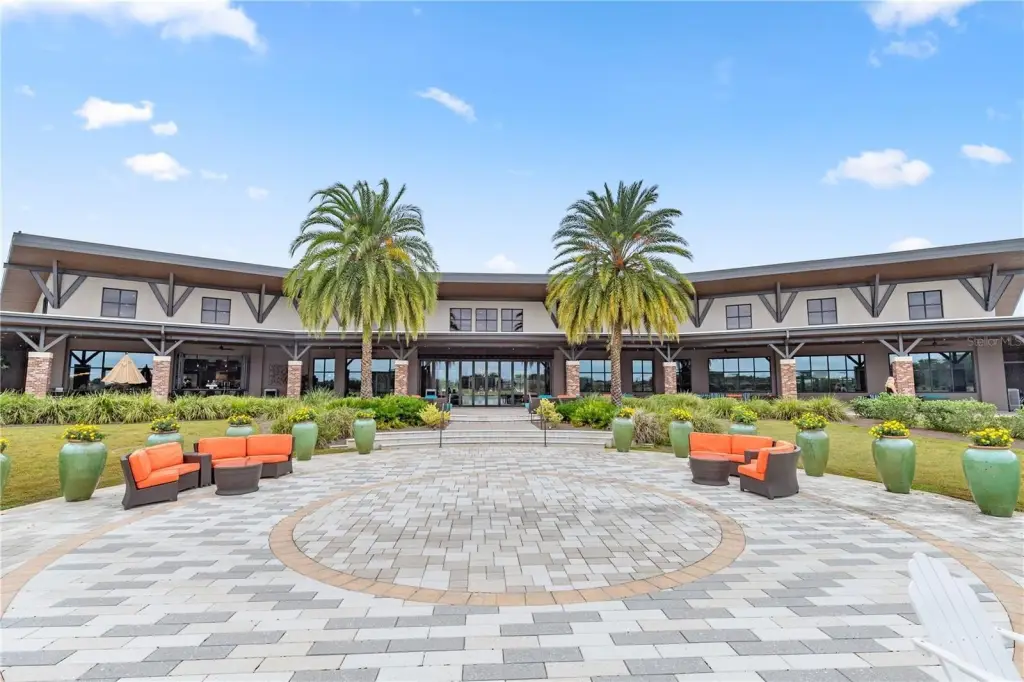
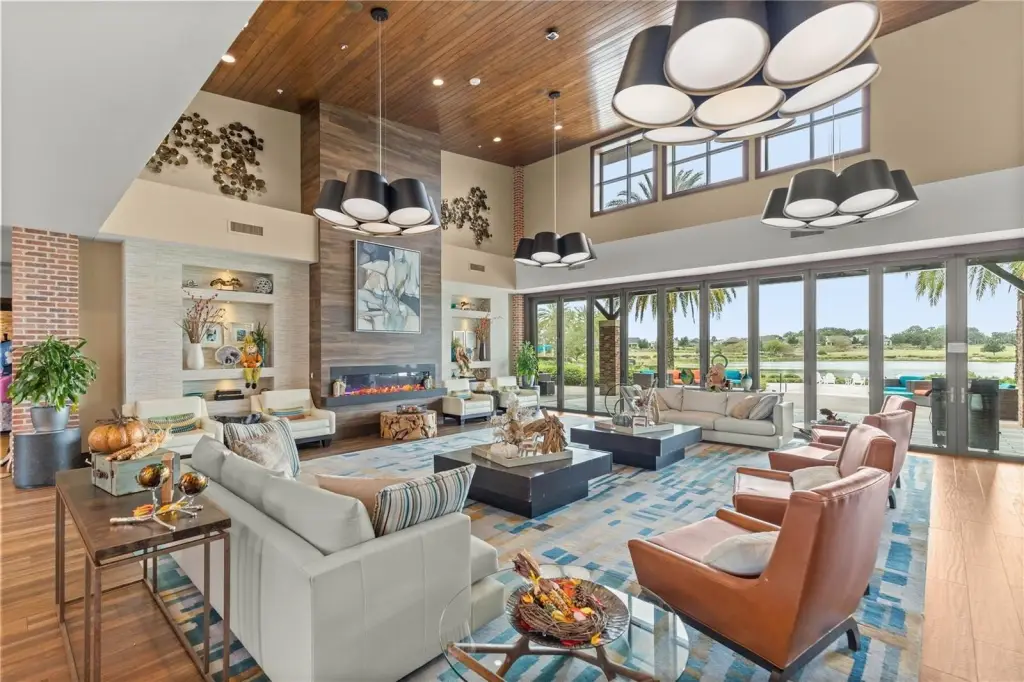
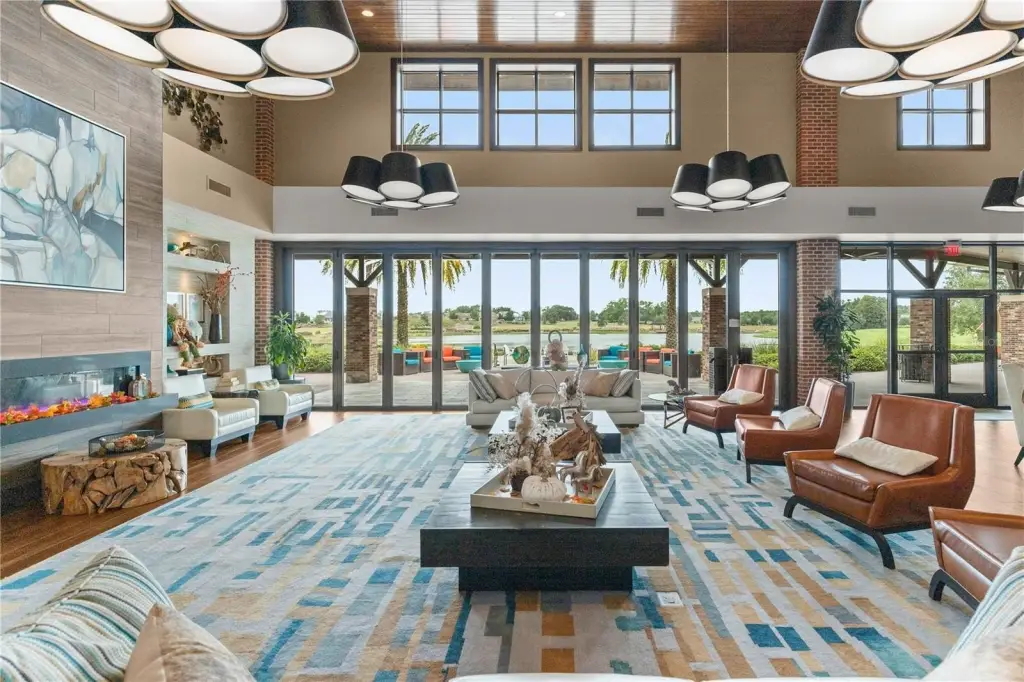
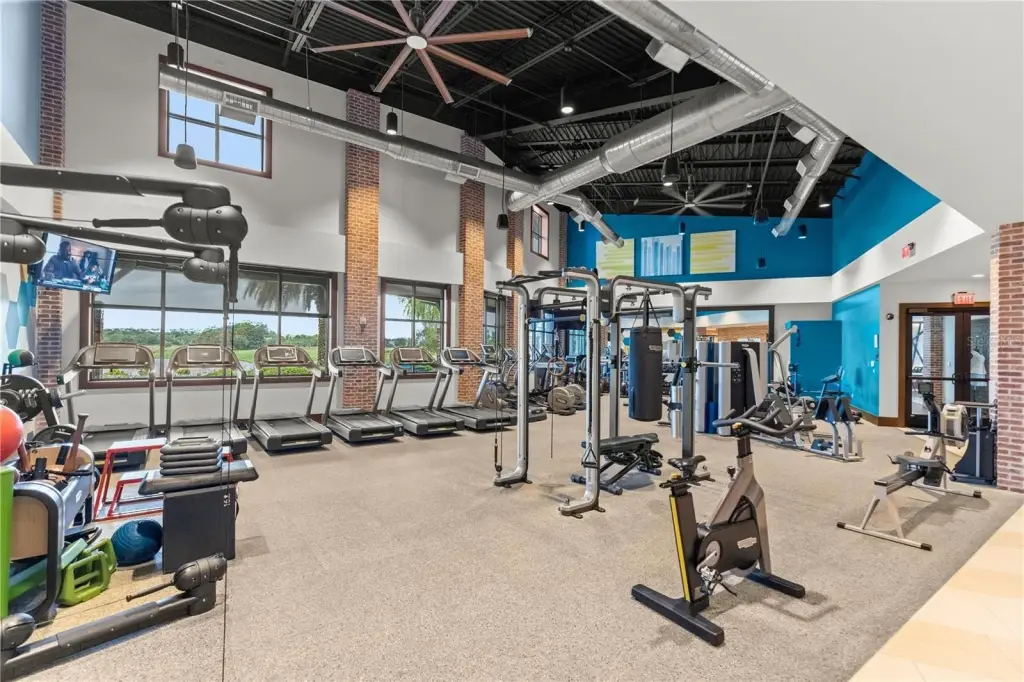
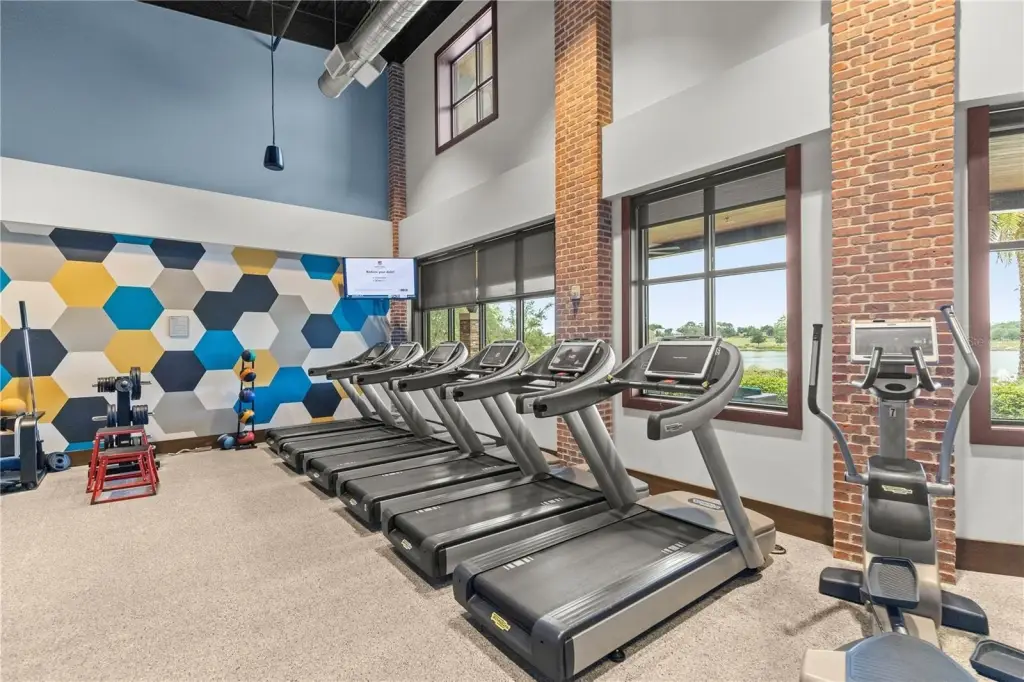
The property is located in Ocala Preserve, a planned community with a clubhouse, zero-entry resort pool, fitness center, restaurant and bar, walking and biking trails, dog parks, and scheduled social activities. Public water and sewer serve the property, with natural gas heating and central air conditioning. Furniture conveys with the sale.
The property is located in Ocala Preserve, a planned community with a clubhouse, zero-entry resort pool, fitness center, restaurant and bar, walking and biking trails, dog parks, and scheduled social activities. Public water and sewer serve the property, with natural gas heating and central air conditioning. Furniture conveys with the sale.
Key Highlights
- Two‑bedroom, two‑bathroom duplex built in 2025
- 1,562 square feet of interior space
- Located in Ocala Preserve, a planned community with resort amenities
Property Analytics
Unlock full access to Insights
Subscribe to Realmo Intelligence
Open Analytics
Current Use
Lease Details
1
Residential units
Location Intelligence
Trade Area within ½ mile
165
Businesses Nearby
Explore this area
Business Placement
Demographics for 34482, FL
23,565
Population
9,553
Households
2.5
Avg Household Size
48
Median Age
22%
College-Educated
85%
High-School Grad
93.0 sq mi
ZIP Area
253
Density / Sq Mi
$71,449
Median Household Income
$37,492
Median Earnings
$861
Median Rent
$247,600
Median Home Value
Check the figures for this property
Cap Rate, Value Estimation, Potential NOI and more
View Realmo Analytics
Market
Vacancy Rate% for Multifamily in South region

Questions? Ask Rey
Realmo’s AI knows this listing — price, zoning, demand, history. Ask anything.



Frequently Asked Questions
What type of property is this?
Duplex - Smart-home duplex with an office area, screened porch, and access to resort-style community amenities.
Where is this duplex located?
The property is located at 3231 NW 52ND AVENUE Road Ocala, FL.
What is the asking price?
The asking price for this property is $221,000.
What are key features of this property?
This property features: Two‑bedroom, two‑bathroom duplex built in 2025; 1,562 square feet of interior space; Located in Ocala Preserve, a planned community with resort amenities


