Smart Garden Office





For Sale
$1,103,000
3204 140th Street, Lubbock, TX 79423
Commercial Sale, Lubbock, TX
Property Size3,869 SF
Lot Size0.54 Acres
Price / SF$285.09
Days on Market588
Property Features for 3204 140th Street
General Information
Property type
Commercial Sale
Property subtype
Office
Property condition
Under Construction
Zoning
GO
Parking
25
Parking features
Parking Lot
Fencing
Fenced
Lot features
Landscaped
Elementary school district
Lubbock-Cooper ISD
Middle school district
Lubbock-Cooper ISD
High school district
Lubbock-Cooper ISD
Subdivision
11
Standard status
Active
APN
R332887
Size
3,869 SF
Lot size
0.54 Acres
Taxes and HOA fees
Tax Annual Amount
1721
Utilities
Utilities
Natural Gas Available
Sewer type
Public Sewer
Heating system
Central, Natural Gas
Cooling system
Electric, Central Air
Water source
Public
Amenities
covered patio
granite countertops
break area with kitchenette
ADA restrooms
Nest thermostats
Cat 6 cabling
Building Details
Year built
2025
Flooring type
Vinyl, Plank
Building materials
Brick, Masonite
Roof type
Composition
Listing Agency:
Murphy & Martin Real Estate
(806) 891-3195
Listed By:
Murphy Coon · License #0669982
(806) 252-8801
Added: Mar 4, 2025
Changed: Oct 9
Last Checked: Oct 13 at 6:06PM
MLS# 202551224
Copyright © 2026 Lubbock Association of Realtors. All rights reserved. All information provided by the listing agent/broker is deemed reliable but is not guaranteed and should be independently verified.
Investment Insights
Based on property information with market context.
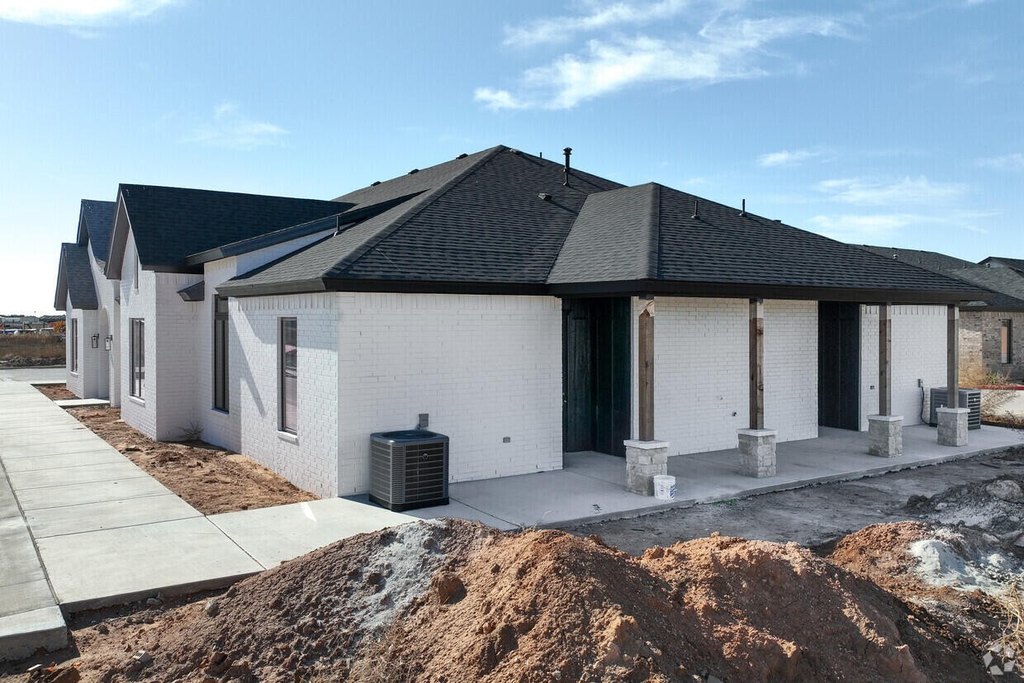
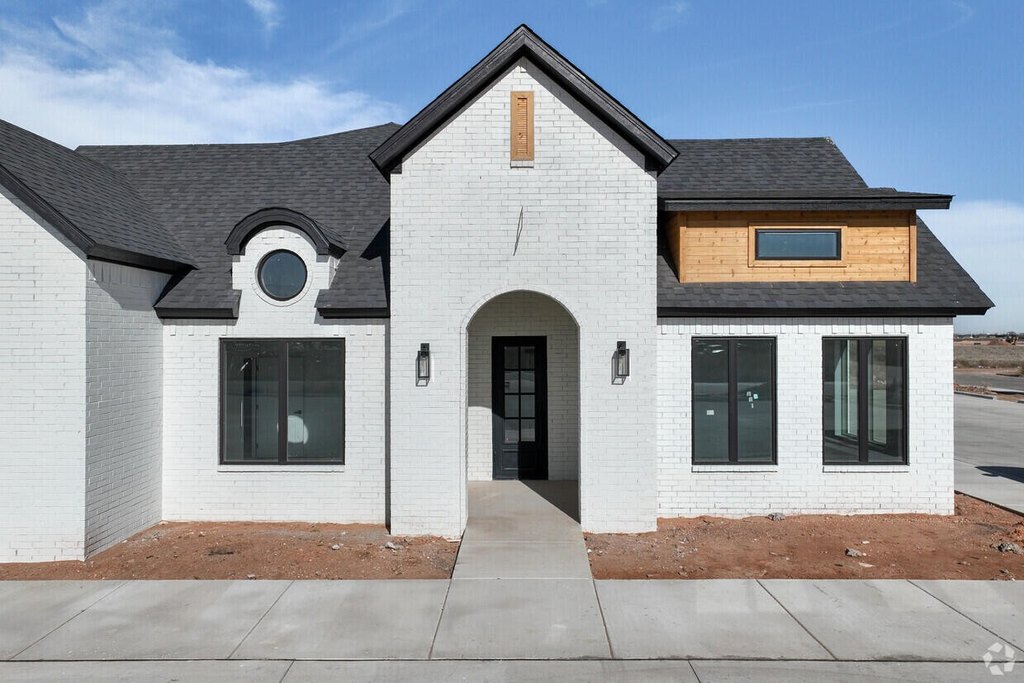
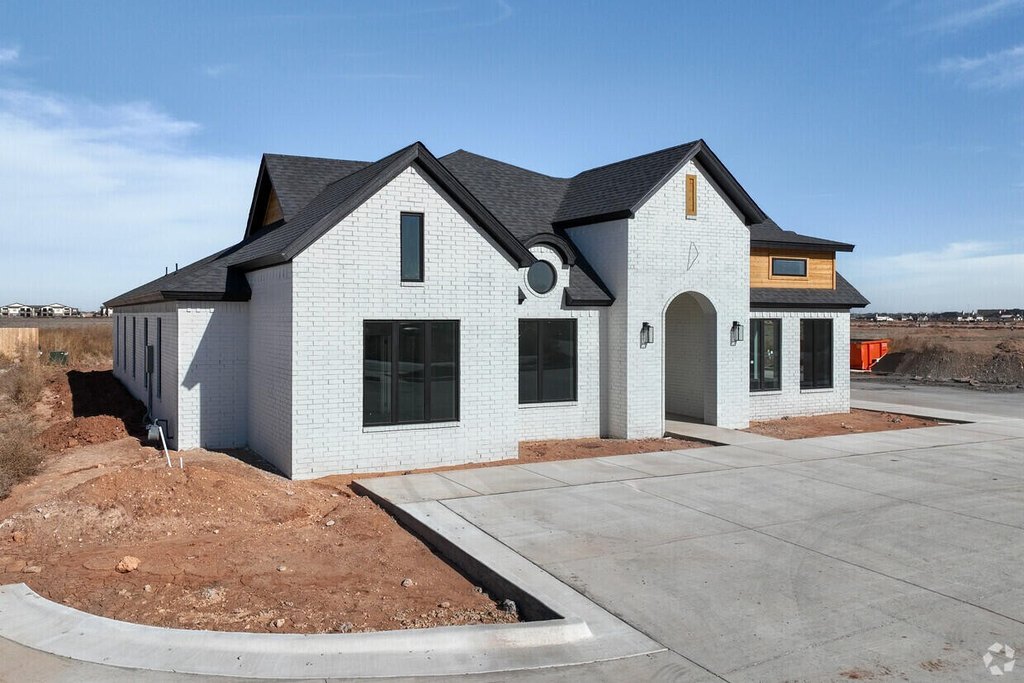
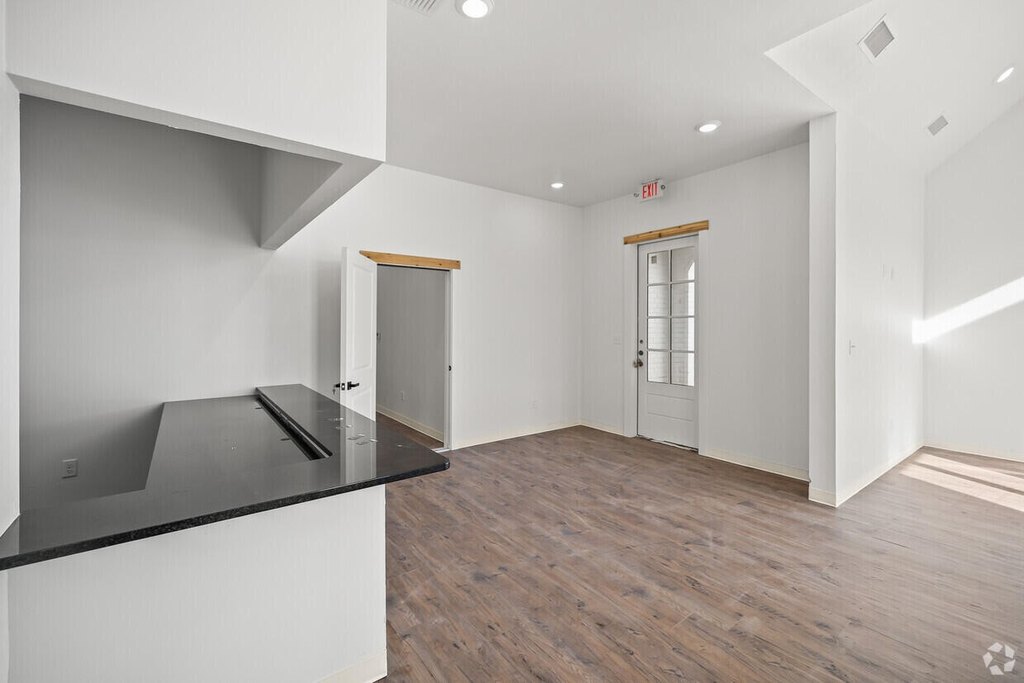
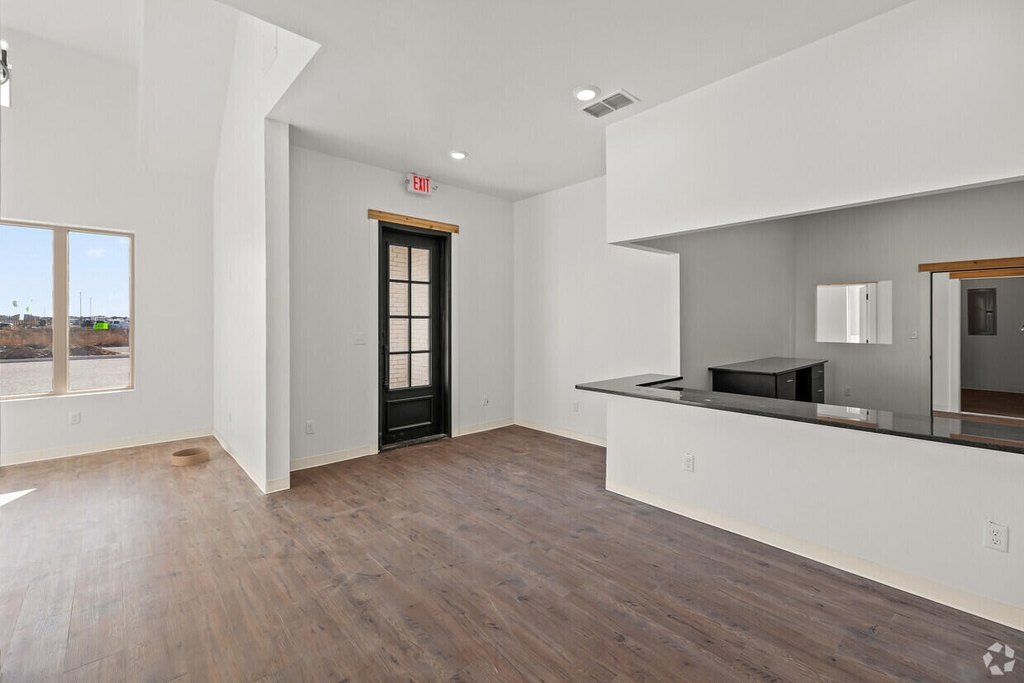
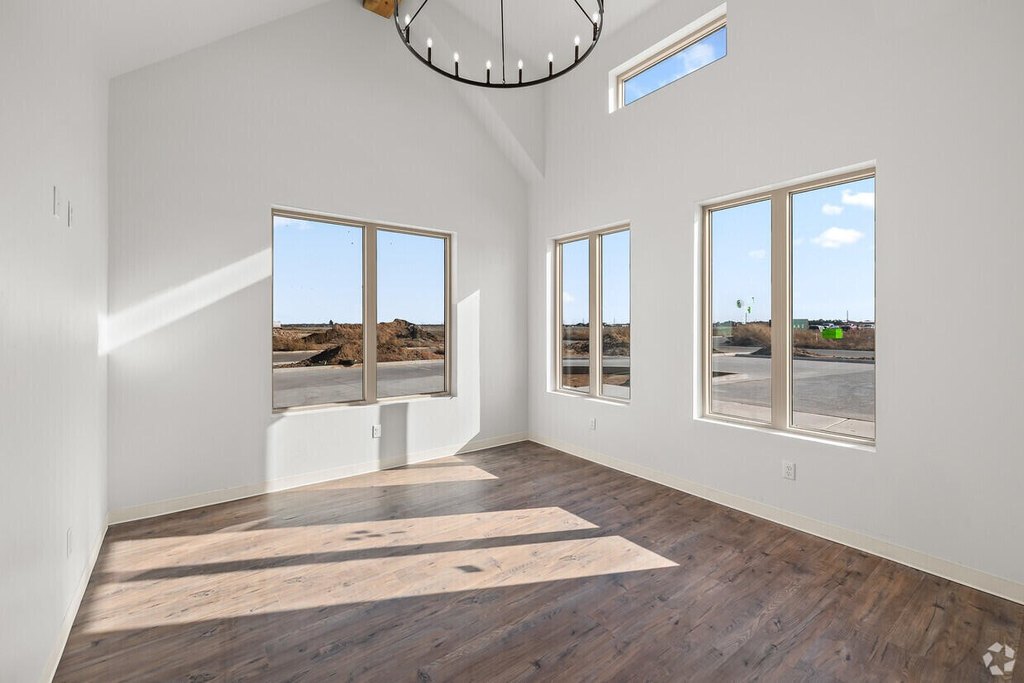
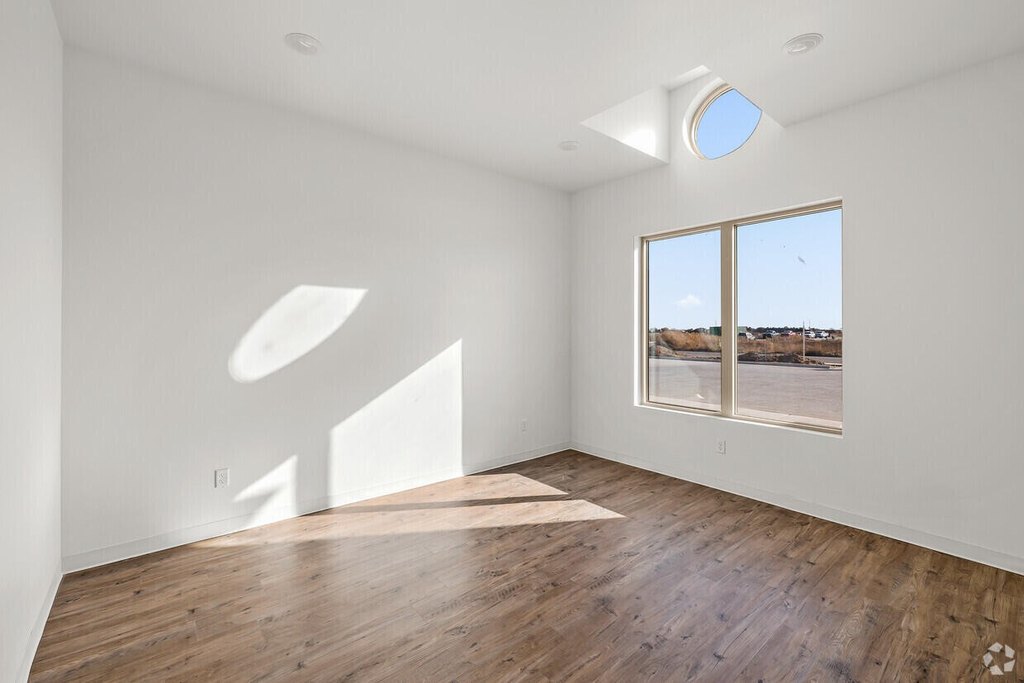
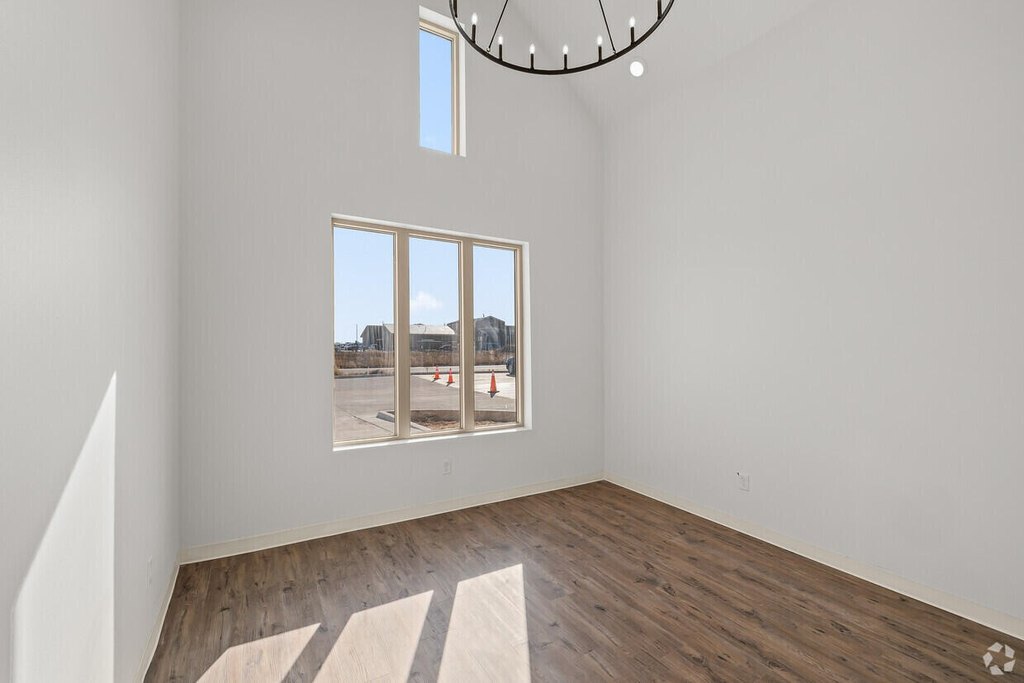
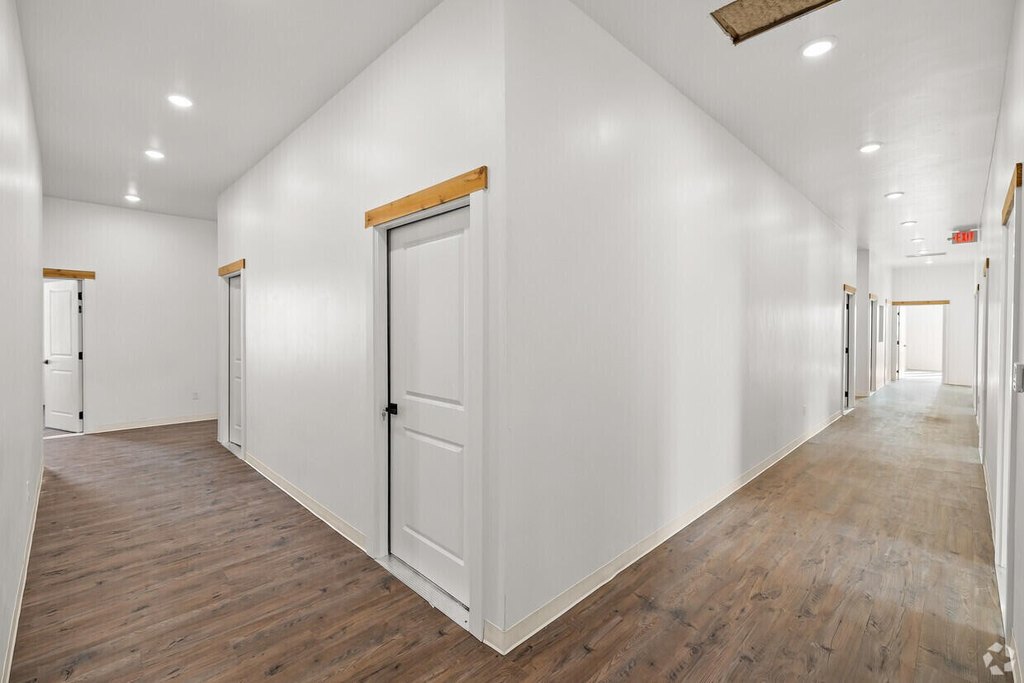
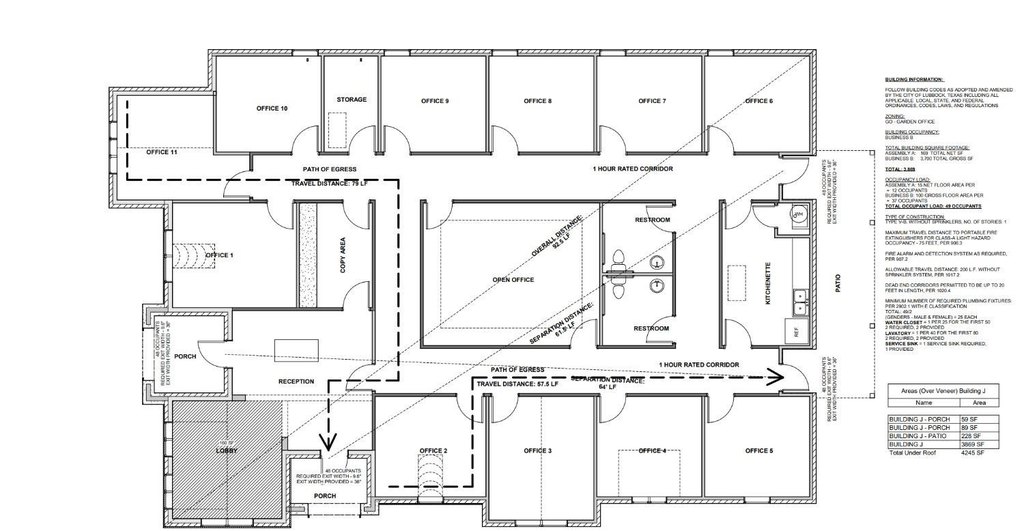
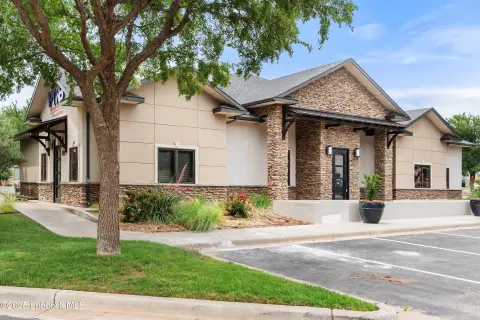
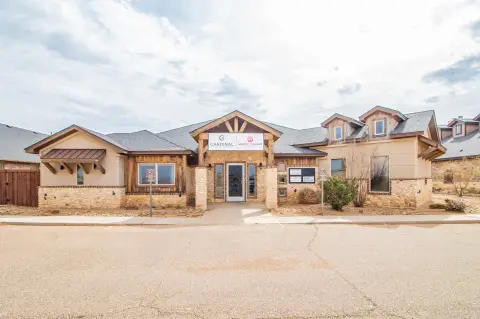
This 3,869-square-foot office building is under construction on a 0.54-acre corner lot. The planned interior includes a reception area, executive offices, a large conference room, lobby space, two ADA restrooms, a kitchenette-equipped break area, and secured IT storage. Interior finishes include brick and Masonite construction, vinyl plank flooring, granite countertops, and solid-core fire-rated doors with private locks. A fenced, covered patio extends the usable space, while Nest thermostats and Cat 6 cabling support modern office operations.
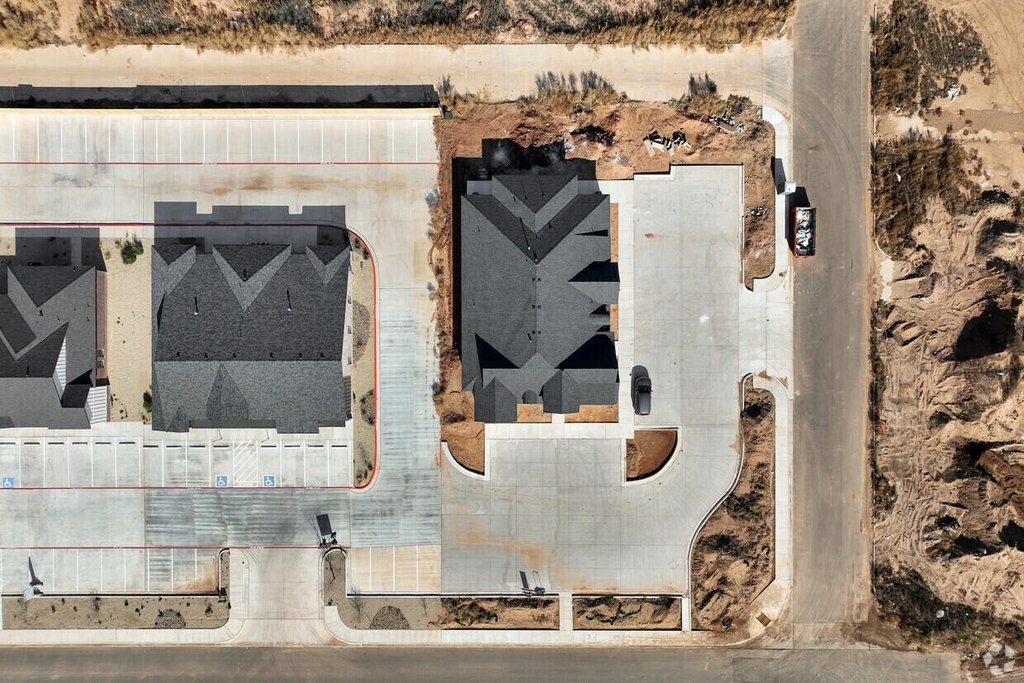
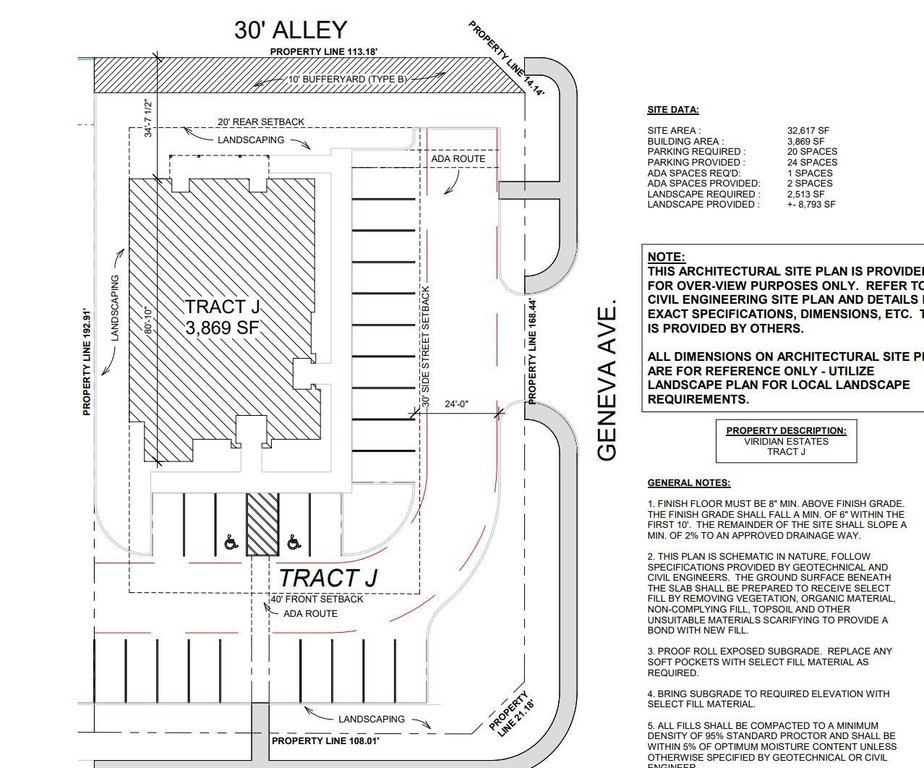
The property is positioned at Indiana and 140th Street in Lubbock, just south of Outer Loop 88. It is adjacent to the Lubbock Copper ISD administration offices and Lubbock Police South Station. Public water and sewer serve the site, with natural gas available. The property also includes a parking lot and composition roofing.
The property is positioned at Indiana and 140th Street in Lubbock, just south of Outer Loop 88. It is adjacent to the Lubbock Copper ISD administration offices and Lubbock Police South Station. Public water and sewer serve the site, with natural gas available. The property also includes a parking lot and composition roofing.
Key Highlights
- 3,869‑square‑foot office building on a 0.54‑acre corner lot
- Under‑construction 2025 office property
- Two ADA restrooms, reception area, conference room, and kitchenette
Financial Insights
Estimated NOI and Cap Rate
NOI / Yr
$50,578
Cap Rate
4.59%
Suggested Prices Based on Cap Rates
Cap Rate 5%
$1,011,560
$1.0M
Cap Rate 7%
$722,543
$722.5K
Cap Rate 9%
$561,978
$562.0K
Market Conditions
NOI Build-Up for 3,869 SF
Gross rent
$81.2K $21.00/SF
− Vacancy
−$13.8K −$3.57/SF
EGI
$67.4K $17.43/SF
− OpEx
−$16.9K −$4.36/SF
NOI
$50.6K $13.07/SF
Area
Lubbock, TX
Vacancy
17.00%
Lease Rate
$21.00 /SF/Yr
Expense Ratio
25.00%
Simulate Cap Rate and NOI
Suggested Prices Based on Cap Rates
Cap Rate 5%
$1,011,560
Cap Rate 7%
$722,543
Cap Rate 9%
$561,978
Alternative Uses
Best Use
Office B
$722.5K
$632.2K – $843.0K
NOI $50,578 @ 7.0% cap · market cap 4.59%
Second Best
—
—
no second resolved use
Theoretical Best
Office A
$975.4K
$853.5K – $1.14M
NOI $68,277 @ 7.0% cap · market cap 6.19%
Zoning and permitted uses should be independently verified with authorities.
How Realmo checks its estimates
Property Analytics
Unlock full access to Insights
Subscribe to Realmo Intelligence
Open Analytics
Current Use
Location Intelligence
Trade Area within ½ mile
44
Businesses Nearby
Explore this area
Business Placement
Demographics for 79423, TX
42,311
Population
18,463
Households
2.3
Avg Household Size
35
Median Age
38%
College-Educated
94%
High-School Grad
64.2 sq mi
ZIP Area
659
Density / Sq Mi
$82,906
Median Household Income
$45,520
Median Earnings
$1,284
Median Rent
$222,500
Median Home Value
Check the figures for this property
Cap Rate, Value Estimation, Potential NOI and more
View Realmo Analytics
Market
Vacancy Rate% for Office in South region

Questions? Ask Rey
Realmo’s AI knows this listing — price, zoning, demand, history. Ask anything.




Frequently Asked Questions
What type of property is this?
Office building - Office property with private suites, conference space, ADA restrooms, and technology-focused infrastructure.
Where is this office building located?
The property is located at 3204 140th Street Lubbock, TX.
What is the asking price?
The asking price for this property is $1,103,000.
What are key features of this property?
This property features: 3,869‑square‑foot office building on a 0.54‑acre corner lot; Under‑construction 2025 office property; Two ADA restrooms, reception area, conference room, and kitchenette


