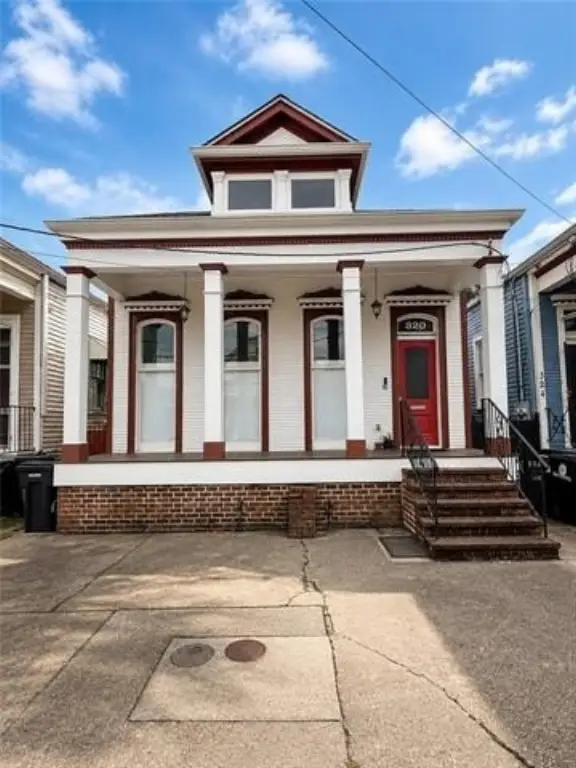
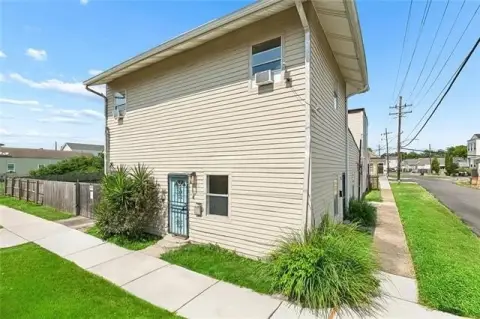
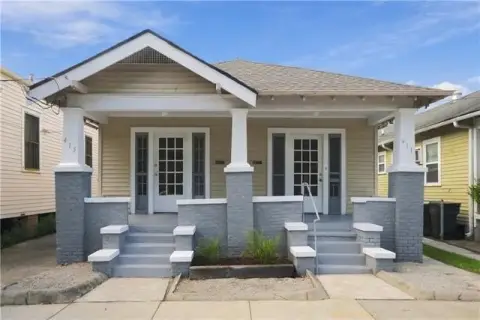
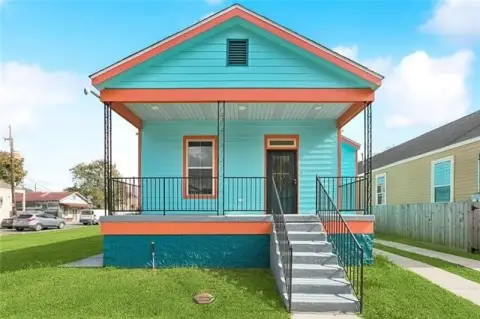
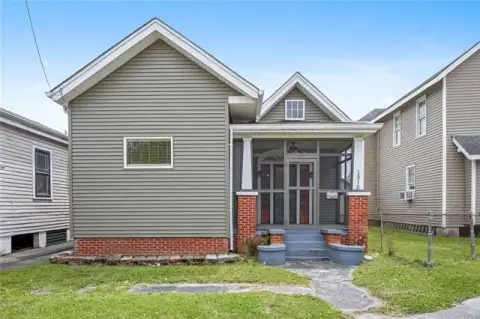
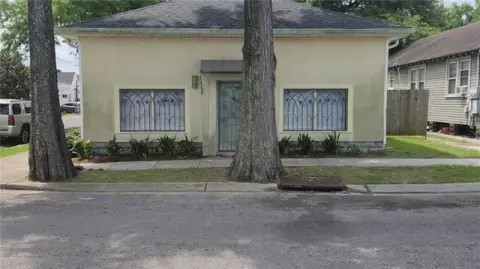
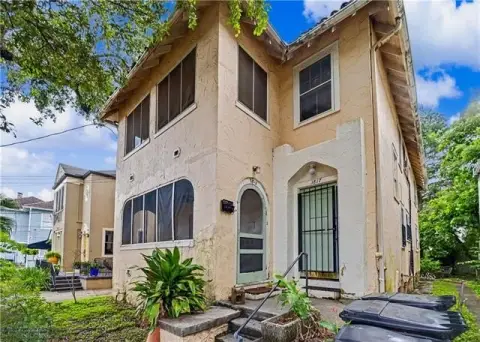
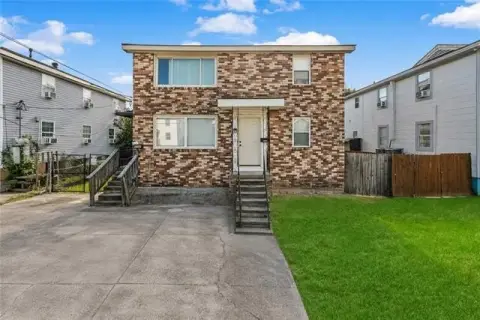
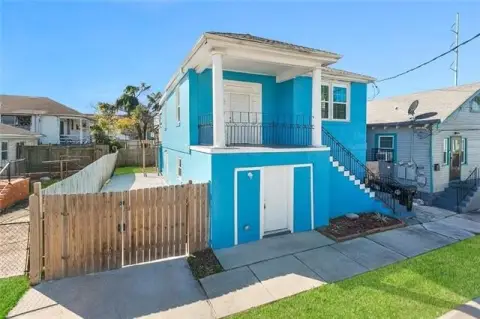
1915 Duplex with Renovation
For Sale
$275,000
320 S CORTEZ Street, New Orleans, LA 70119
Multi-Family, Traditional, New Orleans, LA
Property Size2,200 SF
Price / SF$125
Days on Market53
Property Features for 320 S CORTEZ Street
General Information
Property type
Residential Multi Family
Property subtype
Duplex
Parking features
Off Street
Patio and Porch features
Porch
Exterior features
Balcony, Fence, Porch
Fencing
Fenced
Lot features
Regular
Subdivision
Mid City
Standard status
Active
APN
105302417
Size
2,200 SF
Taxes and HOA fees
Tax Description
SQ 729 LOT 18 SOUTH CORTEZ 30' X 138' 6'' 320-22 SO CORTEZ
Legal Description
SQ 729 LOT 18 SOUTH CORTEZ 30' X 138' 6'' 320-22 SO CORTEZ
Utilities
Heating system
Central
Cooling system
Central Air, Window Unit(s)
Water source
Public
Amenities
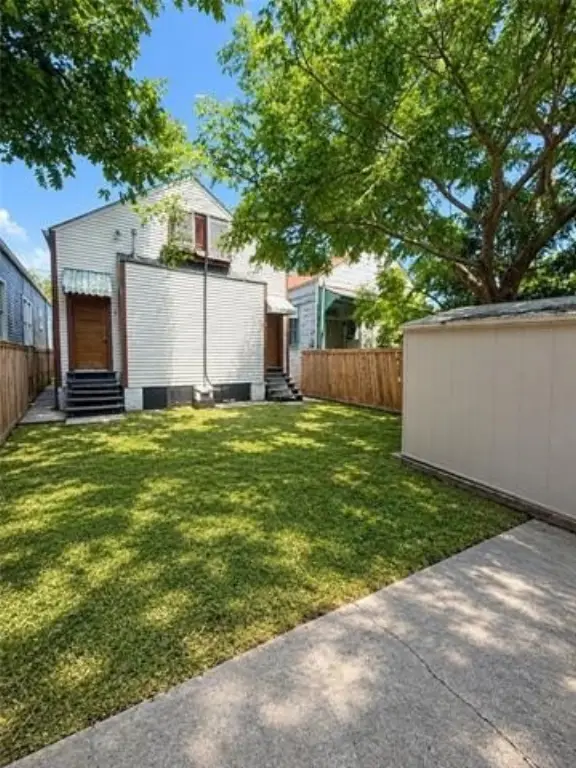
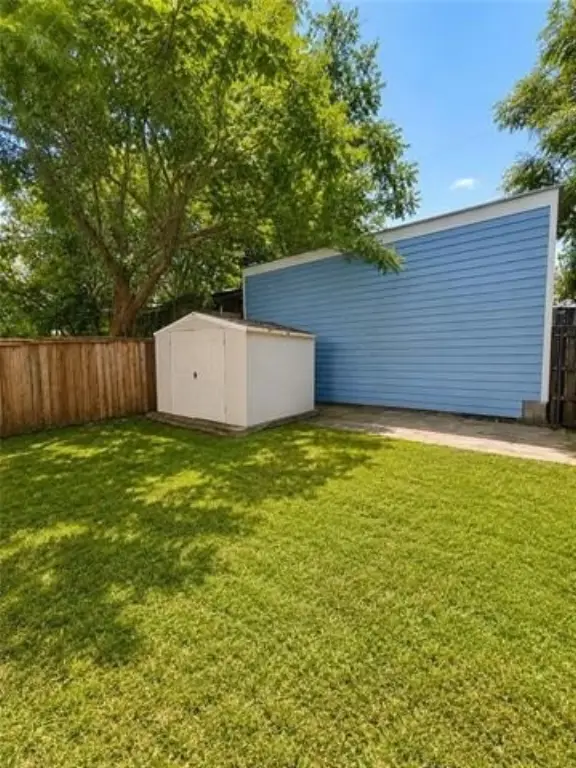
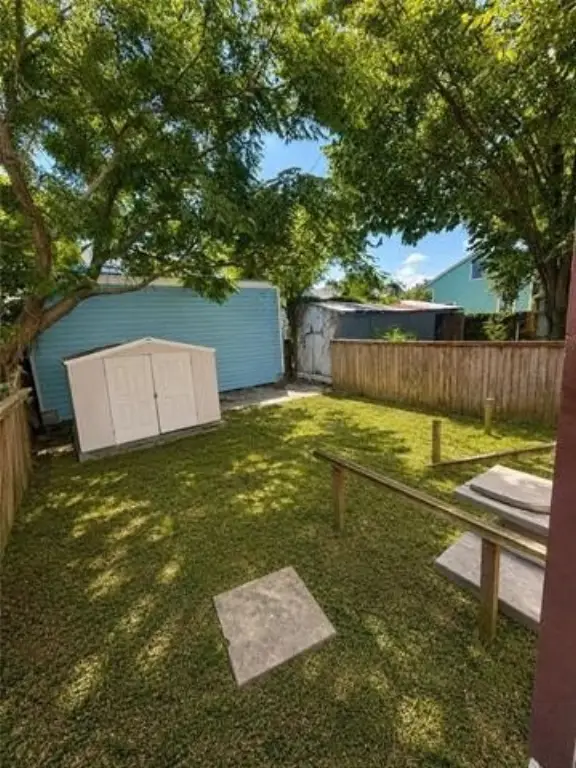
fenced backyard
detached storage shed
Building Details
Year built
1915
Floors in Building
1
Number of units
2
Roof type
Shingle
Architectural style
Other
Listing Agency:
REVE, REALTORS
(504) 300-0700
Listed By:
Jonathan Schmitt
(504) 512-9220
Added: Aug 28
Changed: Oct 15
Last Checked: Oct 19 at 12:06PM
MLS# 2569684
Copyright © 2026 New Orleans Metropolitan Association of REALTORS®. All rights reserved. All information provided by the listing agent/broker is deemed reliable but is not guaranteed and should be independently verified.

Ask AI about this property
Review the available facts, identify missing information and prepare questions for the agent.
Investment Insights
Based on property information with market context.
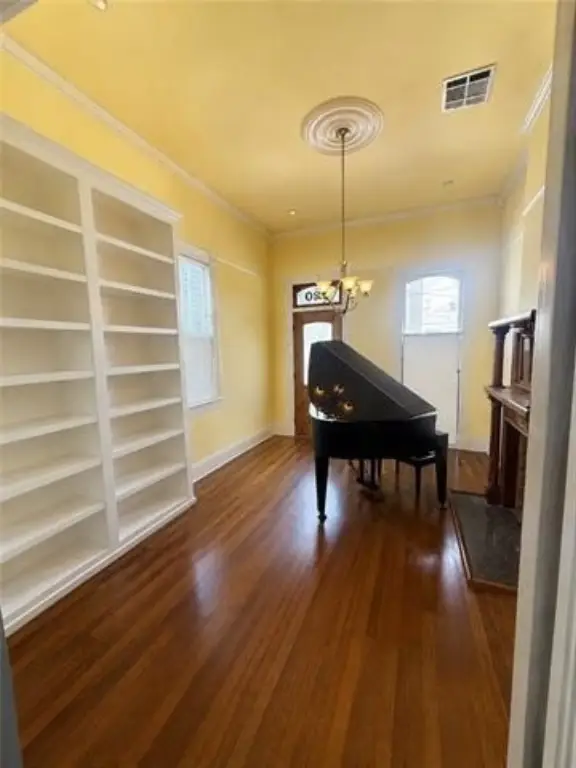
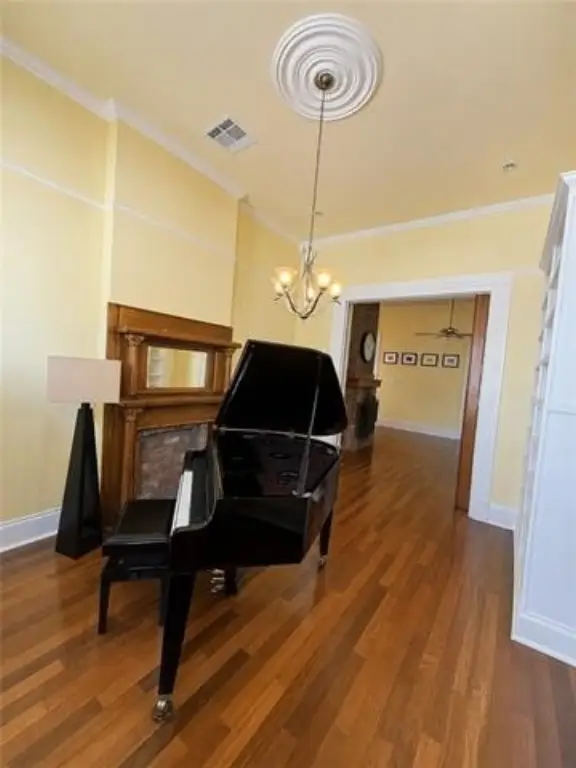
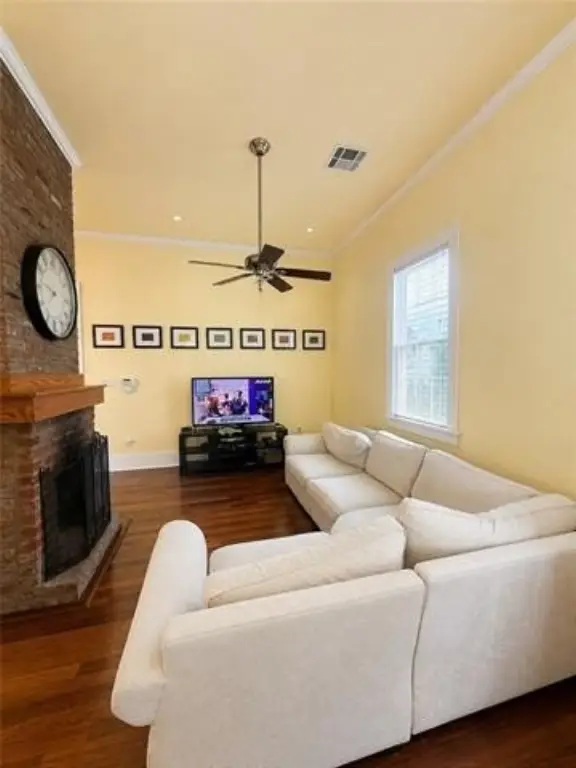
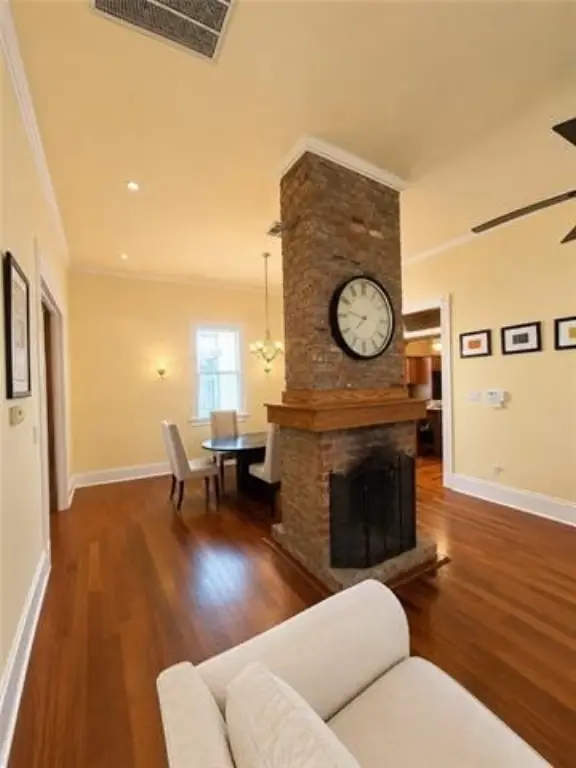
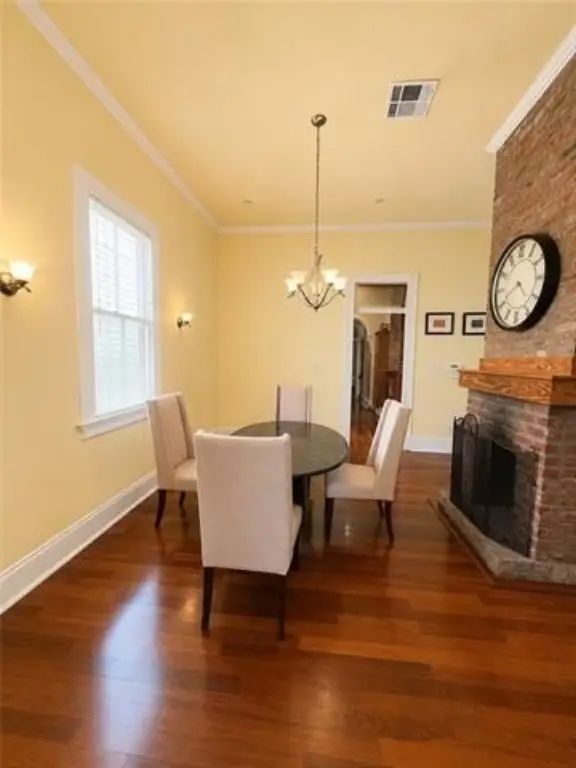
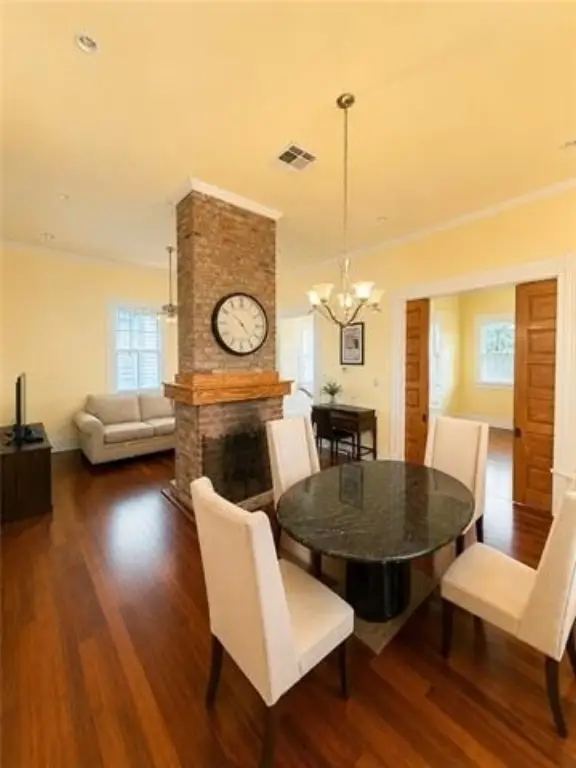
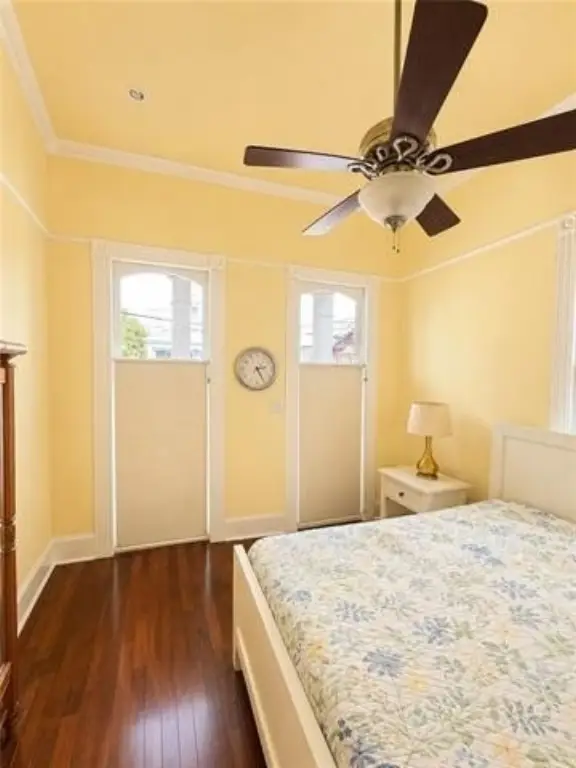
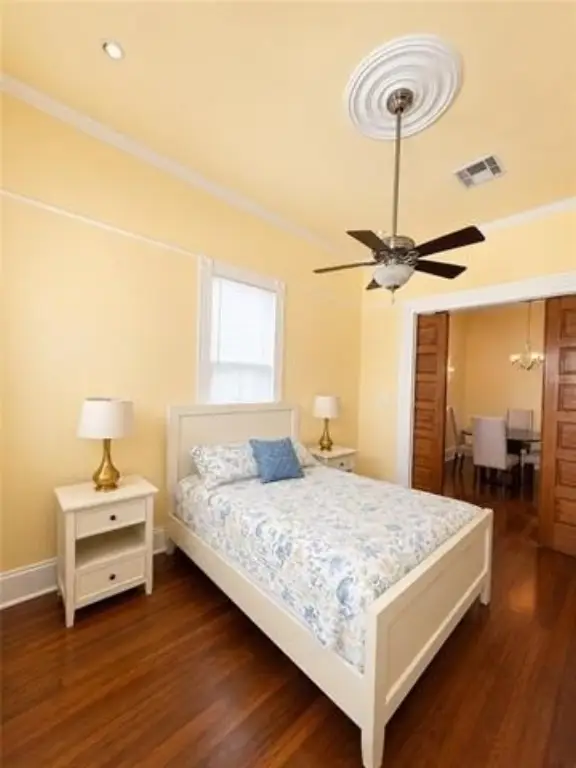
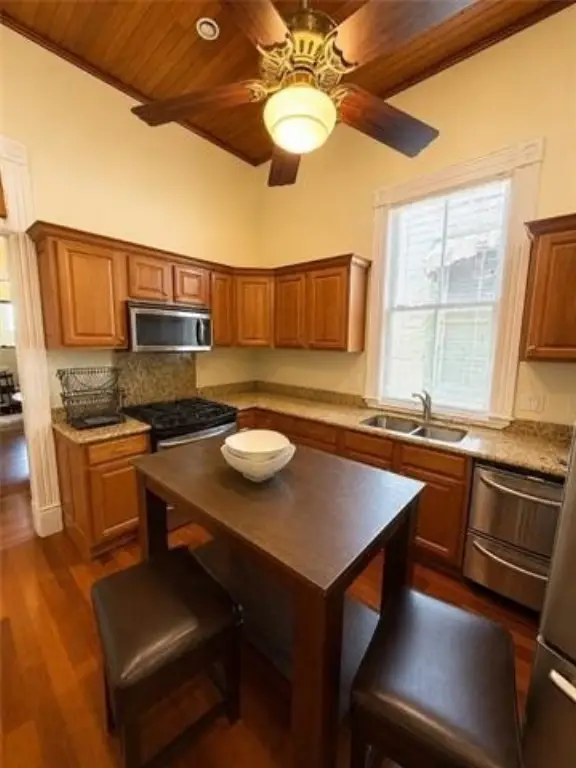
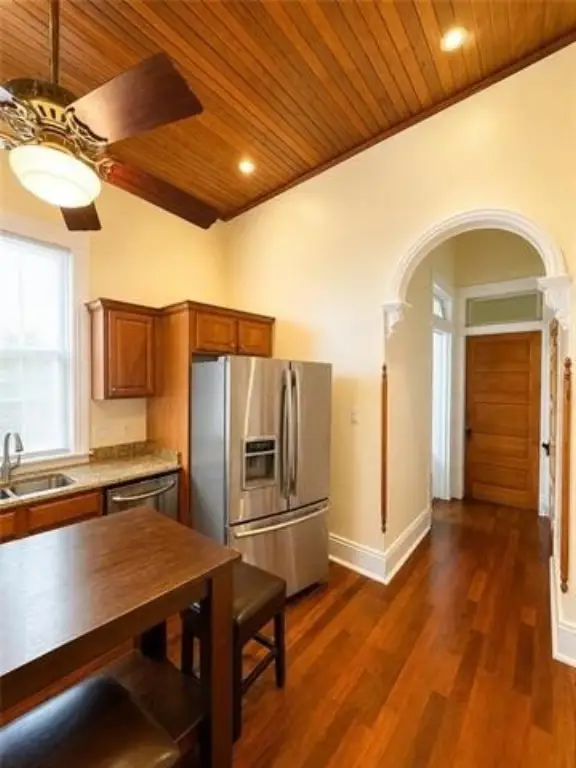
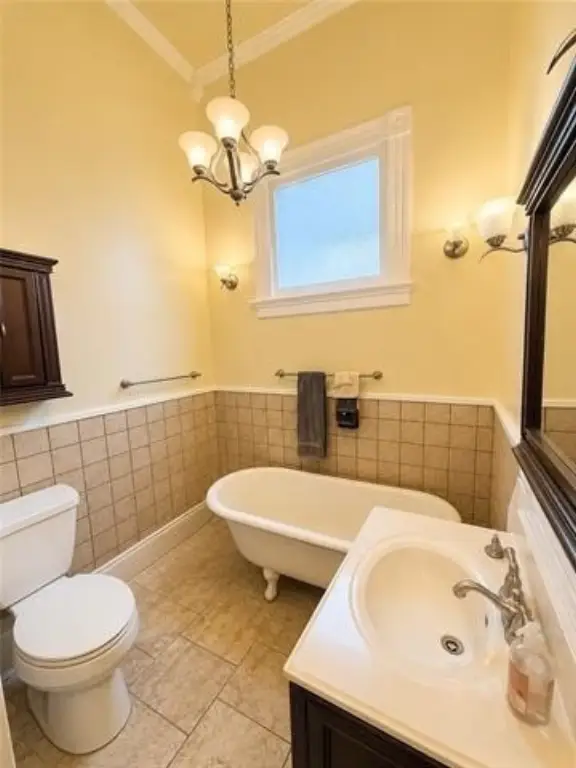
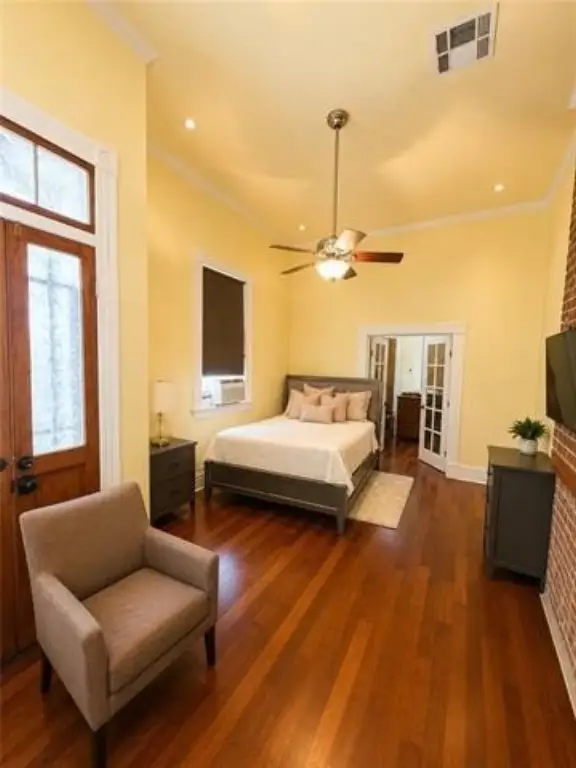
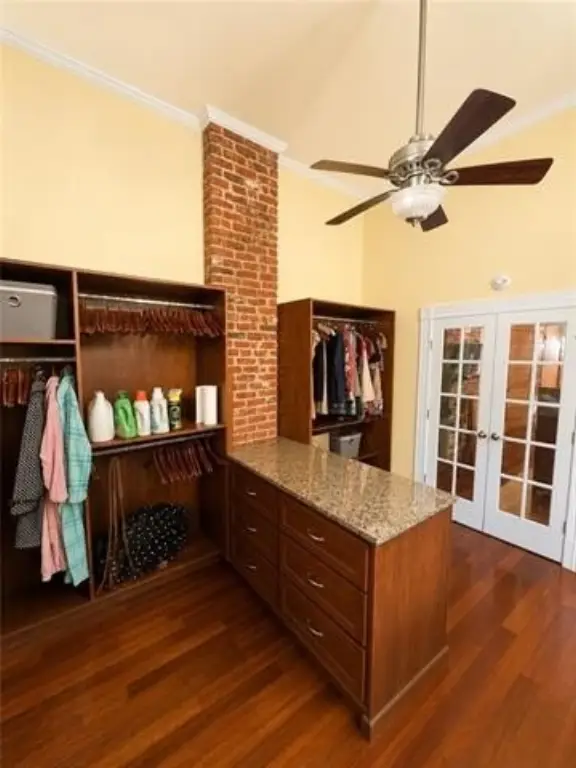
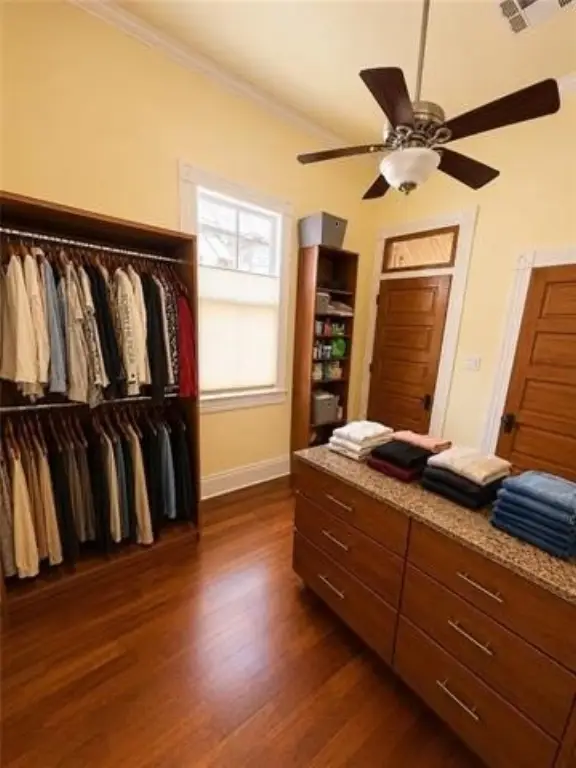
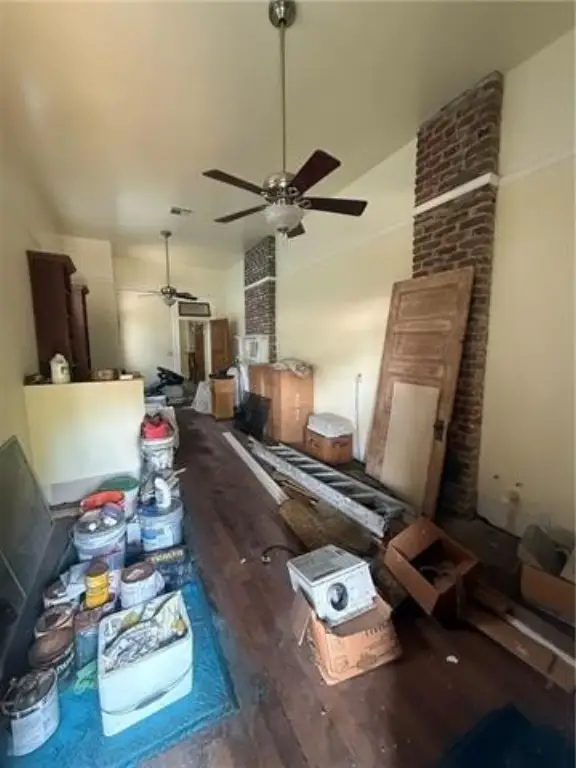
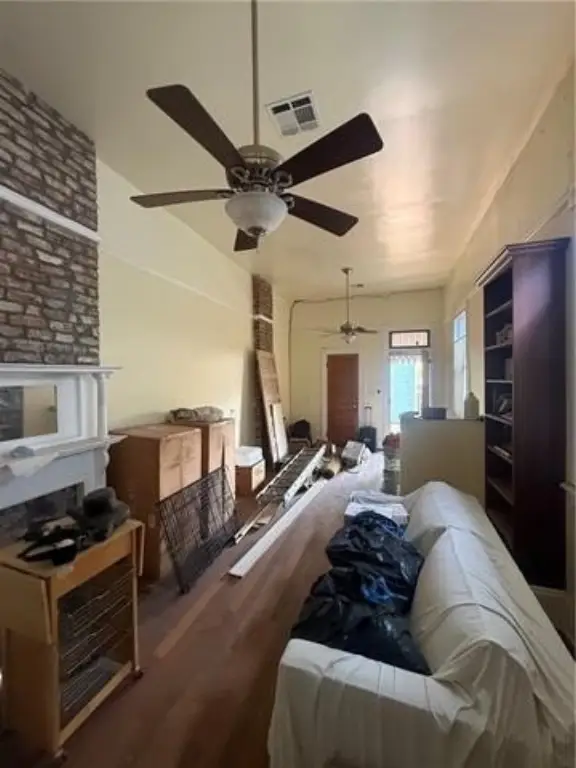
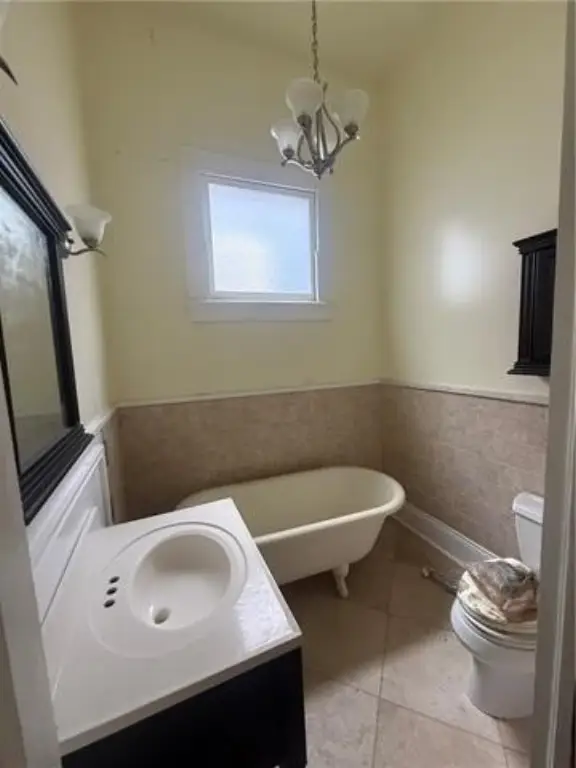
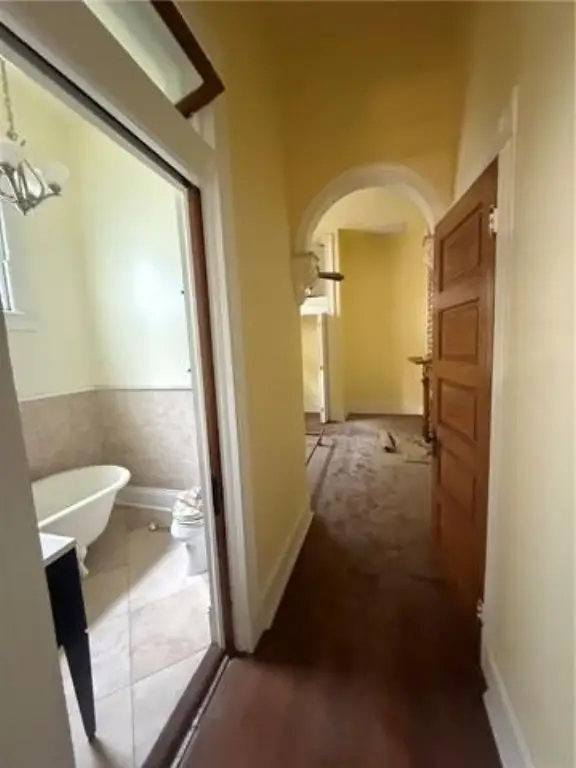
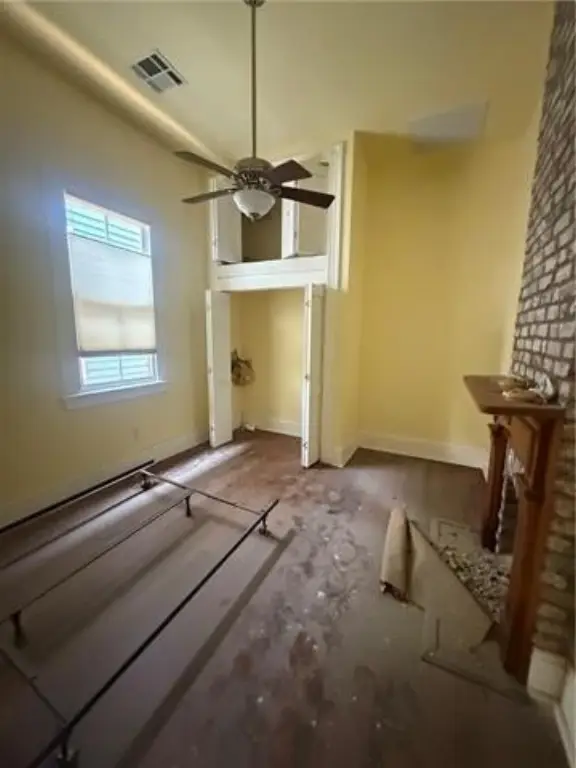
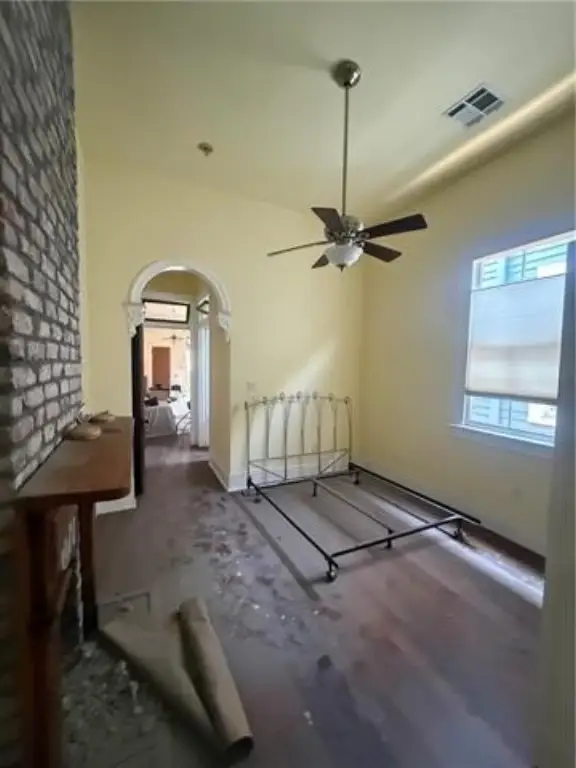
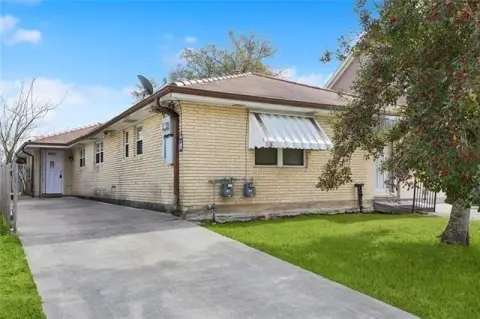
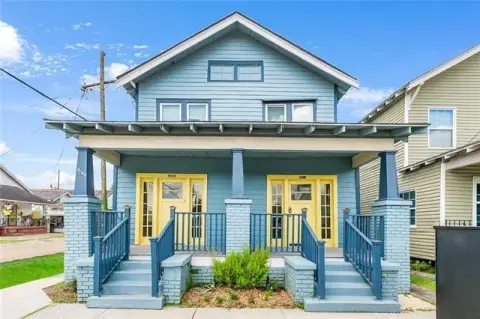
Built in 1915, this 2,200-square-foot duplex combines a substantially finished owner’s residence with a second unit requiring comprehensive renovation. The completed side includes 14-foot ceilings, hardwood flooring, decorative millwork, exposed brick, original wood elements, transom windows, multiple fireplaces, and large windows. Its kitchen is equipped with wood cabinetry, granite counters, stainless steel appliances, a center island, and additional storage.
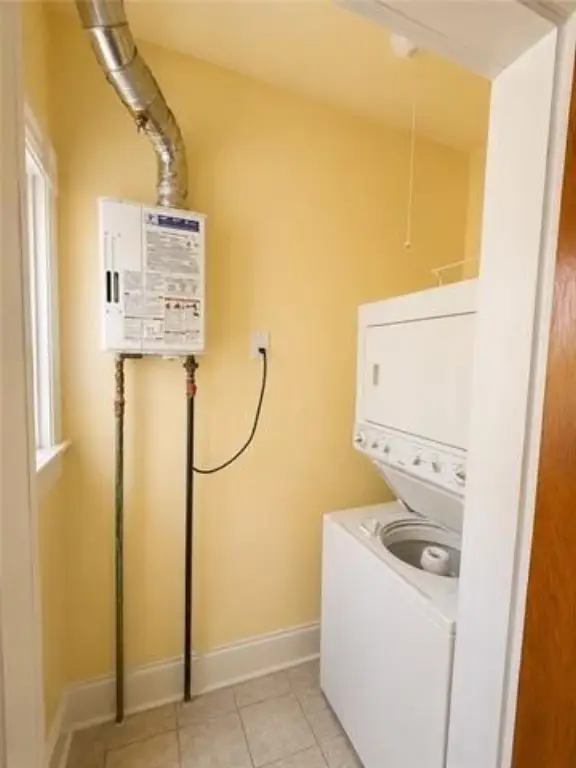
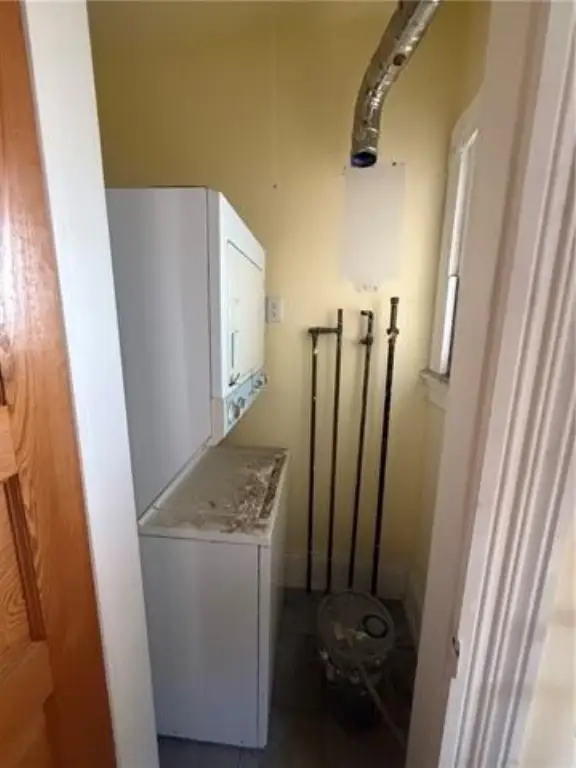
The property also includes a fenced backyard shaded by mature trees, a detached storage shed, balcony, porch, off-street parking, and public water service. Heating is listed as central, while cooling includes window units and central air. The main house is set up for HVAC installation but currently has no HVAC units. Known foundation separation and the extensive work required in the second unit should be considered in planning the property’s renovation.
The property also includes a fenced backyard shaded by mature trees, a detached storage shed, balcony, porch, off-street parking, and public water service. Heating is listed as central, while cooling includes window units and central air. The main house is set up for HVAC installation but currently has no HVAC units. Known foundation separation and the extensive work required in the second unit should be considered in planning the property’s renovation.
Key Highlights
- 2,200‑square‑foot duplex built in 1915
- Finished owner’s side features 14‑foot ceilings, hardwood floors, exposed brick, original woodwork, and multiple fireplaces
- Kitchen includes granite countertops, stainless steel appliances, center island, and storage
Property Analytics
Unlock full access to Insights
Subscribe to Realmo Intelligence
Open Analytics
Lease Details
2
Residential units
Location Intelligence
Trade Area within ½ mile
2,196
Businesses Nearby
Explore this area
Business Placement
Demographics for 70119, LA
38,048
Population
21,595
Households
1.8
Avg Household Size
37
Median Age
47%
College-Educated
89%
High-School Grad
4.5 sq mi
ZIP Area
8,455
Density / Sq Mi
$50,854
Median Household Income
$44,278
Median Earnings
$1,298
Median Rent
$359,300
Median Home Value
Check the figures for this property
Cap Rate, Value Estimation, Potential NOI and more
View Realmo Analytics
Market
Vacancy Rate% for Multifamily in South region

Frequently Asked Questions
What type of property is this?
Duplex - One residence is finished with original architectural details, while the second unit requires comprehensive renovation.
Where is this duplex located?
The property is located at 320 S CORTEZ Street New Orleans, LA.
What is the asking price?
The asking price for this property is $275,000.
What are key features of this property?
This property features: 2,200‑square‑foot duplex built in 1915; Finished owner’s side features 14‑foot ceilings, hardwood floors, exposed brick, original woodwork, and multiple fireplaces; Kitchen includes granite countertops, stainless steel appliances, center island, and storage