Seven-Building Multifamily
For Sale
$950,000
320 S 42ND STREET, Philadelphia, PA 19104
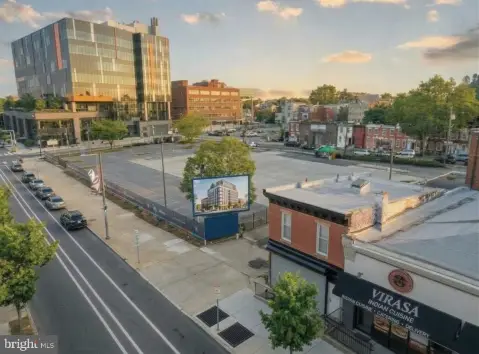
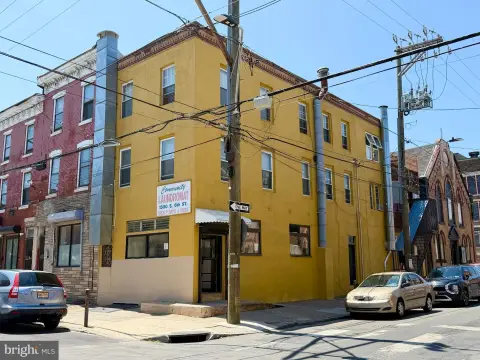
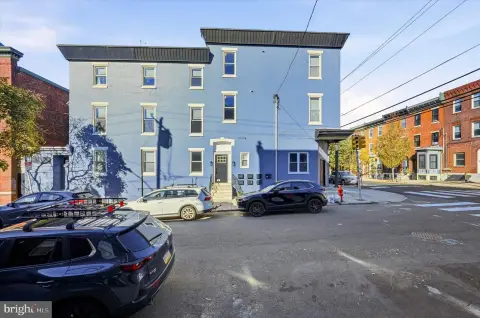
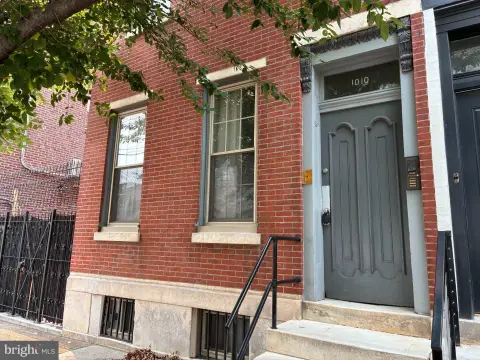
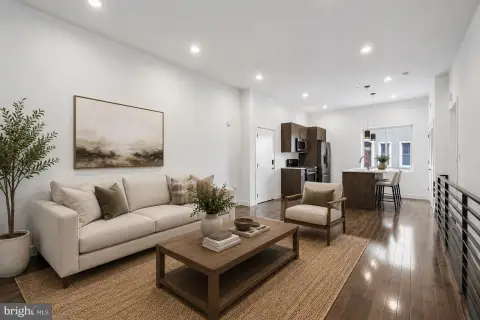
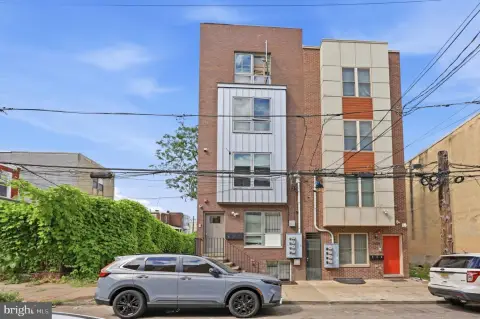
Historic multifamily collection near the University of Pennsylvania campus with flexible acquisition options.
Property Size3,618 SF
Days on Market341
Property Features for 320 S 42ND STREET
General Information
Standard status
Active
Size
3,618 SF
Property subtype
Five Or More Units
Site & Location
Neighborhood
West Powelton
Taxes and HOA fees
Annual Taxes
$11,598
Building Details
Building Size
3,618 SF
Year Built
1930
Buildings
7
Listing Agency:
SDG Management, LLC
Listed By:
Shawn E Witter · License #RS326040
(267) 446-9133
Source:
Patmckennarealtors
Added: Nov 17, 2025
Changed: Oct 21
Last Checked: Oct 23 at 3:01PM
Displayed information is deemed reliable but is not guaranteed and should be independently verified. All listing content including descriptions, pricing, images are the copyrighted material of SDG Management, LLC

Ask AI about this property
Review the available facts, identify missing information and prepare questions for the agent.
Investment Insights
Based on property information with market context.
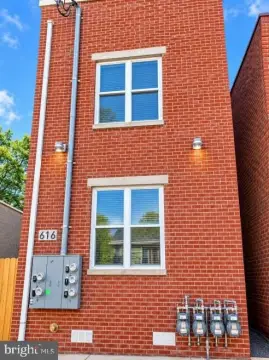
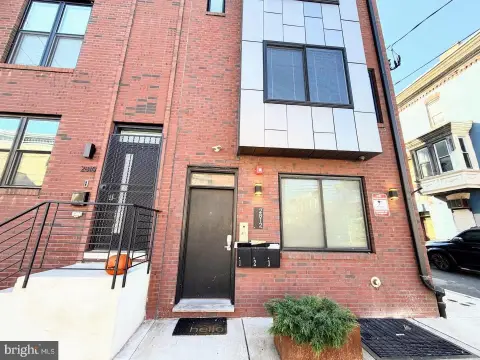
This multifamily offering comprises seven buildings at 320 S 42ND ST in Philadelphia, Pennsylvania. The properties retain historic character and are positioned for continued residential use, with the collection presented as a coordinated portfolio rather than a single structure.
The address is near the University of Pennsylvania campus in West Philadelphia. Ownership is considering several acquisition structures, including a full-package transaction, selected groups of properties, or individual purchases, with preference given to a package sale.
The address is near the University of Pennsylvania campus in West Philadelphia. Ownership is considering several acquisition structures, including a full-package transaction, selected groups of properties, or individual purchases, with preference given to a package sale.
Key Highlights
- Seven‑building multifamily collection
- Historic character across the portfolio
- Near the University of Pennsylvania campus
Financial Insights
Estimated NOI and Cap Rate
NOI / Yr
$56,909
Cap Rate
5.99%
Suggested Prices Based on Cap Rates
Cap Rate 5%
$1,138,180
$1.1M
Cap Rate 7%
$812,986
$813.0K
Cap Rate 9%
$632,322
$632.3K
Market Conditions
NOI Build-Up for 3,618 SF
Gross rent
$109.8K $30.36/SF
− Vacancy
−$6.4K −$1.76/SF
EGI
$103.5K $28.60/SF
− OpEx
−$46.6K −$12.87/SF
NOI
$56.9K $15.73/SF
Area
Philadelphia, PA
Vacancy
5.80%
Lease Rate
$30.36 /SF/Yr
Expense Ratio
45.00%
Simulate Cap Rate and NOI
Suggested Prices Based on Cap Rates
Cap Rate 5%
$1,138,180
Cap Rate 7%
$812,986
Cap Rate 9%
$632,322
Alternative Uses
Best Use
Apartment 5plus
$813.0K
$711.4K – $948.5K
NOI $56,909 @ 7.0% cap · market cap 5.99%
Second Best
—
—
no second resolved use
Theoretical Best
Multifamily LT 5
$882.0K
$771.8K – $1.03M
NOI $61,741 @ 7.0% cap · market cap 6.50%
Zoning and permitted uses should be independently verified with authorities.
How Realmo checks its estimates
Property Analytics
Who owns this building?
See the owner, sales and loan history
Open Analytics
Location Intelligence
Trade Area within ½ mile
4,616
Businesses Nearby
Explore this area
Business Placement
Demographics for 19104, PA
56,839
Population
23,888
Households
2.4
Avg Household Size
26
Median Age
47%
College-Educated
90%
High-School Grad
3.1 sq mi
ZIP Area
18,335
Density / Sq Mi
$39,526
Median Household Income
$18,420
Median Earnings
$1,329
Median Rent
$268,200
Median Home Value
Check the figures for this property
Cap Rate, Value Estimation, Potential NOI and more
View Realmo Analytics
Market
Vacancy Rate% for Multifamily in Northeast region


Frequently Asked Questions
What type of property is this?
Multifamily property - Historic multifamily collection near the University of Pennsylvania campus with flexible acquisition options.
Where is this multifamily property located?
The property is located at 320 S 42ND STREET Philadelphia, PA.
What is the asking price?
The asking price for this property is $950,000.
What are key features of this property?
This property features: Seven‑building multifamily collection; Historic character across the portfolio; Near the University of Pennsylvania campus


