Four-Unit Quadplex with
For Sale
$899,900
320 Monmouth Ave S, Monmouth, OR 97361
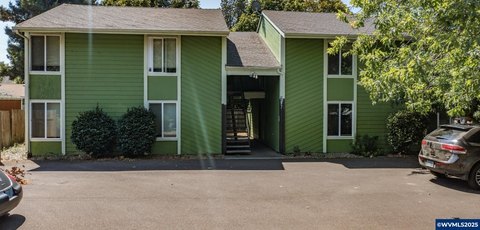
Four-bedroom residences with on-site parking and select updates provide a practical multifamily configuration.
Property Size5,568 SF
Price / SF$161.62
Days on Market87

Ask AI about this property
Review the available facts, identify missing information and prepare questions for the agent.
Property Features for 320 Monmouth Ave S
General Information
Standard status
Active
Size
5,568 SF
Property subtype
Multi-Family
Units
Unit Mix
4 x 4BR
Multifamily Units
4
Building Details
Year Built
2003
Listing Agency:
MADE OUT WEST LAND COMPANY, LLC
Listed By:
CORY SPINK · License #201217354
(503) 857-7780
Source:
Oregonhomeshop
Added: Jul 21
Changed: Oct 8
Last Checked: Oct 7 at 2:25PM
Displayed information is deemed reliable but is not guaranteed and should be independently verified. All listing content including descriptions, pricing, images are the copyrighted material of MADE OUT WEST LAND COMPANY, LLC
Investment Insights
Based on property information with market context.
This 5,568-square-foot quadplex was built in 2003 and contains four four-bedroom units. The property includes off-street, on-site parking, some completed updates, and appliances that will remain with the sale. Tenants are in place, and showings should be coordinated without disturbing occupants.
The building sits behind the historic Burford-Stanley House and is a short distance from Western Oregon University’s campus and other points of interest in Monmouth. Its four-unit layout offers a consistent residential configuration across the property.
The building sits behind the historic Burford-Stanley House and is a short distance from Western Oregon University’s campus and other points of interest in Monmouth. Its four-unit layout offers a consistent residential configuration across the property.
Key Highlights
- Four‑unit quadplex with four 4 bed units
- 5,568 SF building constructed in 2003
- Off‑street, on‑site parking included
Financial Insights
Estimated NOI and Cap Rate
NOI / Yr
$66,873
Cap Rate
7.43%
Suggested Prices Based on Cap Rates
Cap Rate 5%
$1,337,460
$1.3M
Cap Rate 7%
$955,329
$955.3K
Cap Rate 9%
$743,033
$743.0K
Market Conditions
NOI Build-Up for 5,568 SF
Gross rent
$102.2K $18.36/SF
− Vacancy
−$6.7K −$1.20/SF
EGI
$95.5K $17.16/SF
− OpEx
−$28.7K −$5.15/SF
NOI
$66.9K $12.01/SF
Area
Polk County, OR
Vacancy
6.55%
Lease Rate
$18.36 /SF/Yr
Expense Ratio
30.00%
Simulate Cap Rate and NOI
Suggested Prices Based on Cap Rates
Cap Rate 5%
$1,337,460
Cap Rate 7%
$955,329
Cap Rate 9%
$743,033
Alternative Uses
Best Use
Multifamily LT 5
$955.3K
$835.9K – $1.11M
NOI $66,873 @ 7.0% cap · market cap 7.43%
Second Best
Apartment 5plus
$879.8K
$769.8K – $1.03M
NOI $61,584 @ 7.0% cap · market cap 6.84%
Theoretical Best
Office A
$1.48M
$1.29M – $1.72M
NOI $103,485 @ 7.0% cap · market cap 11.50%
Zoning and permitted uses should be independently verified with authorities.
How Realmo checks its estimates
Property Analytics
Unlock full access to Insights
Subscribe to Realmo Intelligence
Open Analytics
Current Use
Lease Details
4
Residential units
Location Intelligence
Trade Area within ½ mile
456
Businesses Nearby
Explore this area
Business Placement
Demographics for 97361, OR
13,412
Population
4,858
Households
2.8
Avg Household Size
29
Median Age
28%
College-Educated
94%
High-School Grad
132.9 sq mi
ZIP Area
101
Density / Sq Mi
$70,625
Median Household Income
$28,812
Median Earnings
$1,128
Median Rent
$407,100
Median Home Value
Check the figures for this property
Cap Rate, Value Estimation, Potential NOI and more
View Realmo Analytics
Market
Vacancy Rate% for Multifamily in West region


Frequently Asked Questions
What type of property is this?
Quadplex - Four-bedroom residences with on-site parking and select updates provide a practical multifamily configuration.
Where is this quadplex located?
The property is located at 320 Monmouth Ave S Monmouth, OR.
What is the asking price?
The asking price for this property is $899,900.
What are key features of this property?
This property features: Four‑unit quadplex with four 4 bed units; 5,568 SF building constructed in 2003; Off‑street, on‑site parking included


