Industrial Flex Campus with
For Sale
Contact for pricing
320 E Methvin St & 325 E Tyler St, Longview, TX 75601
Two-building office/industrial campus with dock-high loading, sprinkler coverage, and a paved lot for scalable yard use.
Property Size124,417 SF
Price / SF$75.53
Days on Market226
Property Features for 320 E Methvin St & 325 E Tyler St
General Information
Standard status
Active
Size
124,417 SF
Class
B
Total Parking Spaces
73
Property subtype
Office, Industrial
Zoning
IND PK (Industrial Park)
Occupancy
50%
Lease Type
NNN
Investment Type
Value Add
Site & Location
Highway Access
Yes
Road Access
Yes
Warehouse & Industrial
Clear Height
18 ft
Heavy Power
Yes
Sprinkler System
Yes
Additional Details
Cap Rate
7.25%
Building Details
Year Built
1942
Year Renovated
2007
Buildings
2
Tenancy
Multi
Listing Agency:
DWG Capital Group
Listed By:
Judd Dunning · License #CA 01520854
(310) 261-8428
Source:
Crexi
Added: Mar 11
Changed: Oct 18
Last Checked: Oct 20 at 8:37PM
Displayed information is deemed reliable but is not guaranteed and should be independently verified. All listing content including descriptions, pricing, images are the copyrighted material of DWG Capital Group

Ask AI about this property
Review the available facts, identify missing information and prepare questions for the agent.
Investment Insights
Based on property information with market context.
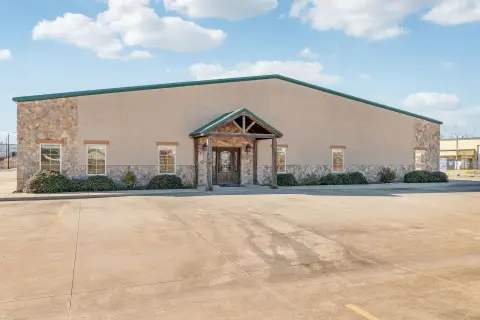
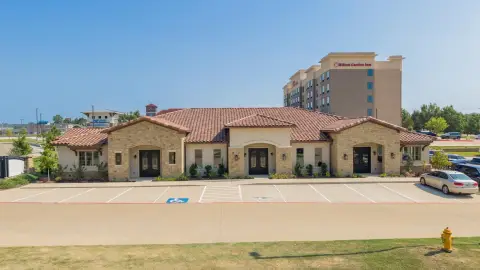
An office/industrial campus totaling approximately 124,417 SF, plus an additional approximately 1.22-acre paved lot, is available for lease or sale. The property was formerly used as a corporate headquarters and industrial production campus and now offers two building options with functional improvements for a range of operations.
Building 1 measures approximately 59,450 SF and is available for immediate lease-up, featuring 18-foot clear heights, dock-high loading, and full sprinkler coverage. Building 1 is also supported by approximately 1,000 to 1,200 amp 277/480V three-phase electrical service. Building 2 totals approximately 64,967 SF and is partially income-producing multi-function office space under existing subtenancy during a master lease transition, with an Assignor Guarantor obligation through November 2028.
Direct I-20 access and the convergence of U.S. Routes 31/80/259 support regional connectivity, with the nearest Union Pacific rail yard approximately 2 miles away and the East Texas Regional Airport in close proximity.
Building 1 measures approximately 59,450 SF and is available for immediate lease-up, featuring 18-foot clear heights, dock-high loading, and full sprinkler coverage. Building 1 is also supported by approximately 1,000 to 1,200 amp 277/480V three-phase electrical service. Building 2 totals approximately 64,967 SF and is partially income-producing multi-function office space under existing subtenancy during a master lease transition, with an Assignor Guarantor obligation through November 2028.
Direct I-20 access and the convergence of U.S. Routes 31/80/259 support regional connectivity, with the nearest Union Pacific rail yard approximately 2 miles away and the East Texas Regional Airport in close proximity.
Key Highlights
- Two‑building office/industrial campus at 320 E Methvin St and 325 E Tyler St, Longview, TX 75601, with 124,417 SF improvements plus a ±1.22‑acre paved lot
- Building 1: 59,450 SF with 18‑foot clear height, dock‑high loading, and full sprinkler coverage
- Building 1 power: 1,000 to 1,200 amp 277/480V three‑phase electrical service
Financial Insights
Estimated NOI and Cap Rate
NOI / Yr
$726,764
Cap Rate
7.73%
Suggested Prices Based on Cap Rates
Cap Rate 5%
$14,535,280
$14.5M
Cap Rate 7%
$10,382,343
$10.4M
Cap Rate 9%
$8,075,156
$8.1M
Market Conditions
NOI Build-Up for 124,417 SF
Gross rent
$1.13M $9.12/SF
− Vacancy
−$96.4K −$0.78/SF
EGI
$1.04M $8.34/SF
− OpEx
−$311.5K −$2.50/SF
NOI
$726.8K $5.84/SF
Area
Gregg County, TX
Vacancy
8.50%
Lease Rate
$9.12 /SF/Yr
Expense Ratio
30.00%
Simulate Cap Rate and NOI
Suggested Prices Based on Cap Rates
Cap Rate 5%
$14,535,280
Cap Rate 7%
$10,382,343
Cap Rate 9%
$8,075,156
Alternative Uses
Best Use
Office B
$29.73M
$26.01M – $34.69M
NOI $2,081,128 @ 7.0% cap · market cap 22.15%
Second Best
Warehouse
$12.61M
$11.03M – $14.71M
NOI $882,500 @ 7.0% cap · market cap 9.39%
Theoretical Best
Hotel Hospitality
$93.71M
$82.00M – $109.33M
NOI $6,559,886 @ 7.0% cap · market cap 69.81%
Zoning and permitted uses should be independently verified with authorities.
How Realmo checks its estimates
Property Analytics
Unlock full access to Insights
Subscribe to Realmo Intelligence
Open Analytics
Current Use
Lease Details
18 ft
Clear height
Yes
Heavy power
Yes
Sprinkler system
Yes
Highway access
Yes
Paved road access
Location Intelligence
Trade Area within ½ mile
1,675
Businesses Nearby
Well-served
Demand for This Use
Explore this area
Business Placement
Demographics for 75601, TX
15,813
Population
6,545
Households
2.4
Avg Household Size
39
Median Age
26%
College-Educated
88%
High-School Grad
9.1 sq mi
ZIP Area
1,738
Density / Sq Mi
$63,279
Median Household Income
$35,505
Median Earnings
$910
Median Rent
$193,800
Median Home Value
Check the figures for this property
Cap Rate, Value Estimation, Potential NOI and more
View Realmo Analytics
Market
Vacancy Rate% for Office in South region






Similar Off Market Nearby
- Tuscan Pig Italian Kitchen — 401 S High St, Longview, TX 75601
- TCW chicken and more — 314 W Cotton St, Longview, TX 75601
- Perfect Catering — 202 N Teague St, Longview, TX 75601
- Perfect Blend — 700 E Marshall Ave, Longview, TX 75601
Frequently Asked Questions
What type of property is this?
Flex space - Two-building office/industrial campus with dock-high loading, sprinkler coverage, and a paved lot for scalable yard use.
Where is this flex space located?
The property is located at 320 E Methvin St & 325 E Tyler St Longview, TX.
What is the asking price?
The asking price for this property is $9,397,000.
What are key features of this property?
This property features: Two‑building office/industrial campus at 320 E Methvin St and 325 E Tyler St, Longview, TX 75601, with 124,417 SF improvements plus a ±1.22‑acre paved lot; Building 1: 59,450 SF with 18‑foot clear height, dock‑high loading, and full sprinkler coverage; Building 1 power: 1,000 to 1,200 amp 277/480V three‑phase electrical service


