Mixed-Use Building in Downtown
For Sale
$775,000
320 E Main St, Barrington, IL 60010
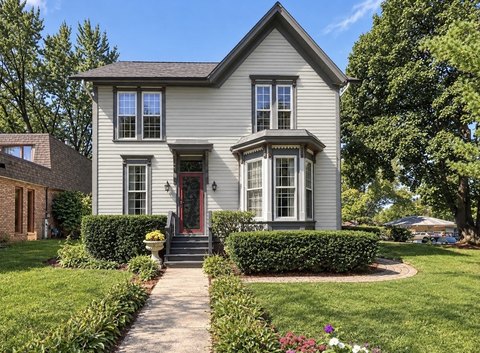
Updated commercial space with residential apartments in downtown Barrington.
Property Size5,200 SF
Price / SF$149.04
Days on Market230
Property Features for 320 E Main St
General Information
Standard status
Active
Size
5,200 SF
Building Details
Year Built
1900
Listing Agency:
Coldwell Banker Realty
Listed By:
Lisa Perry · License #475126007
(773) 818-1888
Source:
Tumpanelegacy
Added: Mar 10
Changed: Oct 15
Last Checked: Oct 7 at 4:04PM
Displayed information is deemed reliable but is not guaranteed and should be independently verified. All listing content including descriptions, pricing, images are the copyrighted material of Coldwell Banker Realty

Ask AI about this property
Review the available facts, identify missing information and prepare questions for the agent.
Investment Insights
Based on property information with market context.
Located on Main Street (Lake Cook Road) in Downtown Barrington, this mixed-use building presents an investment or owner-user opportunity. The main floor provides approximately 2,000 square feet of updated commercial space, previously used as a Medi-spa. The space includes a reception area, waiting room, six private offices, two restrooms, a kitchenette, and access to a rear porch. The second floor features two residential apartments. One is a two-bedroom, one-bathroom unit with an eat-in kitchen, living room, and a private porch. The other is a one-bedroom, one-bathroom unit with an eat-in kitchen, living room, and a private porch, currently occupied by a long-term tenant. The finished basement offers additional office space, multiple storage rooms, and a laundry area. The property has eight on-site parking spaces and is zoned B-2, allowing for a range of commercial uses.
Key Highlights
- Prime downtown Barrington location on Main Street (Lake Cook Road)
- Mixed‑use building with updated commercial space and two residential apartments
- Approximately 2,000 sq ft of updated commercial space suitable for various professional or wellness uses
Financial Insights
Estimated NOI and Cap Rate
NOI / Yr
$60,324
Cap Rate
7.78%
Suggested Prices Based on Cap Rates
Cap Rate 5%
$1,206,480
$1.2M
Cap Rate 7%
$861,771
$861.8K
Cap Rate 9%
$670,267
$670.3K
Market Conditions
NOI Build-Up for 5,200 SF
Gross rent
$117.9K $22.68/SF
− Vacancy
−$8.3K −$1.59/SF
EGI
$109.7K $21.09/SF
− OpEx
−$49.4K −$9.49/SF
NOI
$60.3K $11.60/SF
Area
Cook County, IL
Vacancy
7.00%
Lease Rate
$22.68 /SF/Yr
Expense Ratio
45.00%
Simulate Cap Rate and NOI
Suggested Prices Based on Cap Rates
Cap Rate 5%
$1,206,480
Cap Rate 7%
$861,771
Cap Rate 9%
$670,267
Alternative Uses
Best Use
Mixed Use
$1.25M
$1.10M – $1.46M
NOI $87,750 @ 7.0% cap · market cap 11.32%
Second Best
Office B
$1.02M
$896.2K – $1.19M
NOI $71,699 @ 7.0% cap · market cap 9.25%
Theoretical Best
Office A
$1.80M
$1.57M – $2.09M
NOI $125,673 @ 7.0% cap · market cap 16.22%
Zoning and permitted uses should be independently verified with authorities.
How Realmo checks its estimates
Property Analytics
Contact the owner directly
Get the owner's phone numbers and email
Open Analytics
Current Use
Location Intelligence
Trade Area within ½ mile
2,020
Businesses Nearby
Explore this area
Business Placement
Demographics for 60010, IL
46,365
Population
17,621
Households
2.6
Avg Household Size
47
Median Age
70%
College-Educated
97%
High-School Grad
74.1 sq mi
ZIP Area
626
Density / Sq Mi
$175,050
Median Household Income
$86,255
Median Earnings
$2,459
Median Rent
$622,900
Median Home Value
Check the figures for this property
Cap Rate, Value Estimation, Potential NOI and more
View Realmo Analytics
Market
Vacancy Rate% for Office in Midwest region




Frequently Asked Questions
What type of property is this?
Mixed-use property - Updated commercial space with residential apartments in downtown Barrington.
Where is this mixed-use property located?
The property is located at 320 E Main St Barrington, IL.
What is the asking price?
The asking price for this property is $775,000.
What are key features of this property?
This property features: Prime downtown Barrington location on Main Street (Lake Cook Road); Mixed‑use building with updated commercial space and two residential apartments; Approximately 2,000 sq ft of updated commercial space suitable for various professional or wellness uses


