Spartanburg Office Building For
For Sale
Contact for pricing
319 North Pine Street, Spartanburg, SC 29302
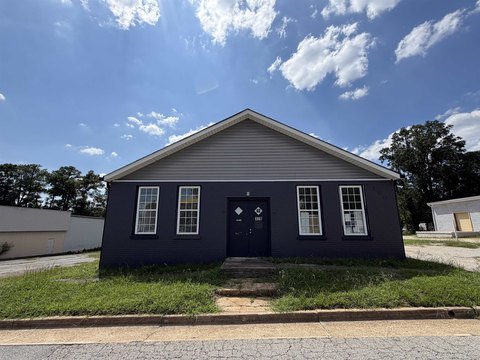
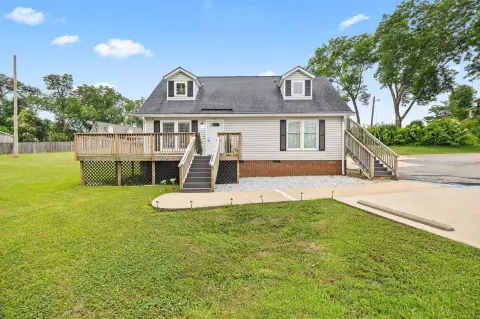
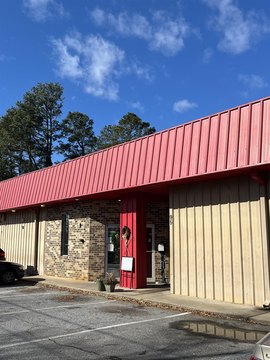
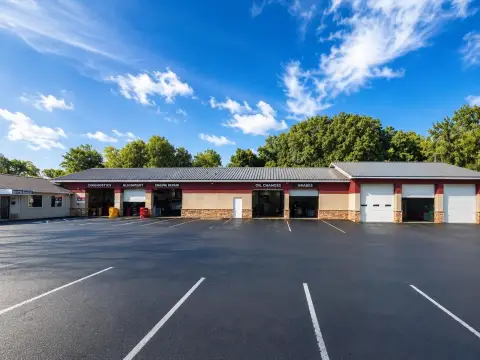
Office building in a growing downtown area with high foot traffic.
Property Size8,000 SF
Price / SF$187.50
Days on Market162
Property Features for 319 North Pine Street
General Information
Standard status
Active
Size
8,000 SF
Class
B
Property subtype
Office
Investment Type
Sale/Leaseback
Building Details
Stories
2
Listing Agency:
NAI Earle Furman Spartanburg
Listed By:
Mike Tanbonliong II · License #109381
Source:
Crexi
Added: May 11
Changed: Oct 3
Last Checked: Oct 16 at 8:44AM
Displayed information is deemed reliable but is not guaranteed and should be independently verified. All listing content including descriptions, pricing, images are the copyrighted material of NAI Earle Furman Spartanburg

Ask AI about this property
Review the available facts, identify missing information and prepare questions for the agent.
Investment Insights
Based on property information with market context.
Located in Spartanburg, South Carolina, this property benefits from the city's economic momentum, cultural vibrancy, and strategic public investment. The downtown area, anchored by a growing population and a strong daytime workforce, experiences steady foot traffic from nearby offices, educational institutions, and a dynamic small business community. Ongoing redevelopment and infrastructure improvements have transformed the urban core into a walkable environment appealing to residents and visitors. The central business district is experiencing a cultural renaissance, featuring a thriving arts scene, diverse dining, and year-round events. Spartanburg's location within the Upstate region positions it as a hub of growth and connectivity, with proximity to major interstates and larger markets. The property has a size of 8000 square feet.
Key Highlights
- Strong economic momentum and strategic public investment make Spartanburg a compelling destination.
- Growing population and strong daytime workforce ensure steady foot traffic.
- Ongoing redevelopment and infrastructure improvements have created a walkable, attractive urban environment.
Financial Insights
Estimated NOI and Cap Rate
NOI / Yr
$123,663
Cap Rate
8.24%
Suggested Prices Based on Cap Rates
Cap Rate 5%
$2,473,260
$2.5M
Cap Rate 7%
$1,766,614
$1.8M
Cap Rate 9%
$1,374,033
$1.4M
Market Conditions
NOI Build-Up for 8,000 SF
Gross rent
$193.0K $24.12/SF
− Vacancy
−$28.1K −$3.51/SF
EGI
$164.9K $20.61/SF
− OpEx
−$41.2K −$5.15/SF
NOI
$123.7K $15.46/SF
Area
Spartanburg County, SC
Vacancy
14.55%
Lease Rate
$24.12 /SF/Yr
Expense Ratio
25.00%
Simulate Cap Rate and NOI
Suggested Prices Based on Cap Rates
Cap Rate 5%
$2,473,260
Cap Rate 7%
$1,766,614
Cap Rate 9%
$1,374,033
Alternative Uses
Best Use
Office B
$1.77M
$1.55M – $2.06M
NOI $123,663 @ 7.0% cap · market cap 8.24%
Second Best
—
—
no second resolved use
Theoretical Best
Warehouse
$6.21M
$5.43M – $7.25M
NOI $434,740 @ 7.0% cap · market cap 28.98%
Zoning and permitted uses should be independently verified with authorities.
How Realmo checks its estimates
Property Analytics
Unlock full access to Insights
Subscribe to Realmo Intelligence
Open Analytics
Current Use
Location Intelligence
Trade Area within ½ mile
14
Businesses Nearby
Explore this area
Business Placement
Demographics for 29302, SC
17,356
Population
8,169
Households
2.1
Avg Household Size
42
Median Age
41%
College-Educated
92%
High-School Grad
50.7 sq mi
ZIP Area
342
Density / Sq Mi
$77,428
Median Household Income
$44,476
Median Earnings
$1,031
Median Rent
$264,000
Median Home Value
Check the figures for this property
Cap Rate, Value Estimation, Potential NOI and more
View Realmo Analytics
Market
Vacancy Rate% for Office in South region






Frequently Asked Questions
What type of property is this?
Office building - Office building in a growing downtown area with high foot traffic.
Where is this office building located?
The property is located at 319 North Pine Street Spartanburg, SC.
What is the asking price?
The asking price for this property is $1,500,000.
What are key features of this property?
This property features: Strong economic momentum and strategic public investment make Spartanburg a compelling destination.; Growing population and strong daytime workforce ensure steady foot traffic.; Ongoing redevelopment and infrastructure improvements have created a walkable, attractive urban environment.


