MainStay Suites Extended-Stay
For Sale
Contact for pricing
3185 S DIRKSEN PKWY, Springfield, IL 62703
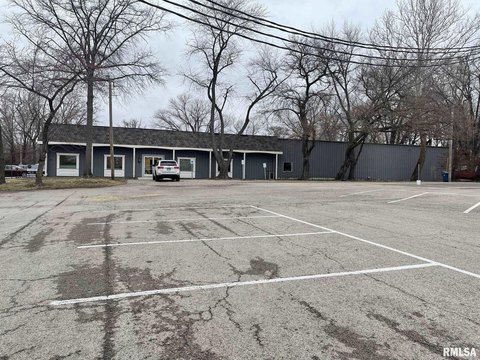
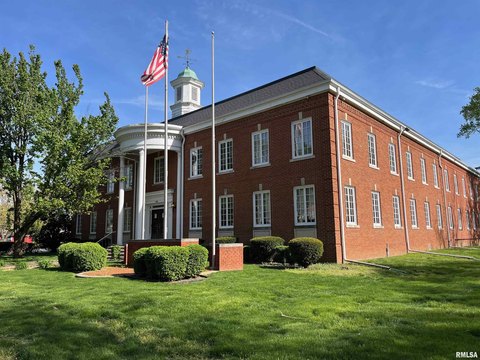
A 109-suite lodging property operating under the Choice Hotels flag in Springfield’s established hospitality market.
Property Size63,172 SF
Price / SF$74.32
Days on Market176
Property Features for 3185 S DIRKSEN PKWY
General Information
Standard status
Active
Size
63,172 SF
Property subtype
Hospitality
Net Operating Income
$542,557
Building Details
Year Built
1987
Year Renovated
2024
Stories
4
Units
1
Listing Agency:
Charles Hart Hospitality
Listed By:
Alex K. Fifner · License #2013003197
Source:
Crexi
Added: Apr 24
Changed: Oct 8
Last Checked: Oct 16 at 7:10AM
Displayed information is deemed reliable but is not guaranteed and should be independently verified. All listing content including descriptions, pricing, images are the copyrighted material of Charles Hart Hospitality

Ask AI about this property
Review the available facts, identify missing information and prepare questions for the agent.
Investment Insights
Based on property information with market context.
MainStay Suites is a 109-suite extended-stay hotel at 3185 S Dirksen Pkwy in Springfield, Illinois. The property contains 63,172 square feet and was built in 1987. It operates under the Choice Hotels flag, providing an established branded platform within the hospitality sector.
The hotel is positioned in Springfield, the Illinois state capital, with demand tied to state government and related agencies, healthcare providers, higher education, corporate employers, and historical tourism. Notable demand generators identified for the market include HSHS St. John’s Hospital, Memorial Health, and Abraham Lincoln presidential sites and museums.
Current performance is reported at 42% of the competitive set’s trailing 12-month RevPAR. The property’s extended-stay configuration and existing franchise affiliation provide the basis for evaluating operational performance and physical improvements within the asset.
The hotel is positioned in Springfield, the Illinois state capital, with demand tied to state government and related agencies, healthcare providers, higher education, corporate employers, and historical tourism. Notable demand generators identified for the market include HSHS St. John’s Hospital, Memorial Health, and Abraham Lincoln presidential sites and museums.
Current performance is reported at 42% of the competitive set’s trailing 12-month RevPAR. The property’s extended-stay configuration and existing franchise affiliation provide the basis for evaluating operational performance and physical improvements within the asset.
Key Highlights
- 109‑suite extended‑stay hotel
- 63,172 square feet on 3185 S Dirksen Pkwy, Springfield, IL 62703
- Operating under the Choice Hotels flag
Financial Insights
Estimated NOI and Cap Rate
NOI / Yr
$367,282
Cap Rate
7.82%
Suggested Prices Based on Cap Rates
Cap Rate 5%
$7,345,640
$7.3M
Cap Rate 7%
$5,246,886
$5.2M
Cap Rate 9%
$4,080,911
$4.1M
Market Conditions
NOI Build-Up for 63,172 SF
Gross rent
$909.7K $14.40/SF
− Vacancy
−$136.5K −$2.16/SF
EGI
$773.2K $12.24/SF
− OpEx
−$405.9K −$6.43/SF
NOI
$367.3K $5.81/SF
Area
Springfield, IL
Vacancy
15.00%
Lease Rate
$14.40 /SF/Yr
Expense Ratio
52.50%
Simulate Cap Rate and NOI
Suggested Prices Based on Cap Rates
Cap Rate 5%
$7,345,640
Cap Rate 7%
$5,246,886
Cap Rate 9%
$4,080,911
Alternative Uses
Best Use
Hotel Hospitality
$5.25M
$4.59M – $6.12M
NOI $367,282 @ 7.0% cap · market cap 7.82%
Second Best
—
—
no second resolved use
Theoretical Best
Office A
$15.51M
$13.57M – $18.09M
NOI $1,085,699 @ 7.0% cap · market cap 23.12%
Zoning and permitted uses should be independently verified with authorities.
How Realmo checks its estimates
Property Analytics
Unlock full access to Insights
Subscribe to Realmo Intelligence
Open Analytics
Current Use
Location Intelligence
Trade Area within ½ mile
321
Businesses Nearby
Explore this area
Business Placement
Demographics for 62703, IL
28,344
Population
14,320
Households
2
Avg Household Size
37
Median Age
21%
College-Educated
85%
High-School Grad
14.9 sq mi
ZIP Area
1,902
Density / Sq Mi
$44,580
Median Household Income
$36,345
Median Earnings
$971
Median Rent
$93,100
Median Home Value
Check the figures for this property
Cap Rate, Value Estimation, Potential NOI and more
View Realmo Analytics




Frequently Asked Questions
What type of property is this?
Hotel - A 109-suite lodging property operating under the Choice Hotels flag in Springfield’s established hospitality market.
Where is this hotel located?
The property is located at 3185 S DIRKSEN PKWY Springfield, IL.
What is the asking price?
The asking price for this property is $4,695,000.
What are key features of this property?
This property features: 109‑suite extended‑stay hotel; 63,172 square feet on 3185 S Dirksen Pkwy, Springfield, IL 62703; Operating under the Choice Hotels flag


