Two-Story Triplex with Separate
For Sale
$800,000
317 SW 9TH Avenue #1-3, Fort Lauderdale, FL 33312
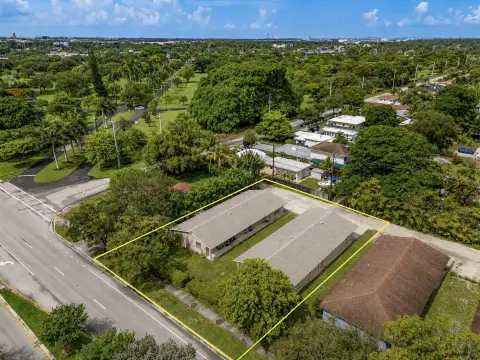
The occupied upper unit is renovated, while two lower units require repairs following flood damage.
Property Size1,820 SF
Price / SF$439.56
Days on Market48
Property Features for 317 SW 9TH Avenue #1-3
General Information
Standard status
Active
Size
1,820 SF
Total Parking Spaces
6
Property subtype
Residential Income
Zoning
RML-25
Property Condition
Severity
Major Repairs Needed
Evidence
sustained water damage from flooding and require renovation and repairs
Additional Details
Multifamily Units
3
Taxes and HOA fees
Annual Taxes
$18,597
Building Details
Building Size
1,820 SF
Year Built
1952
Buildings
1
Stories
2
Listing Agency:
Smart Property Moves LLC
Listed By:
Cindy L Carrion Sarro · License #702727
(954) 309-7373
Source:
Laerrealty
Added: Sep 4
Changed: Oct 14
Last Checked: Oct 20 at 5:58PM
Displayed information is deemed reliable but is not guaranteed and should be independently verified. All listing content including descriptions, pricing, images are the copyrighted material of Smart Property Moves LLC

Ask AI about this property
Review the available facts, identify missing information and prepare questions for the agent.
Investment Insights
Based on property information with market context.
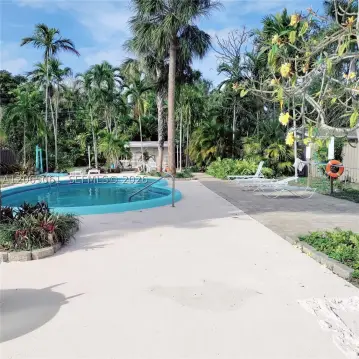
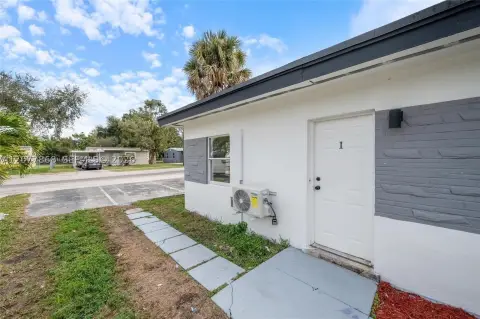
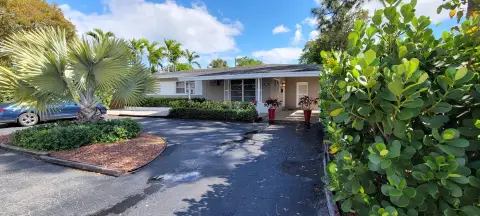
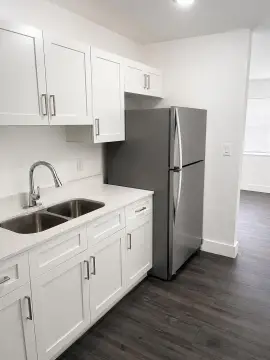
This 1952 two-story triplex includes three residential units with separate entrances and three individual meters. The second-floor unit has been renovated with one bedroom, one bathroom, a full kitchen, living space, and laundry, and is currently occupied. Both first-floor units have private entrances but sustained flooding-related water damage and require renovation and repairs. The property also includes 2 mini split A/C units.
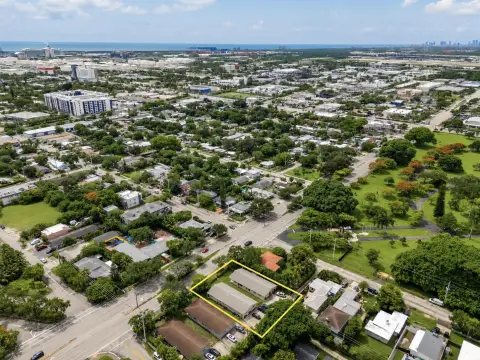
Located at 317 SW 9th Avenue in Fort Lauderdale’s Sailboat Bend Historic District, the property is within the area covered by the City of Fort Lauderdale’s Fortify Lauderdale Stormwater Improvement Project. The project addresses stormwater infrastructure in the district. A current city lien is associated with the property, and the roof age is not documented.
Located at 317 SW 9th Avenue in Fort Lauderdale’s Sailboat Bend Historic District, the property is within the area covered by the City of Fort Lauderdale’s Fortify Lauderdale Stormwater Improvement Project. The project addresses stormwater infrastructure in the district. A current city lien is associated with the property, and the roof age is not documented.
Key Highlights
- Three‑unit, two‑story residential property built in 1952
- Second‑floor 1 bedroom/1 bathroom unit is renovated and occupied
- Two first‑floor units have private entrances and require renovation after flood damage
Financial Insights
Estimated NOI and Cap Rate
NOI / Yr
$30,339
Cap Rate
3.79%
Suggested Prices Based on Cap Rates
Cap Rate 5%
$606,780
$606.8K
Cap Rate 7%
$433,414
$433.4K
Cap Rate 9%
$337,100
$337.1K
Market Conditions
NOI Build-Up for 1,820 SF
Gross rent
$45.9K $25.20/SF
− Vacancy
−$2.5K −$1.39/SF
EGI
$43.3K $23.81/SF
− OpEx
−$13.0K −$7.14/SF
NOI
$30.3K $16.67/SF
Area
Fort Lauderdale, FL
Vacancy
5.50%
Lease Rate
$25.20 /SF/Yr
Expense Ratio
30.00%
Simulate Cap Rate and NOI
Suggested Prices Based on Cap Rates
Cap Rate 5%
$606,780
Cap Rate 7%
$433,414
Cap Rate 9%
$337,100
Alternative Uses
Best Use
Multifamily LT 5
$433.4K
$379.2K – $505.7K
NOI $30,339 @ 7.0% cap · market cap 3.79%
Second Best
Apartment 5plus
$390.4K
$341.6K – $455.5K
NOI $27,330 @ 7.0% cap · market cap 3.42%
Theoretical Best
Office A
$1.22M
$1.07M – $1.43M
NOI $85,613 @ 7.0% cap · market cap 10.70%
Zoning and permitted uses should be independently verified with authorities.
How Realmo checks its estimates
Property Analytics
Lease Details
3
Residential units
Location Intelligence
Trade Area within ½ mile
1,924
Businesses Nearby
Explore this area
Business Placement
Demographics for 33312, FL
51,570
Population
21,332
Households
2.4
Avg Household Size
39
Median Age
28%
College-Educated
86%
High-School Grad
11.1 sq mi
ZIP Area
4,646
Density / Sq Mi
$77,644
Median Household Income
$39,333
Median Earnings
$1,566
Median Rent
$397,800
Median Home Value
Market
Vacancy Rate% for Multifamily in South region





Frequently Asked Questions
What type of property is this?
Triplex - The occupied upper unit is renovated, while two lower units require repairs following flood damage.
Where is this triplex located?
The property is located at 317 SW 9TH Avenue #1-3 Fort Lauderdale, FL.
What is the asking price?
The asking price for this property is $800,000.
What are key features of this property?
This property features: Three‑unit, two‑story residential property built in 1952; Second‑floor 1 bedroom/1 bathroom unit is renovated and occupied; Two first‑floor units have private entrances and require renovation after flood damage


