Downtown Retail Building with Multiple
For Sale
$169,900
317 317/319 Loockerman St, Dover, DE 19904
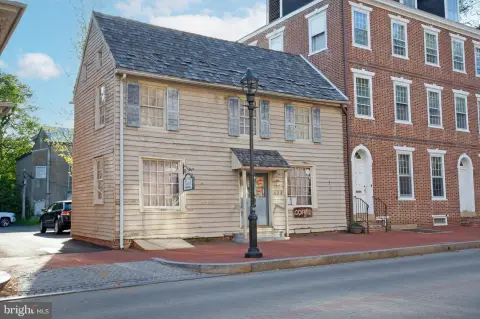
Commercial building for sale in downtown Dover, configured for retail with multiple street-level entrances and as-is condition.
Property Size1,166 SF
Price / SF$145.71
Days on Market94
Property Features for 317 317/319 Loockerman St
General Information
Standard status
Active
Size
1,166 SF
Property subtype
Business Opportunity
Building Details
Year Built
1910
Listing Agency:
RE/MAX Horizons
Listed By:
Karen Smolarek · License #R3-0013561
(302) 423-8040
Source:
Kandorre
Added: Jul 20
Changed: Oct 12
Last Checked: Oct 7 at 12:58PM
Displayed information is deemed reliable but is not guaranteed and should be independently verified. All listing content including descriptions, pricing, images are the copyrighted material of RE/MAX Horizons

Ask AI about this property
Review the available facts, identify missing information and prepare questions for the agent.
Investment Insights
Based on property information with market context.
This commercial building is offered for sale in downtown Dover with street-level storefront space and multiple entrances. Public remarks indicate a prior two-level configuration that included a second-floor apartment and a barber/beauty shop on the lower level. The building has a new tin roof that was installed, and the property is being sold in as-is condition with no guarantees written or expressed, with a structural report on file for agents to review.
The property is located on Loockerman Street in downtown Dover and is described as suitable for retail, financial, office use, and more. Electricity is not available, and the seller notes that a high-powered flashlight may be needed for access. Buyers and agents must sign a hold harmless before scheduling a showing, and the seller requests that neither the left door nor the service door be opened to help maintain security.
The building is currently vacant for ownership without a required lease, and it will require gutting and renovation to bring it to an operating condition.
The property is located on Loockerman Street in downtown Dover and is described as suitable for retail, financial, office use, and more. Electricity is not available, and the seller notes that a high-powered flashlight may be needed for access. Buyers and agents must sign a hold harmless before scheduling a showing, and the seller requests that neither the left door nor the service door be opened to help maintain security.
The building is currently vacant for ownership without a required lease, and it will require gutting and renovation to bring it to an operating condition.
Key Highlights
- Commercial building built in 1910 in downtown Dover, offered as‑is (no guarantees written or expressed).
- Previously configured with a barber/beauty shop on the lower level; a second‑floor apartment existed at one time.
- New tin roof installed by the Amish (beautiful tin roof referenced in remarks).
Financial Insights
Estimated NOI and Cap Rate
NOI / Yr
$10,600
Cap Rate
6.24%
Suggested Prices Based on Cap Rates
Cap Rate 5%
$212,000
$212.0K
Cap Rate 7%
$151,429
$151.4K
Cap Rate 9%
$117,778
$117.8K
Market Conditions
NOI Build-Up for 1,166 SF
Gross rent
$16.4K $14.04/SF
− Vacancy
−$1.2K −$1.05/SF
EGI
$15.1K $12.99/SF
− OpEx
−$4.5K −$3.90/SF
NOI
$10.6K $9.09/SF
Area
Kent County, DE
Vacancy
7.50%
Lease Rate
$14.04 /SF/Yr
Expense Ratio
30.00%
Simulate Cap Rate and NOI
Suggested Prices Based on Cap Rates
Cap Rate 5%
$212,000
Cap Rate 7%
$151,429
Cap Rate 9%
$117,778
Alternative Uses
Best Use
Retail
$151.4K
$132.5K – $176.7K
NOI $10,600 @ 7.0% cap · market cap 6.24%
Second Best
—
—
no second resolved use
Theoretical Best
Office A
$293.6K
$256.9K – $342.5K
NOI $20,552 @ 7.0% cap · market cap 12.10%
Zoning and permitted uses should be independently verified with authorities.
How Realmo checks its estimates
Property Analytics
Contact the owner directly
Get the owner's phone numbers and email
Open Analytics
Current Use
Location Intelligence
Trade Area within ½ mile
3,333
Businesses Nearby
14k
Monthly Visits Nearby
Under-served
Demand for This Use
Explore this area
Business Placement
Foot Traffic Nearby
Shops & Services 71%
Dining 26%
Home Improvements & Furnishings 3%
M&T Bank
Shops & Services
4,988 visits/mo
0.3 miles
Krispy Krunchy Chicken
Dining
3,678 visits/mo
0.1 miles
PNC Bank
Shops & Services
3,399 visits/mo
0.3 miles
Napa Auto Parts
Shops & Services
1,896 visits/mo
0.2 miles
Sunbelt Rentals, Inc.
Home Improvements & Furnishings
462 visits/mo
0.5 miles
Demographics for 19904, DE
36,880
Population
16,047
Households
2.3
Avg Household Size
38
Median Age
27%
College-Educated
91%
High-School Grad
43.2 sq mi
ZIP Area
854
Density / Sq Mi
$66,885
Median Household Income
$39,459
Median Earnings
$1,240
Median Rent
$281,000
Median Home Value
Check the figures for this property
Cap Rate, Value Estimation, Potential NOI and more
View Realmo Analytics
Market
Vacancy Rate% for Retail in South region






Frequently Asked Questions
What type of property is this?
Storefront property - Commercial building for sale in downtown Dover, configured for retail with multiple street-level entrances and as-is condition.
Where is this storefront property located?
The property is located at 317 317/319 Loockerman St Dover, DE.
What is the asking price?
The asking price for this property is $169,900.
What are key features of this property?
This property features: Commercial building built in 1910 in downtown Dover, offered as‑is (no guarantees written or expressed).; Previously configured with a barber/beauty shop on the lower level; a second‑floor apartment existed at one time.; New tin roof installed by the Amish (beautiful tin roof referenced in remarks).


