Mid-Century Duplex with Detached
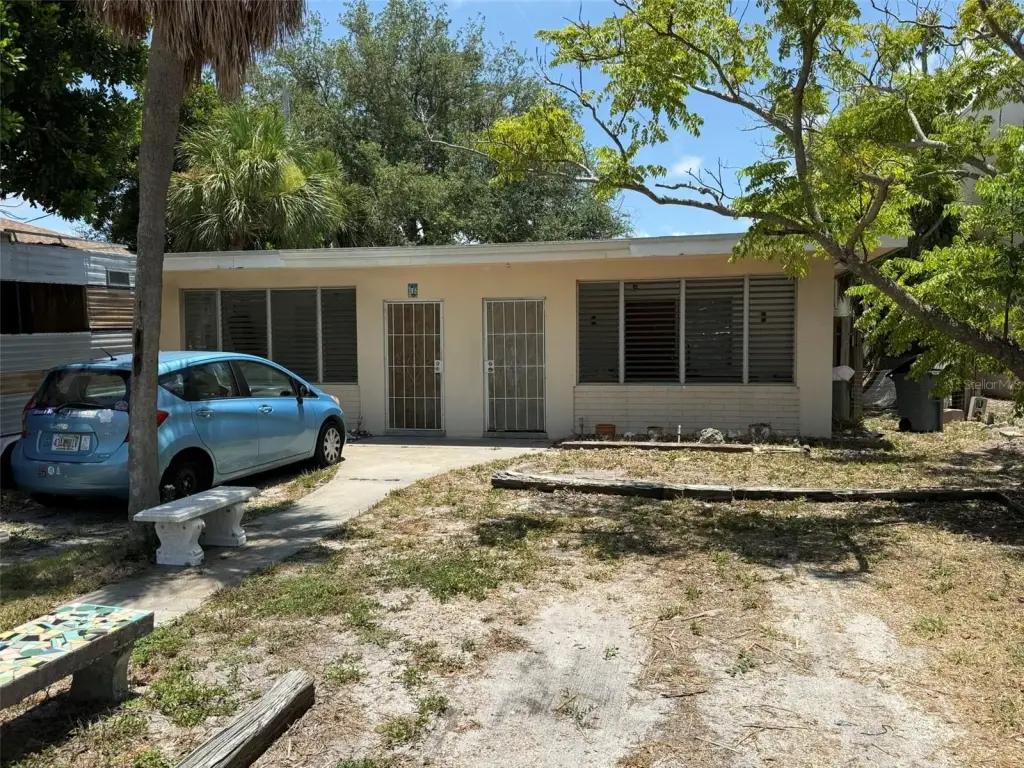
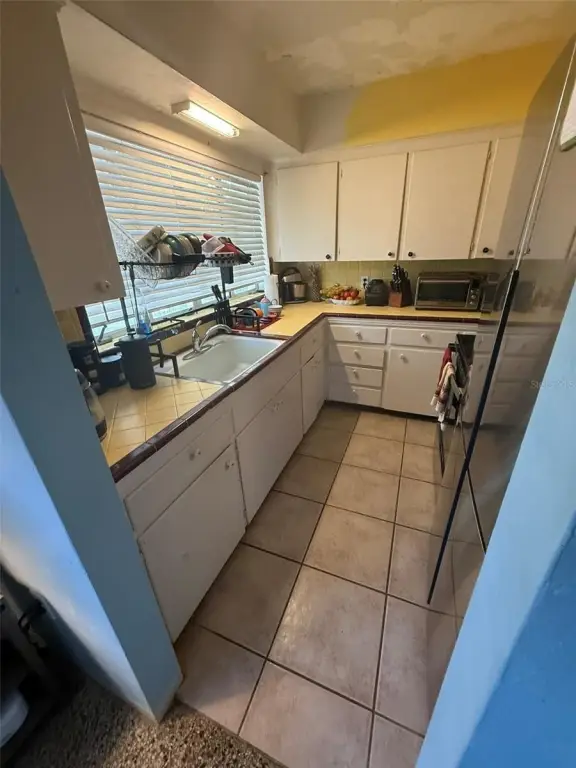
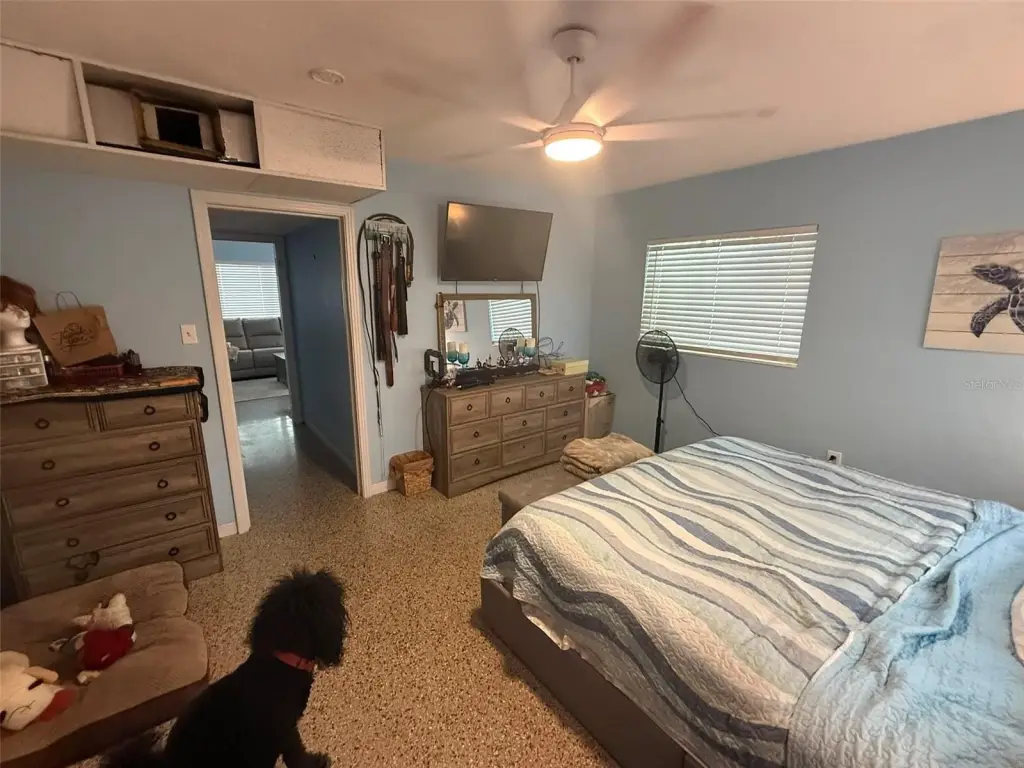
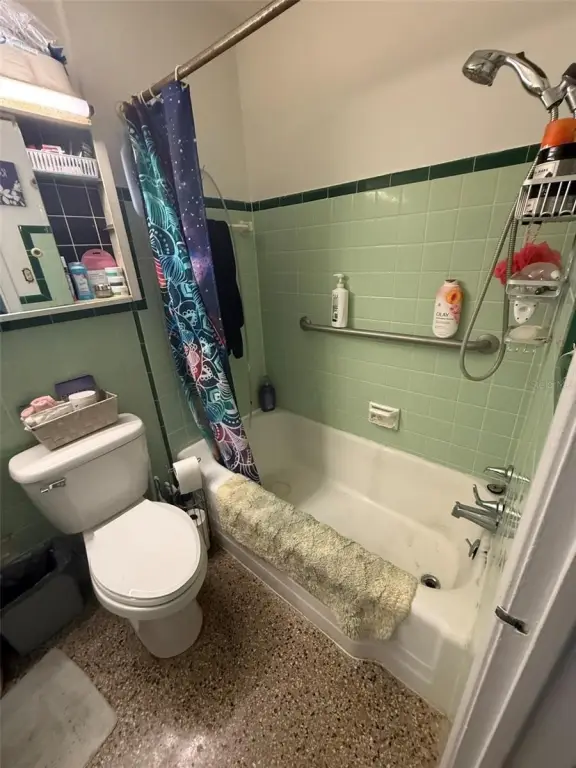
For Sale
$379,900
316 76TH Avenue, St Pete Beach, FL 33706
Residential Income, ST PETE BEACH, FL
Property Size1,156 SF
Lot Size0.12 Acres
Price / SF$328.63
Days on Market114
Property Features for 316 76TH Avenue
General Information
Property type
Residential Multi Family
Property subtype
Duplex
Zoning
TC-1
Bedrooms
2
Bathrooms
2
Full bathrooms
2
Rooms
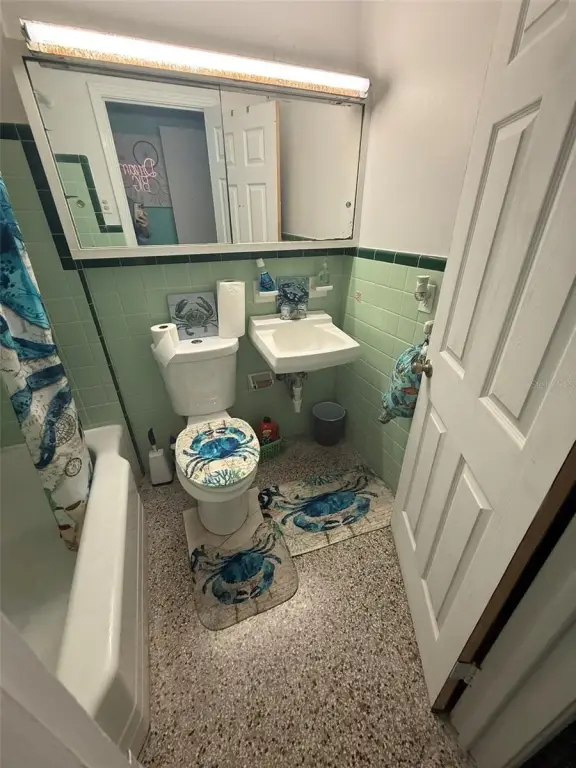
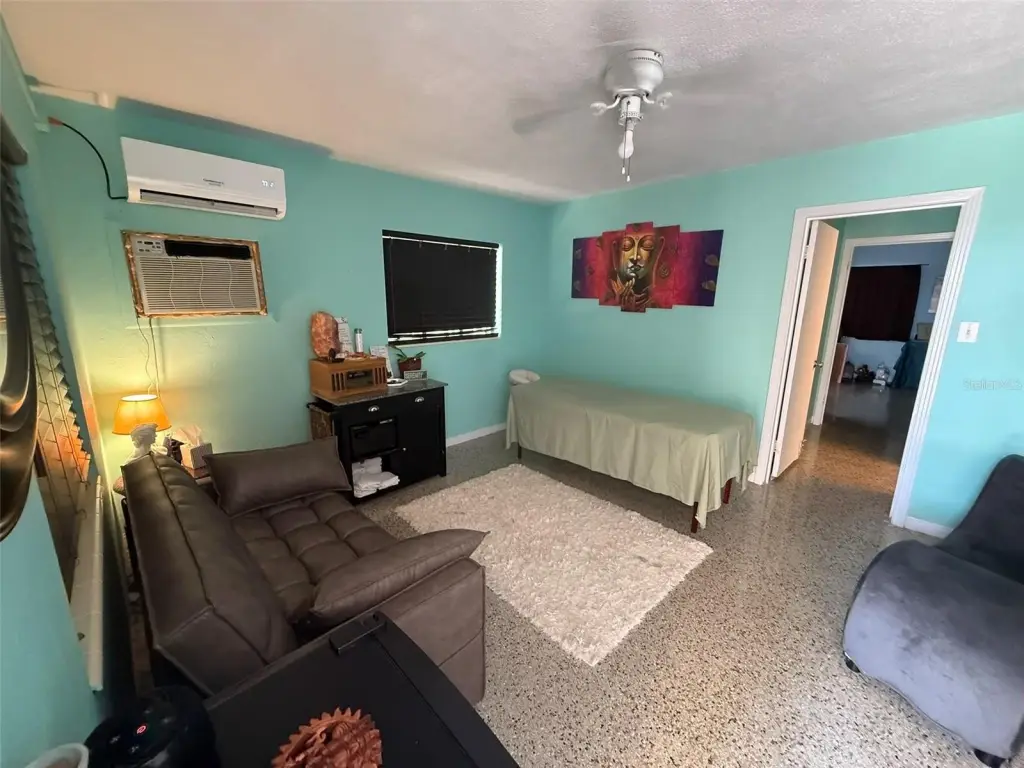
Bedroom 1, Bathroom 2, Bathroom 1, Bedroom 2
Parking features
Off Street, Open, Garage, On Street
Patio and Porch features
Porch
Interior features
Primary Bedroom Main Floor, Window Treatments
Exterior features
Private Entrance, Storage
Subdivision
ST PETERSBURG BEACH REP
Lot features
Flood Zone, City Limits, Near Public Transit, Paved
Directions
if coming from the north on Blind Pass Rd, suggest you turn left at 78th Ave - to Boca Ciega Ave, turn right for 2 blocks and park across the street from the property ....
Standard status
Active
APN
36-31-15-77994-068-0130
Size
1,156 SF
Lot size
0.12 Acres
Taxes and HOA fees
Tax Year
2025
Tax Description
ST PETERSBURG BEACH REPLAT BLK 68, LOT 13
Tax Annual Amount
4080
Legal Description
ST PETERSBURG BEACH REPLAT BLK 68, LOT 13
Utilities
Utilities
Cable Available
Sewer type
Public Sewer
Heating system
Electric (Heating), Central
Cooling system
Central Air
Water source
Public
Building Details
Year built
1955
Floors in Building
1
Number of units
2
Flooring type
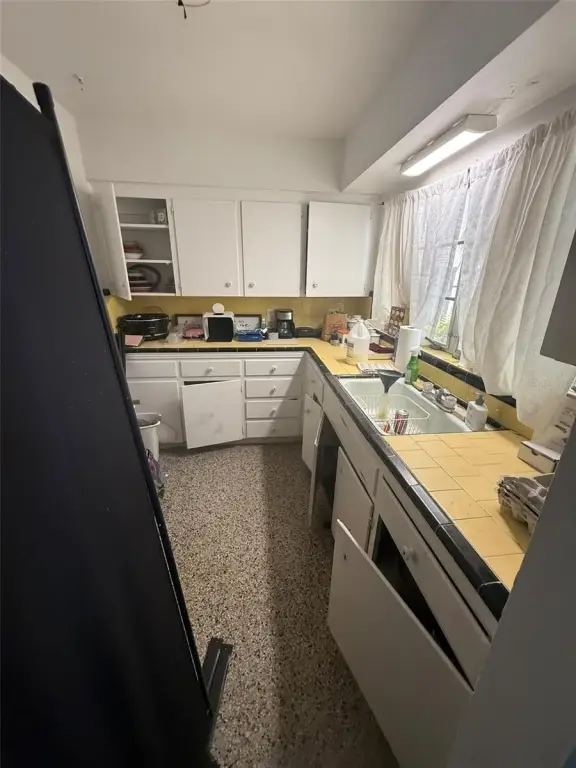
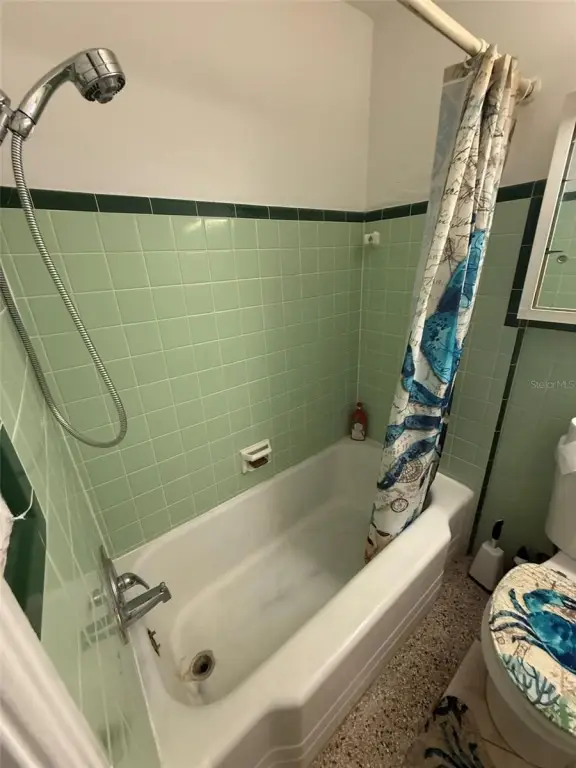
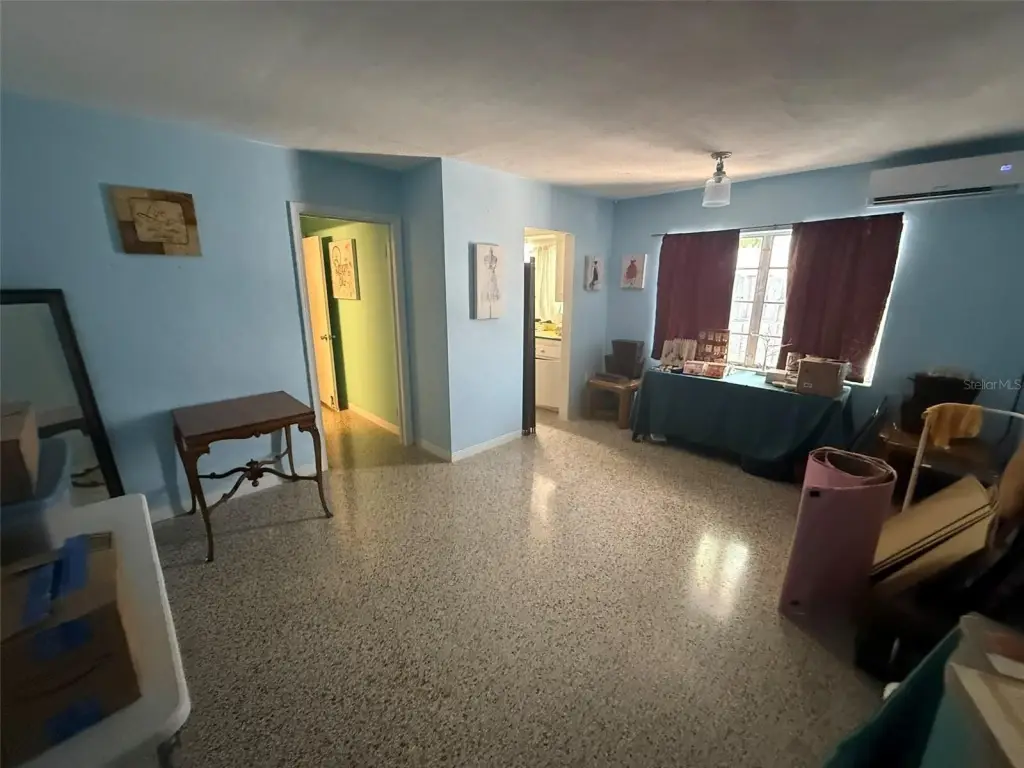
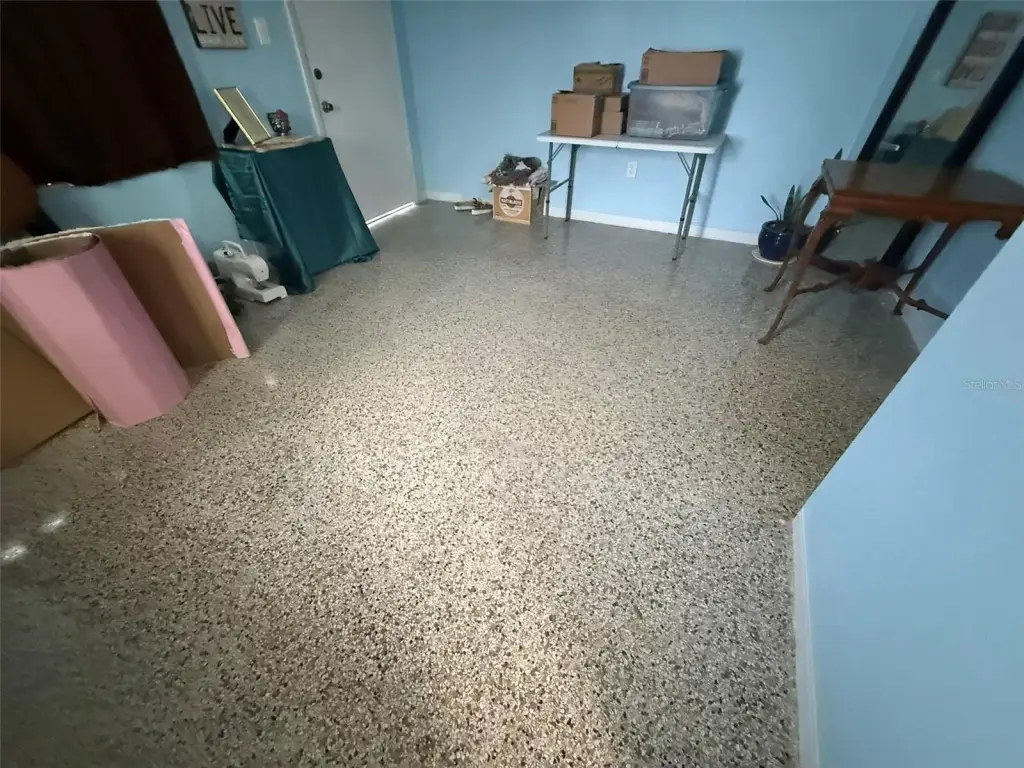
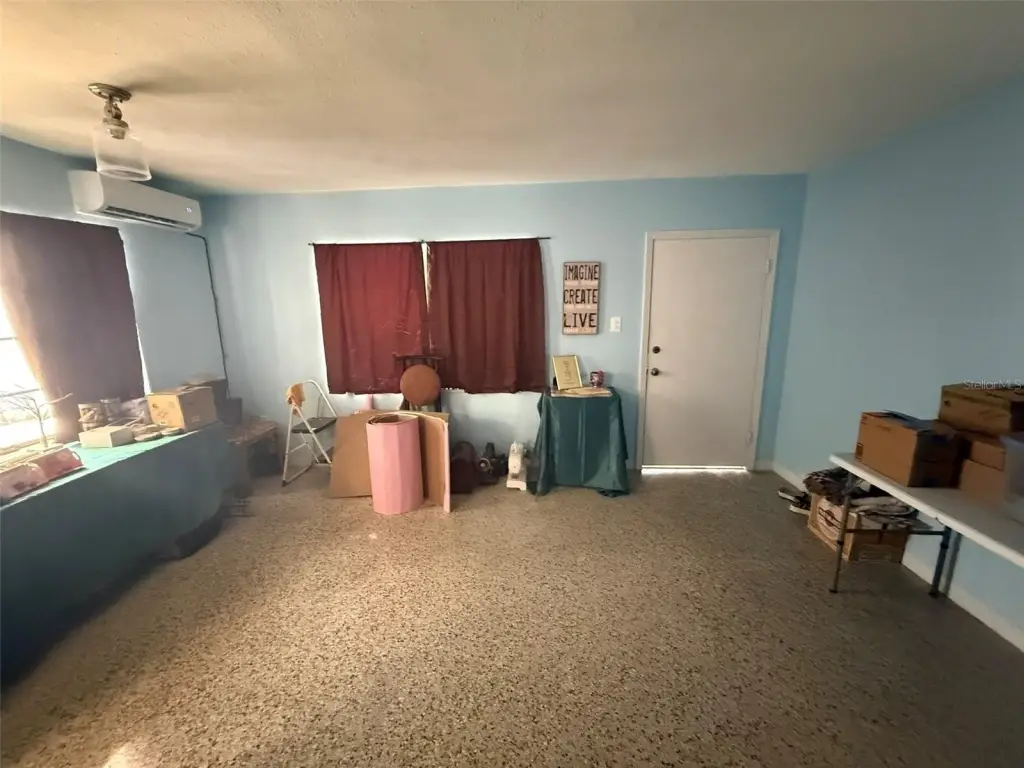
Terrazzo
Building materials
Block, Stucco
Additional Structures
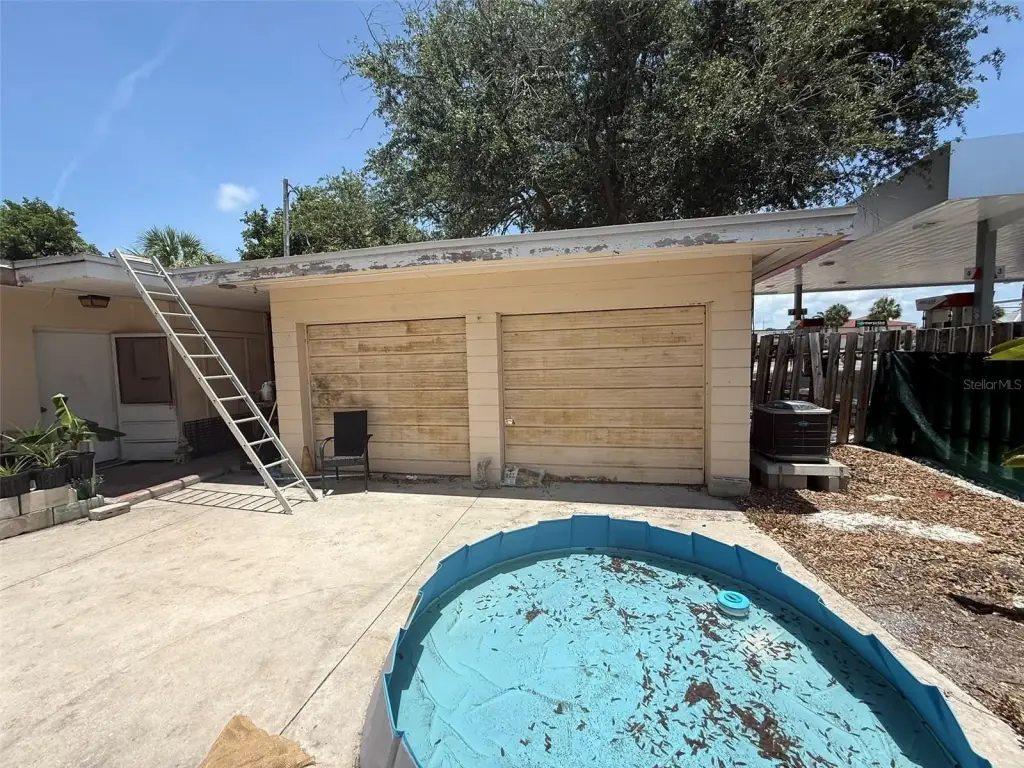
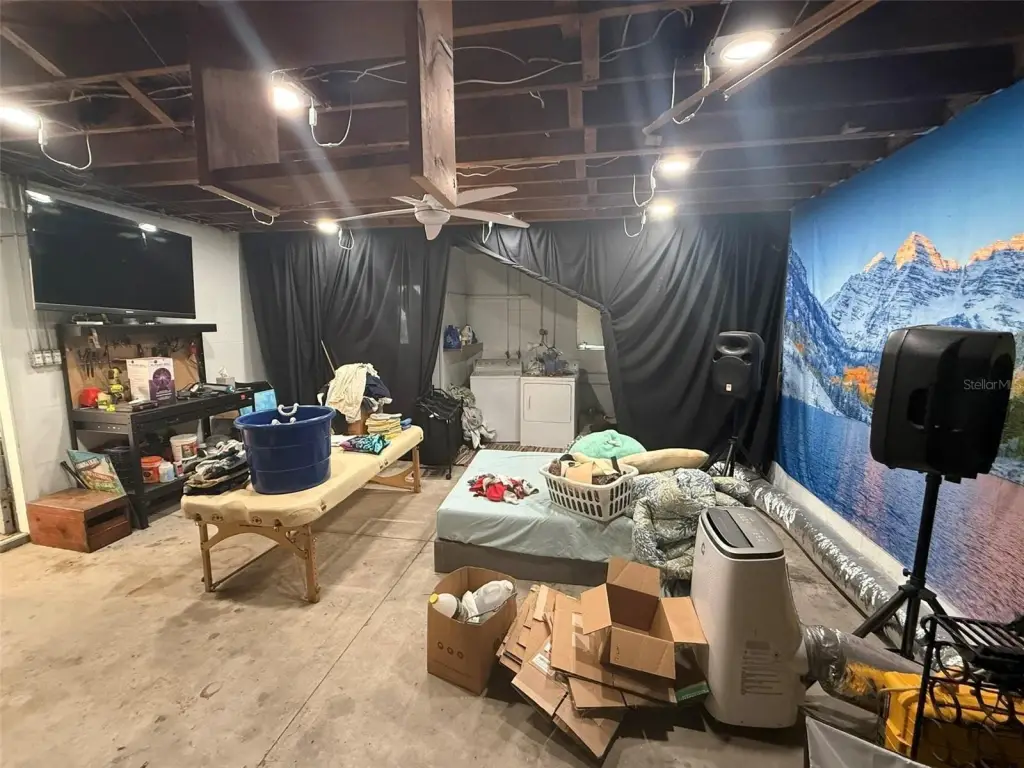
Outbuilding, Storage
Listing Agency:
SMITH & ASSOCIATES REAL ESTATE
(727) 342-3800
Listed By:
Don Taylor
(727) 513-7828
Added: Jul 2
Changed: Oct 16
Last Checked: Oct 23 at 3:06PM
MLS# TB8523833
Copyright © 2026 Stellar MLS. All rights reserved. All information provided by the listing agent/broker is deemed reliable but is not guaranteed and should be independently verified.

Ask AI about this property
Review the available facts, identify missing information and prepare questions for the agent.
Investment Insights
Based on property information with market context.
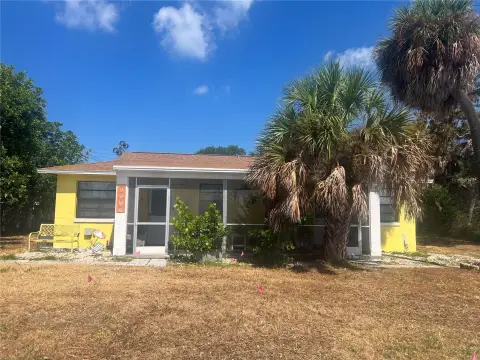
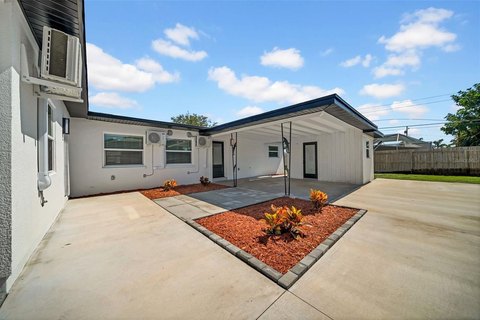
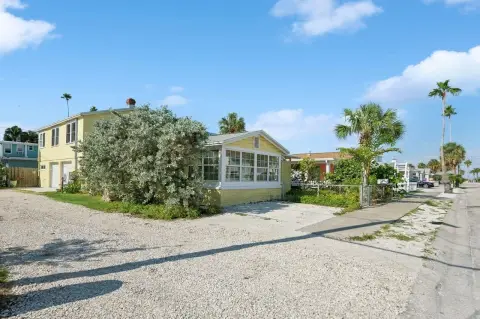
Built in 1955, this block-and-stucco duplex contains two one-bedroom, one-bath units along with a detached second structure on a 5,375-square-foot lot. The 1,156-square-foot property includes original terrazzo flooring, private entrances, storage, a porch, off-street parking, garage, and street parking options. Central AC was installed in 2018, with ductless mini-splits and a new electric water heater also noted. The property is offered as-is for cosmetic and structural improvements.
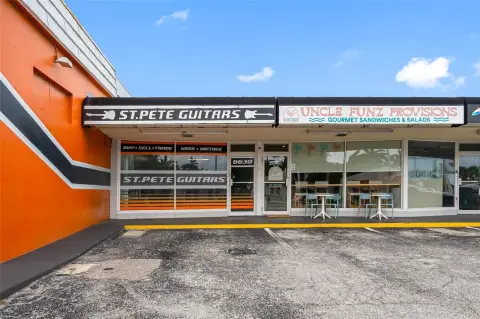
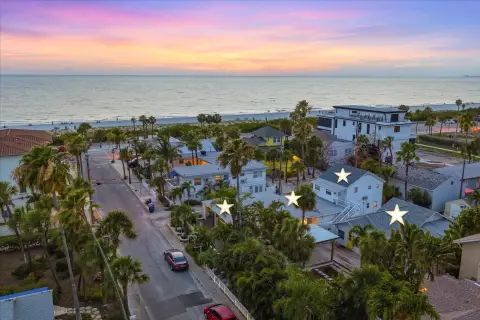
Zoned TC-1, the parcel is the only remaining residential use on its block, positioned between a retail building and medical office with a gas station behind it. Corey Avenue shops, restaurants, and the Sunday Market are a three- to four-minute walk away. Horan Park and the city’s family aquatic center are across the street, while Upham Beach is approximately a half-mile away. The zoning schedule identifies neighborhood-commercial uses including office, retail, dining, artist studios, galleries, printing, and commercial kitchens; any change of use should be confirmed with the City of St. Pete Beach.
Zoned TC-1, the parcel is the only remaining residential use on its block, positioned between a retail building and medical office with a gas station behind it. Corey Avenue shops, restaurants, and the Sunday Market are a three- to four-minute walk away. Horan Park and the city’s family aquatic center are across the street, while Upham Beach is approximately a half-mile away. The zoning schedule identifies neighborhood-commercial uses including office, retail, dining, artist studios, galleries, printing, and commercial kitchens; any change of use should be confirmed with the City of St. Pete Beach.
Key Highlights
- Two 1BR/1BA units plus a detached second structure
- 1,156 square feet on a 5,375‑square‑foot lot
- TC‑1 zoning with listed neighborhood‑commercial uses
Financial Insights
Estimated NOI and Cap Rate
NOI / Yr
$13,493
Cap Rate
3.55%
Suggested Prices Based on Cap Rates
Cap Rate 5%
$269,860
$269.9K
Cap Rate 7%
$192,757
$192.8K
Cap Rate 9%
$149,922
$149.9K
Market Conditions
NOI Build-Up for 1,156 SF
Gross rent
$20.7K $17.88/SF
− Vacancy
−$1.4K −$1.21/SF
EGI
$19.3K $16.67/SF
− OpEx
−$5.8K −$5.00/SF
NOI
$13.5K $11.67/SF
Area
Pinellas County, FL
Vacancy
6.74%
Lease Rate
$17.88 /SF/Yr
Expense Ratio
30.00%
Simulate Cap Rate and NOI
Suggested Prices Based on Cap Rates
Cap Rate 5%
$269,860
Cap Rate 7%
$192,757
Cap Rate 9%
$149,922
Alternative Uses
Best Use
Multifamily LT 5
$192.8K
$168.7K – $224.9K
NOI $13,493 @ 7.0% cap · market cap 3.55%
Second Best
Apartment 5plus
$151.9K
$132.9K – $177.2K
NOI $10,632 @ 7.0% cap · market cap 2.80%
Theoretical Best
Office A
$300.7K
$263.1K – $350.8K
NOI $21,048 @ 7.0% cap · market cap 5.54%
Zoning and permitted uses should be independently verified with authorities.
How Realmo checks its estimates
Property Analytics
Contact the owner directly
Get the owner's phone numbers and email
Open Analytics
Lease Details
2
Residential units
Location Intelligence
Trade Area within ½ mile
1,054
Businesses Nearby
Explore this area
Business Placement
Demographics for 33706, FL
15,309
Population
14,199
Households
1.1
Avg Household Size
60
Median Age
54%
College-Educated
97%
High-School Grad
3.7 sq mi
ZIP Area
4,138
Density / Sq Mi
$97,364
Median Household Income
$80,504
Median Earnings
$1,646
Median Rent
$616,800
Median Home Value
Check the figures for this property
Cap Rate, Value Estimation, Potential NOI and more
View Realmo Analytics
Market
Vacancy Rate% for Multifamily in South region





Frequently Asked Questions
What type of property is this?
Duplex - Two one-bedroom units offer a walkable beach-area location, terrazzo flooring, off-street parking, and updated mechanical systems.
Where is this duplex located?
The property is located at 316 76TH Avenue St Pete Beach, FL.
What is the asking price?
The asking price for this property is $379,900.
What are key features of this property?
This property features: Two 1BR/1BA units plus a detached second structure; 1,156 square feet on a 5,375‑square‑foot lot; TC‑1 zoning with listed neighborhood‑commercial uses


