Updated Patio-Style
For Sale
$225,000
3150 S Sagamont Avenue, Springfield, MO 65807
Residential, Springfield, MO
Property Size1,119 SF
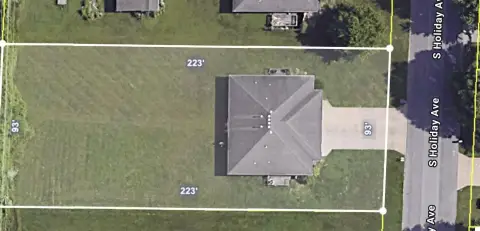
Lot Size0.07 Acres
Price / SF$201.07
Days on Market49
Property Features for 3150 S Sagamont Avenue
General Information
Property type
Residential Multi Family
Property subtype
Duplex
Bedrooms
2
Bathrooms
2
Full bathrooms
2
Rooms
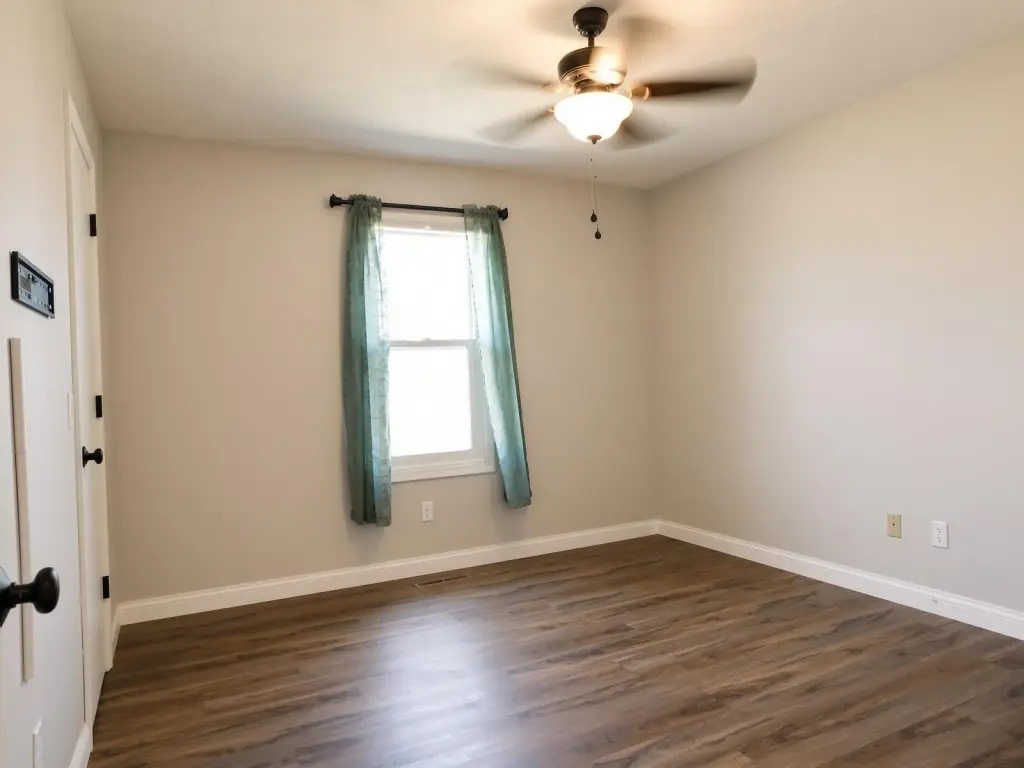
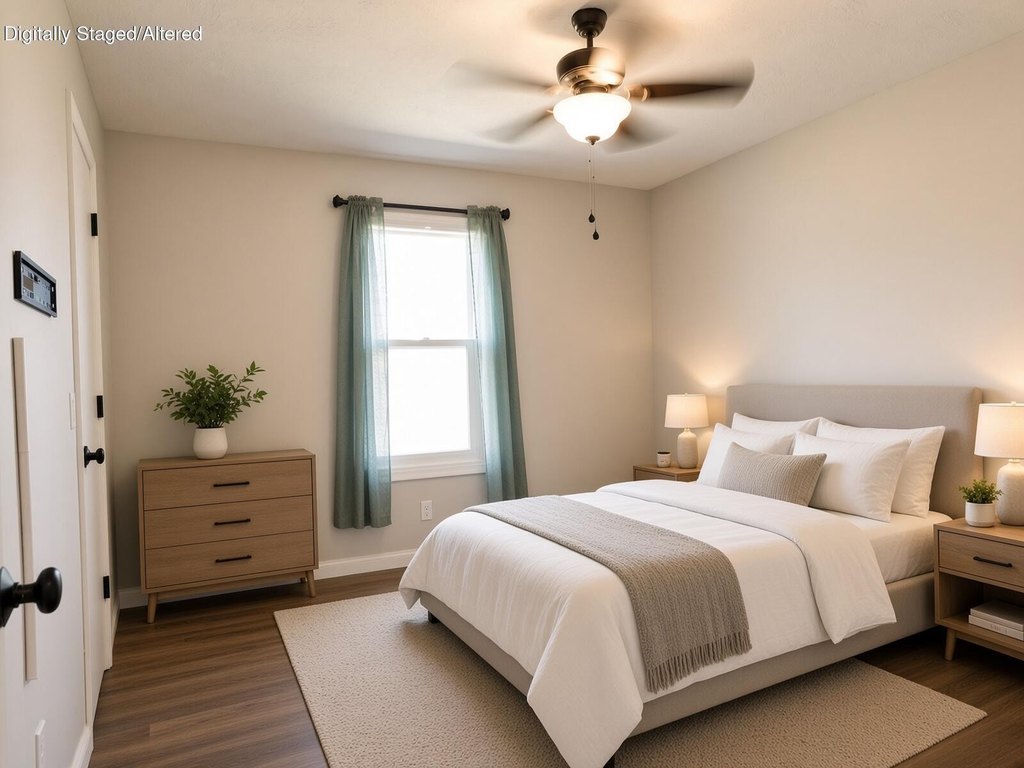
Bathroom 2, Bonus Room, Bathroom 1, Bedroom 1, Dining Room, Bedroom 2
Parking features
Driveway, Garage, Open
Window features
Drapes, Double Pane Windows, Blinds
Interior features
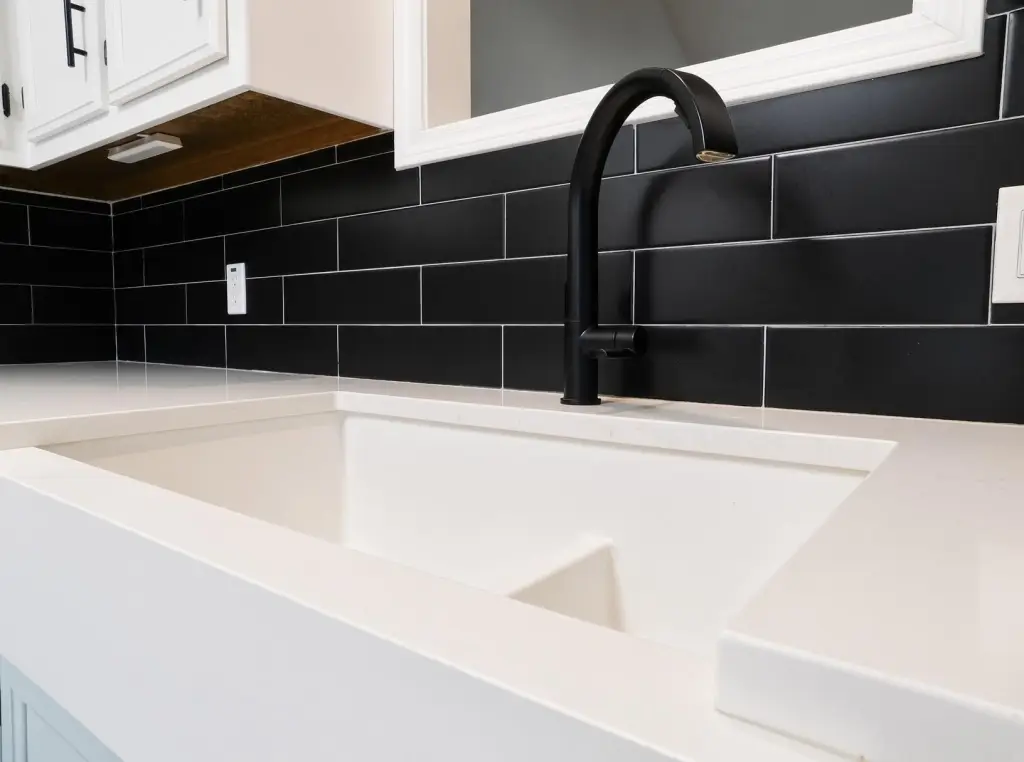
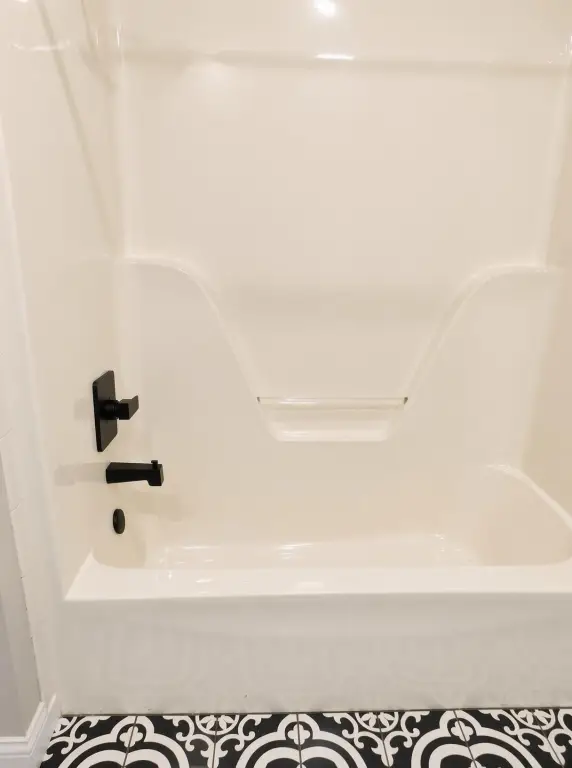
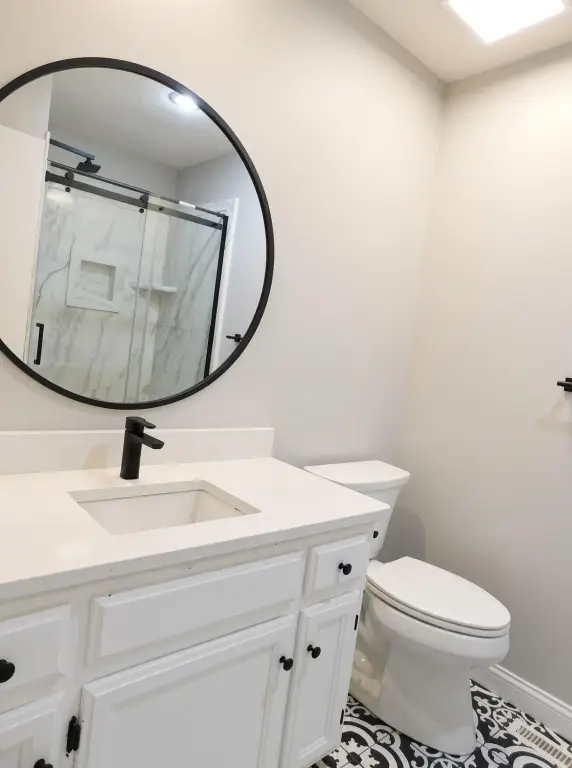
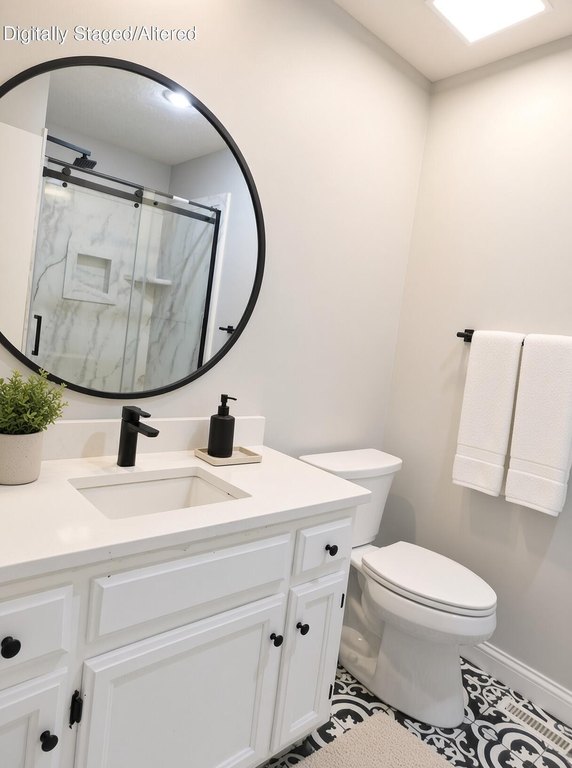
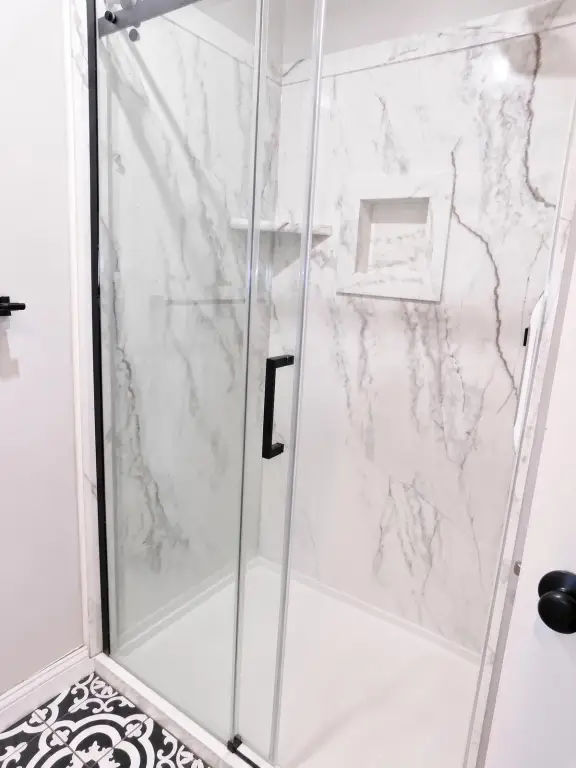
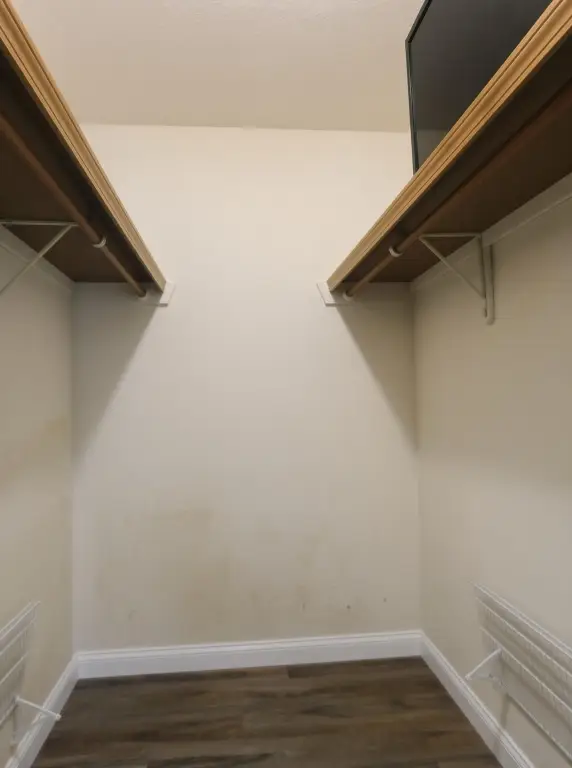
Walk-in Shower, Vaulted Ceiling(s), Quartz Counters, Walk-In Closet(s)
Accessibility
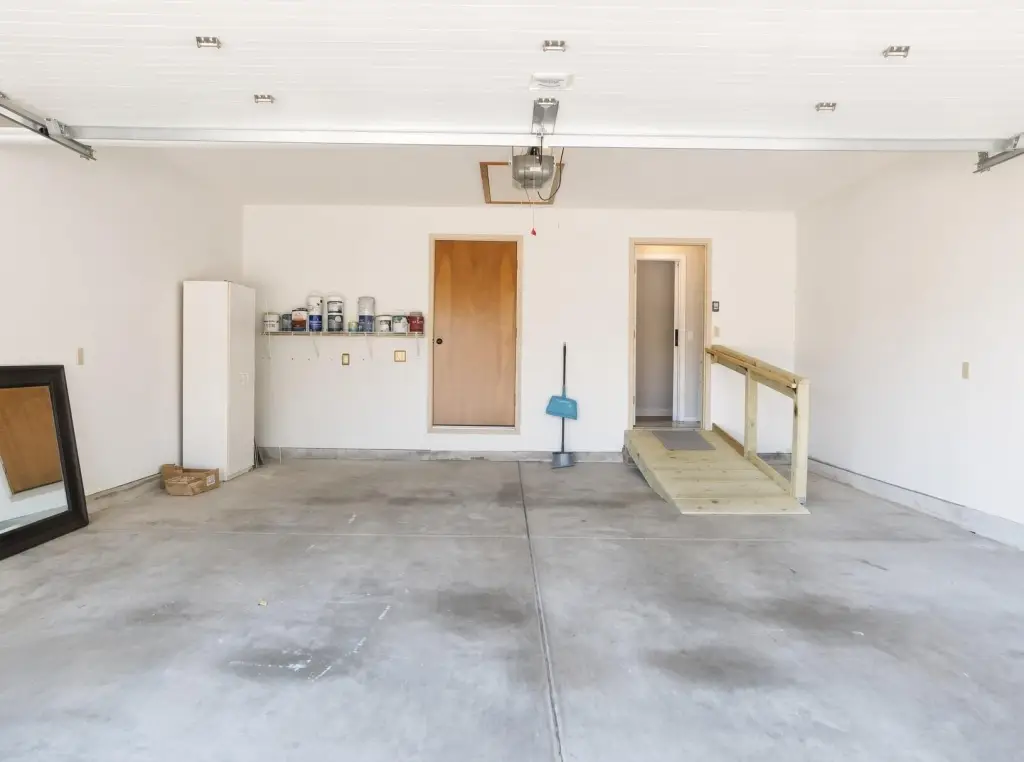
Accessible Approach with Ramp
Appliances
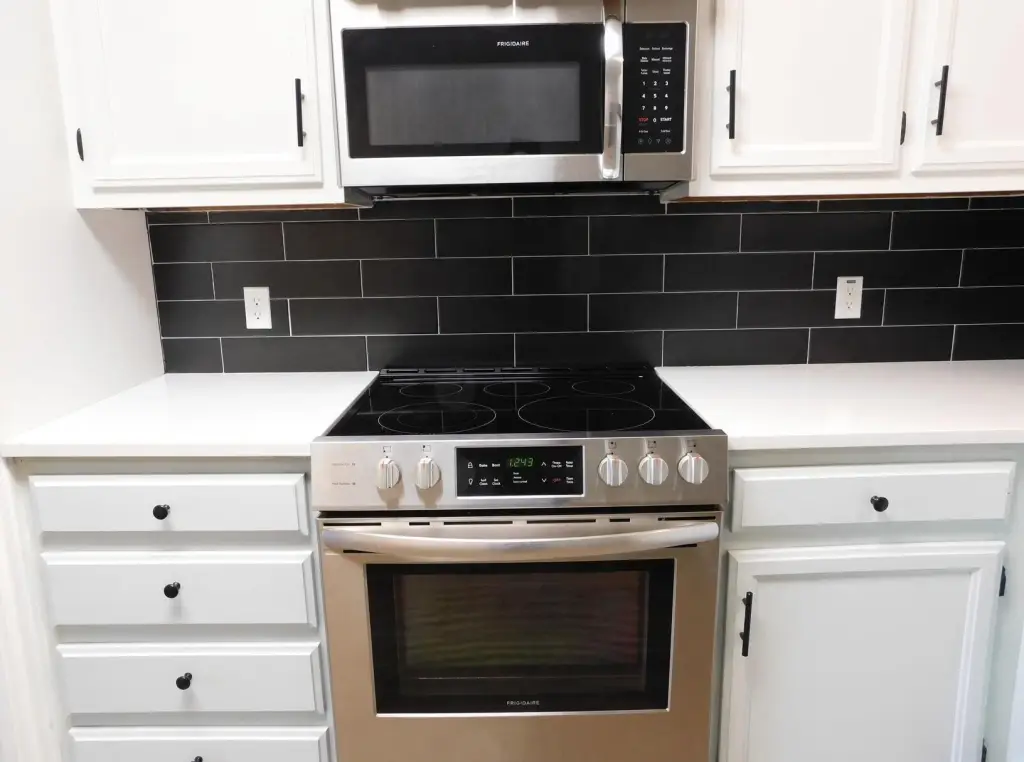
Electric Cooktop, Gas Water Heater, Dryer, Washer, Microwave, Refrigerator, Disposal, Dishwasher
Subdivision
Wren Hollow
Lot features
Paved Frontage
Elementary school
SGF-Horace Mann
Middle school
SGF-Carver
High school
SGF-Kickapoo
Directions
Turn South onto South Sagamont from West Battlefield Rd, follow until past the apartments, turn left, follow until just past the road bends turns/bends right. House is on left side right after the grassy common area.
Standard status
Active
APN
1802401125
Size
1,119 SF
Lot size
0.07 Acres
Taxes and HOA fees
Tax Year
2025
Tax Description
Wren Hollow Phase II Amnd Lot 21
Tax Annual Amount
1043
HOA Fee
$180 Annually
Legal Description
Wren Hollow Phase II Amnd Lot 21
Utilities
Sewer type
Public Sewer
Heating system
Forced Air
Cooling system
Ceiling Fan(s), Central Air
Amenities
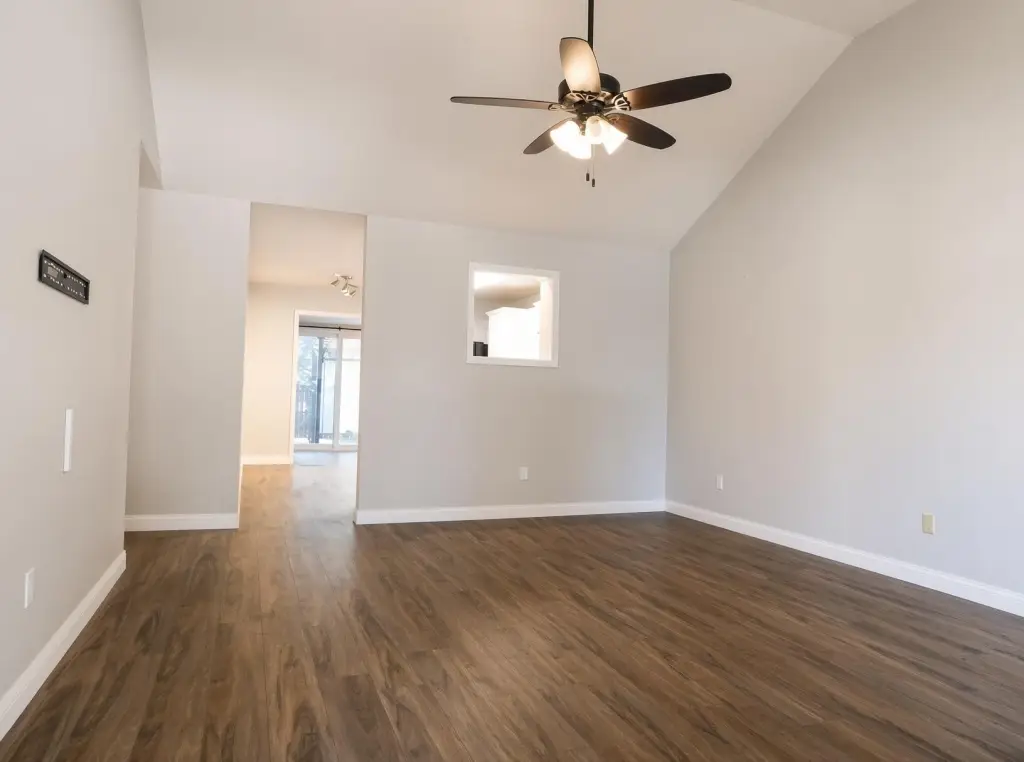
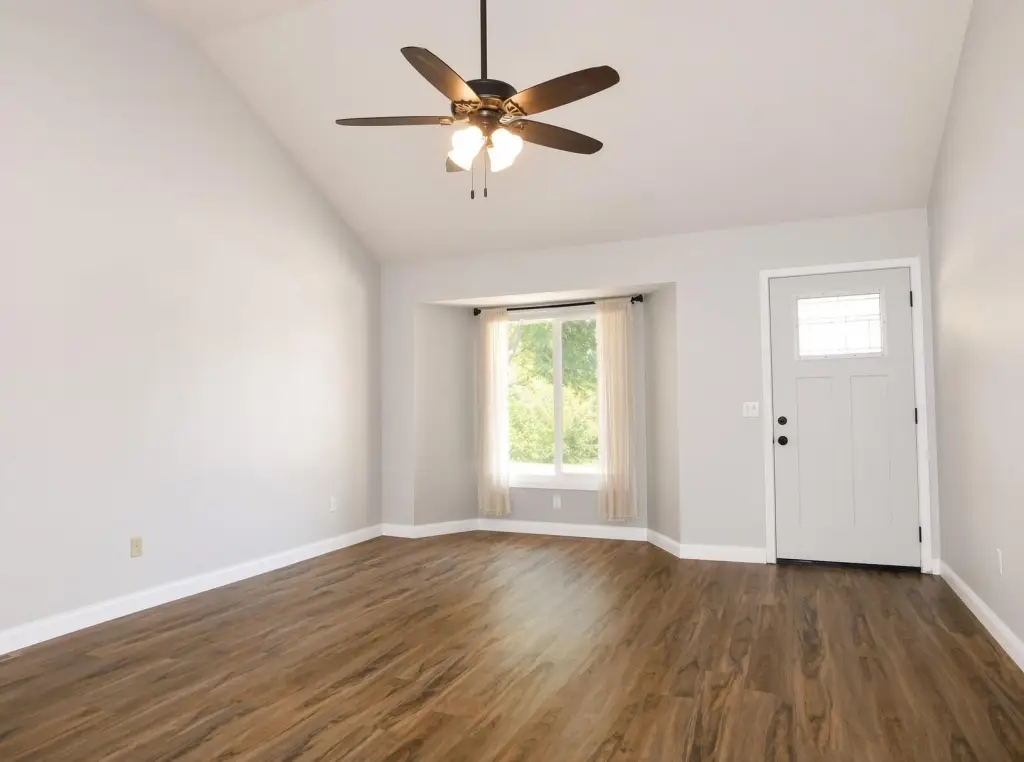
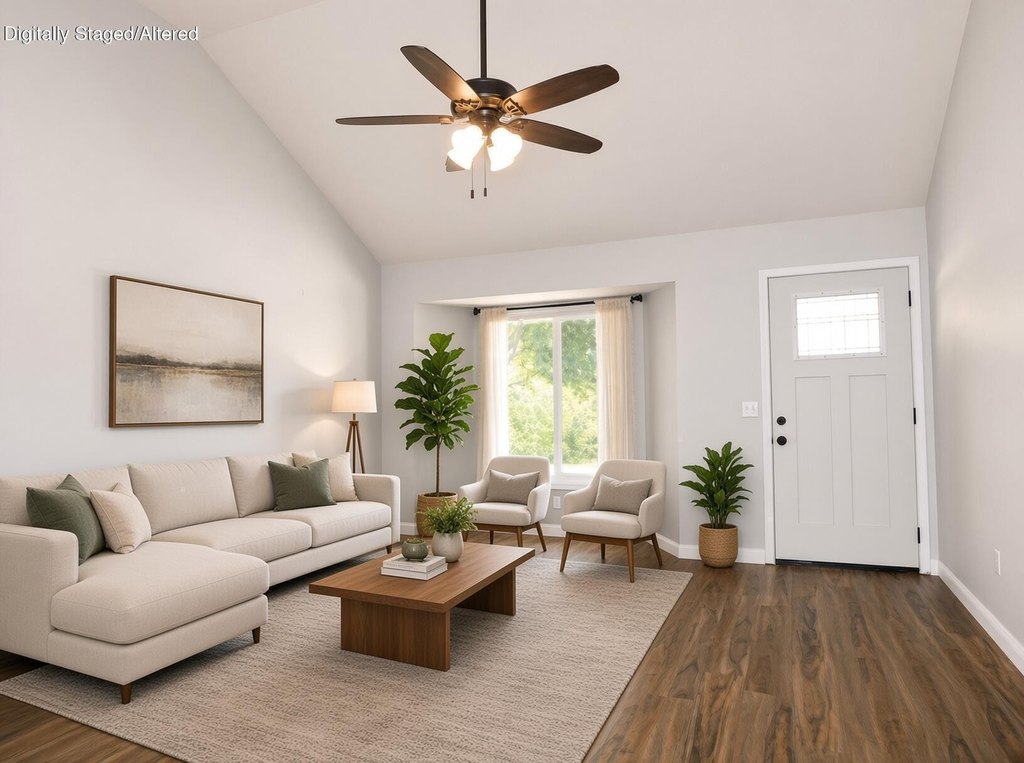
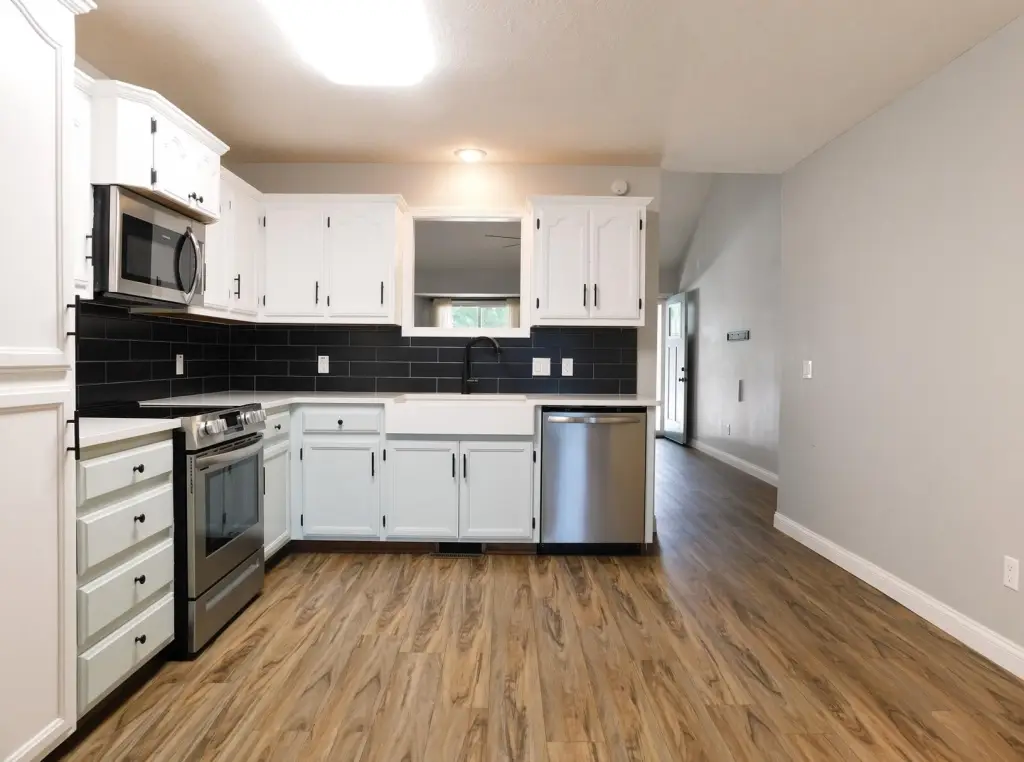
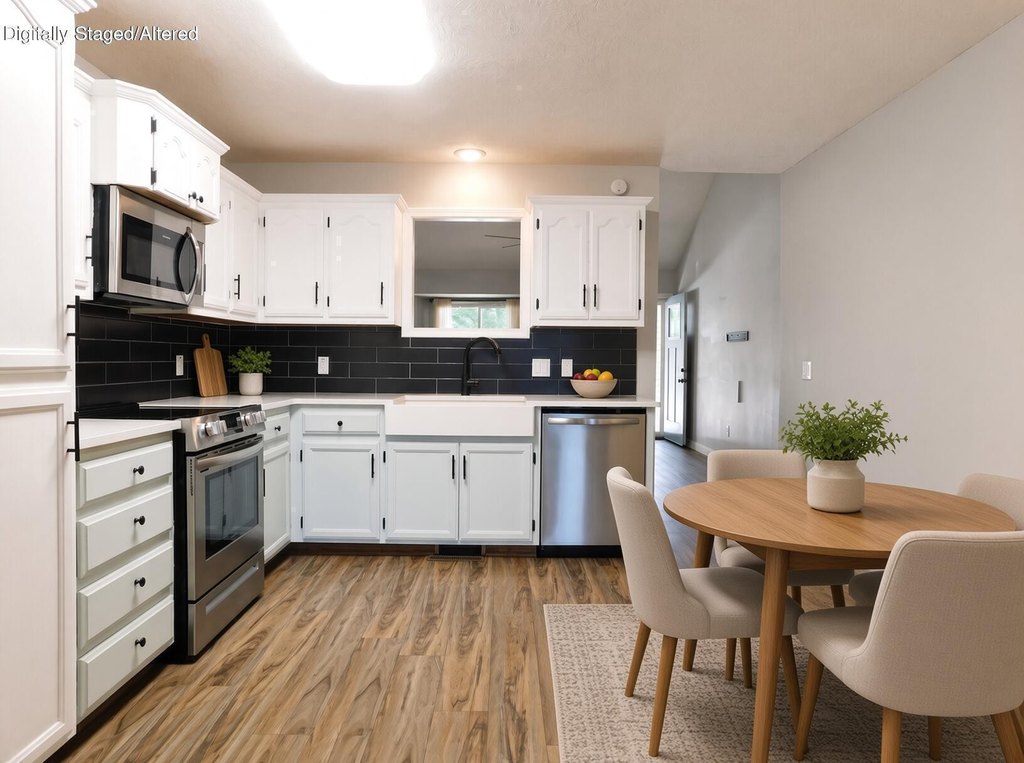
vaulted living room
updated fixtures
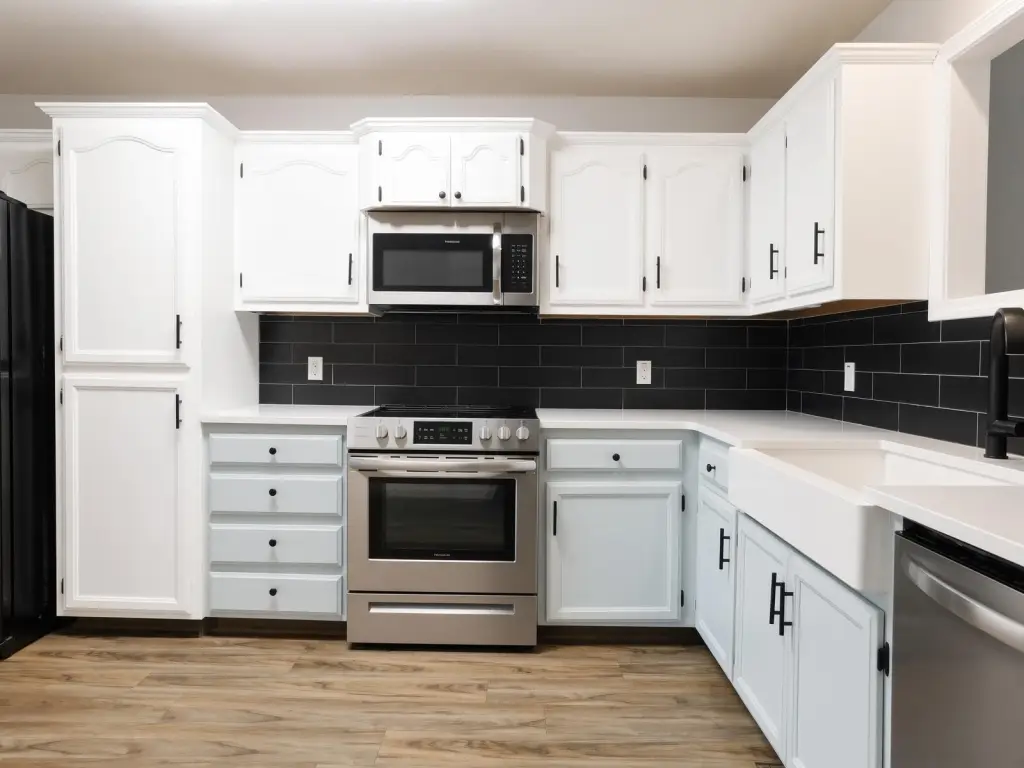
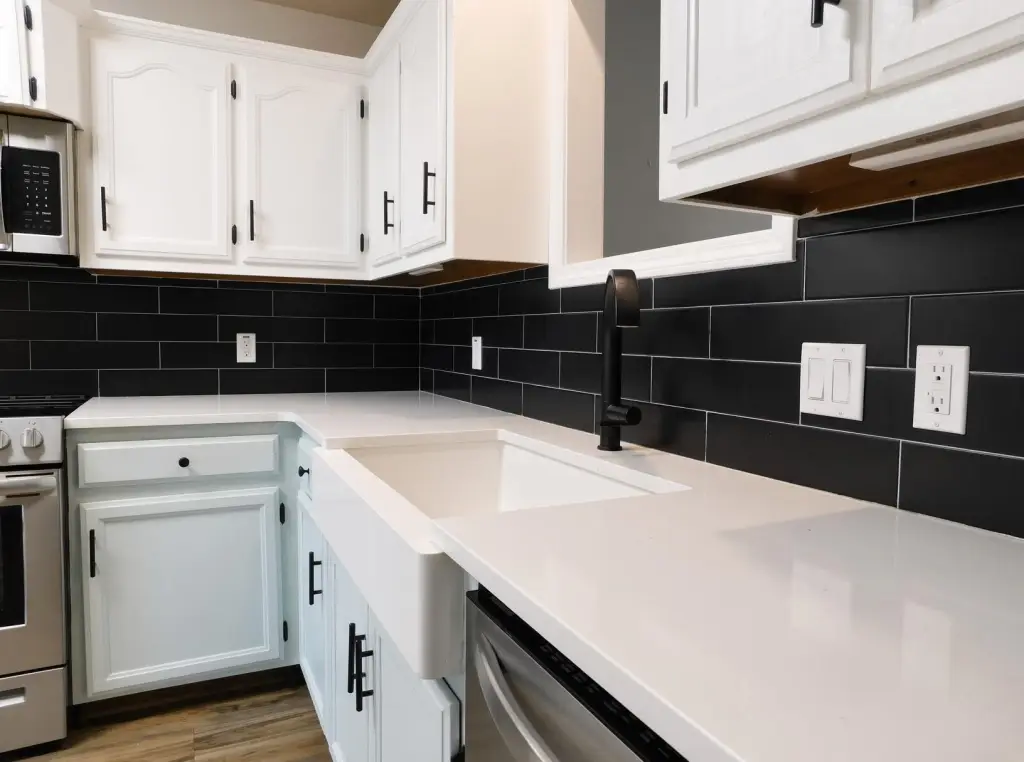
quartz countertops
black subway tile backsplash
farmhouse sink
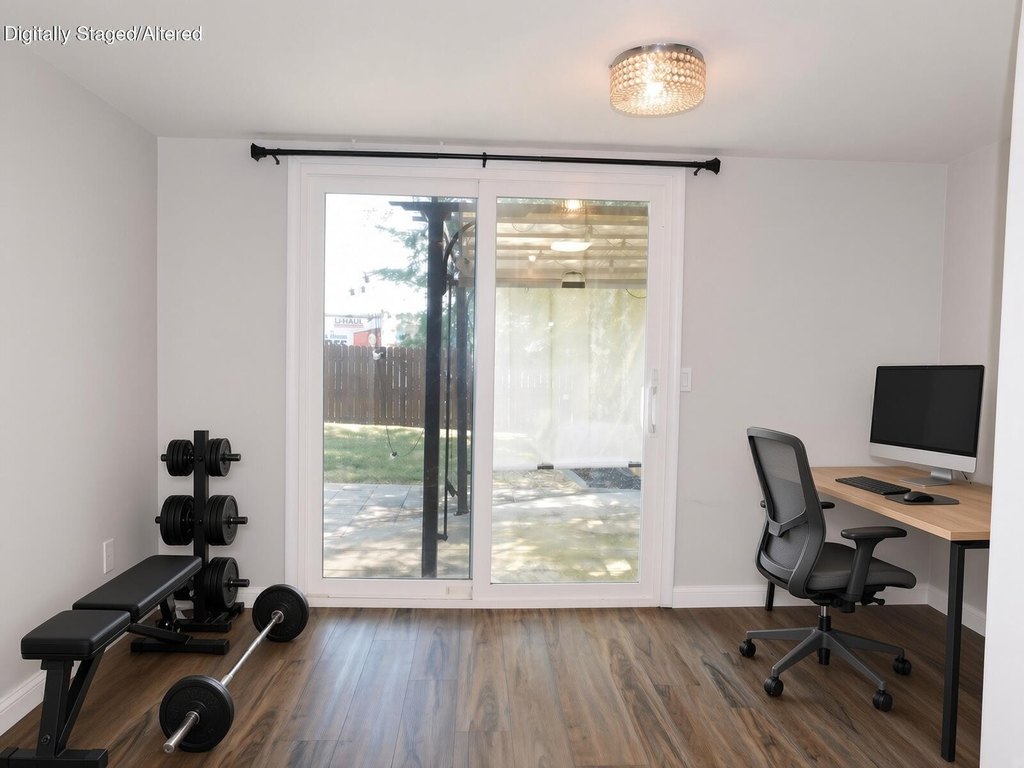
flex room
walk-in closet
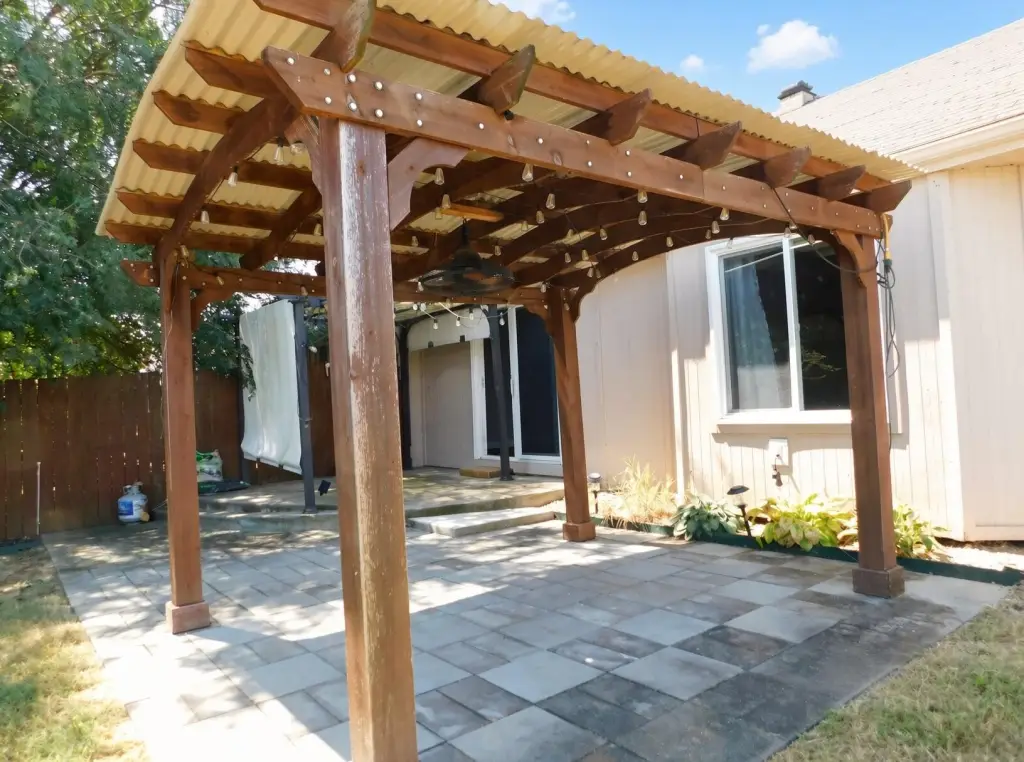
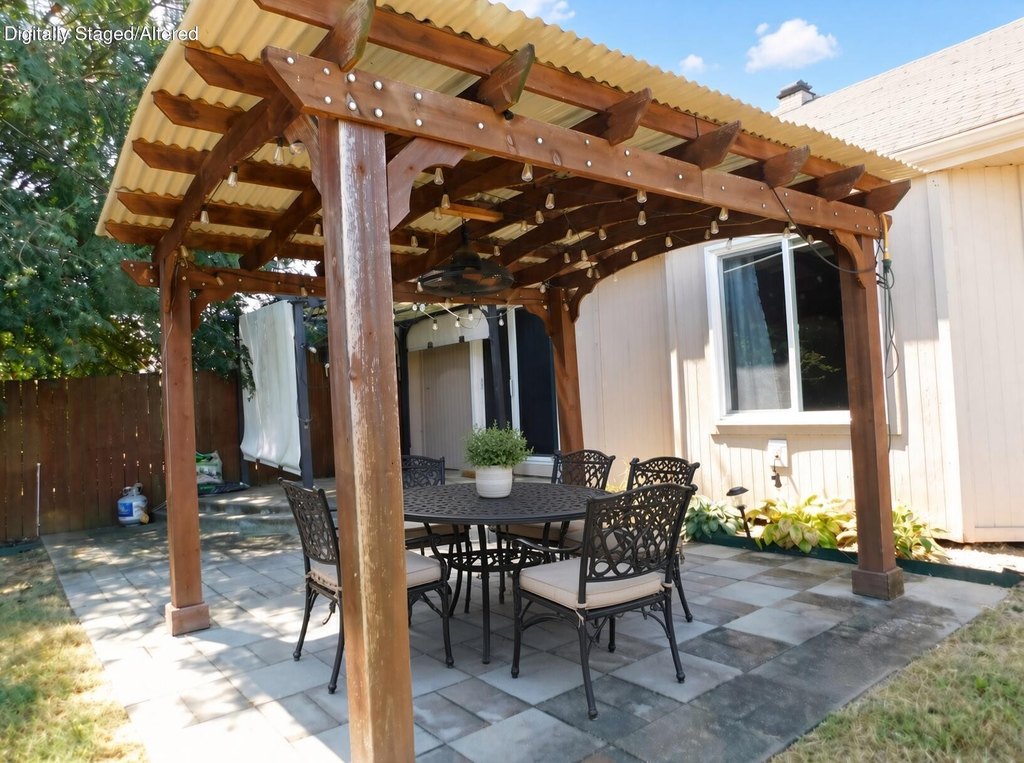
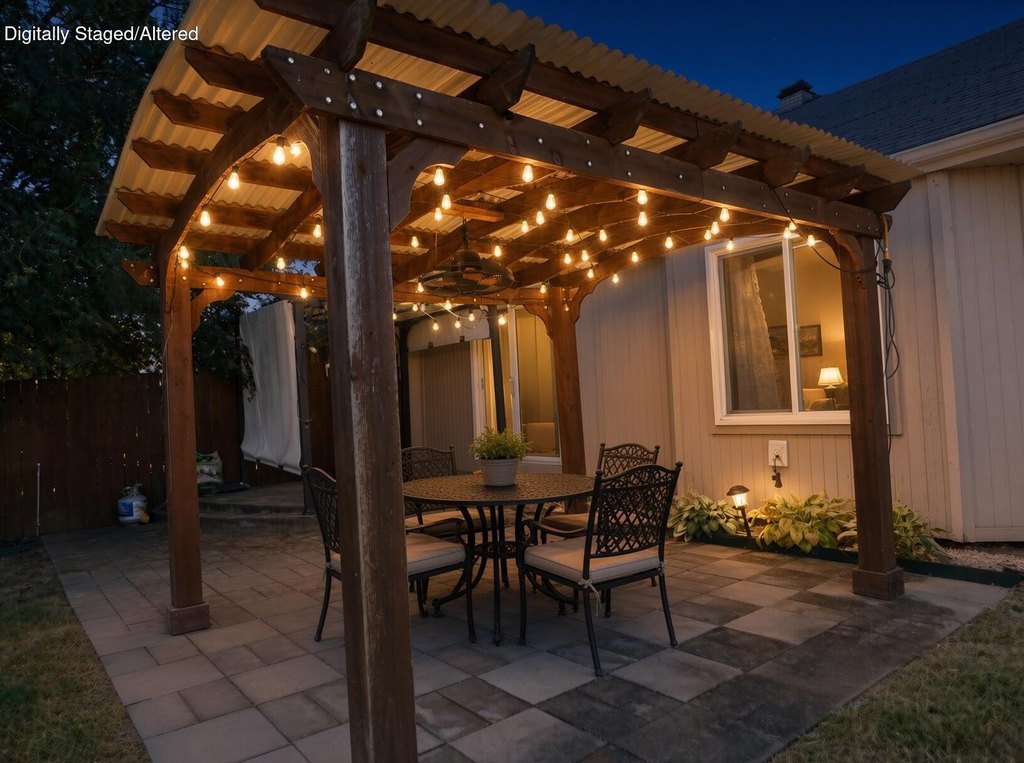
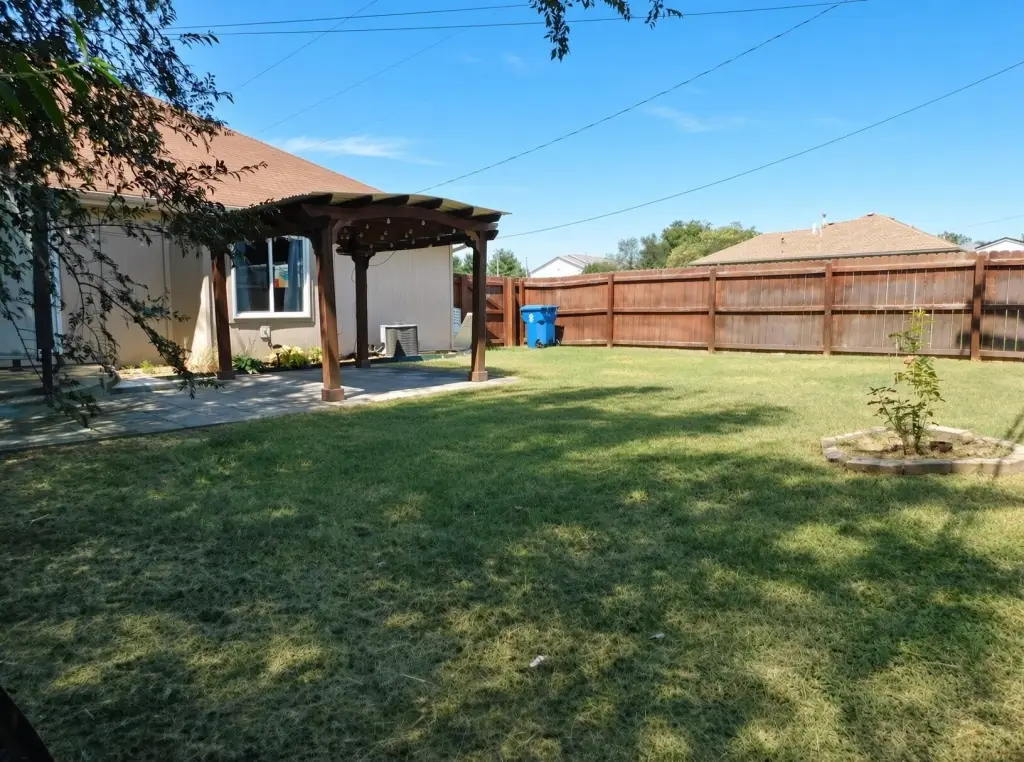
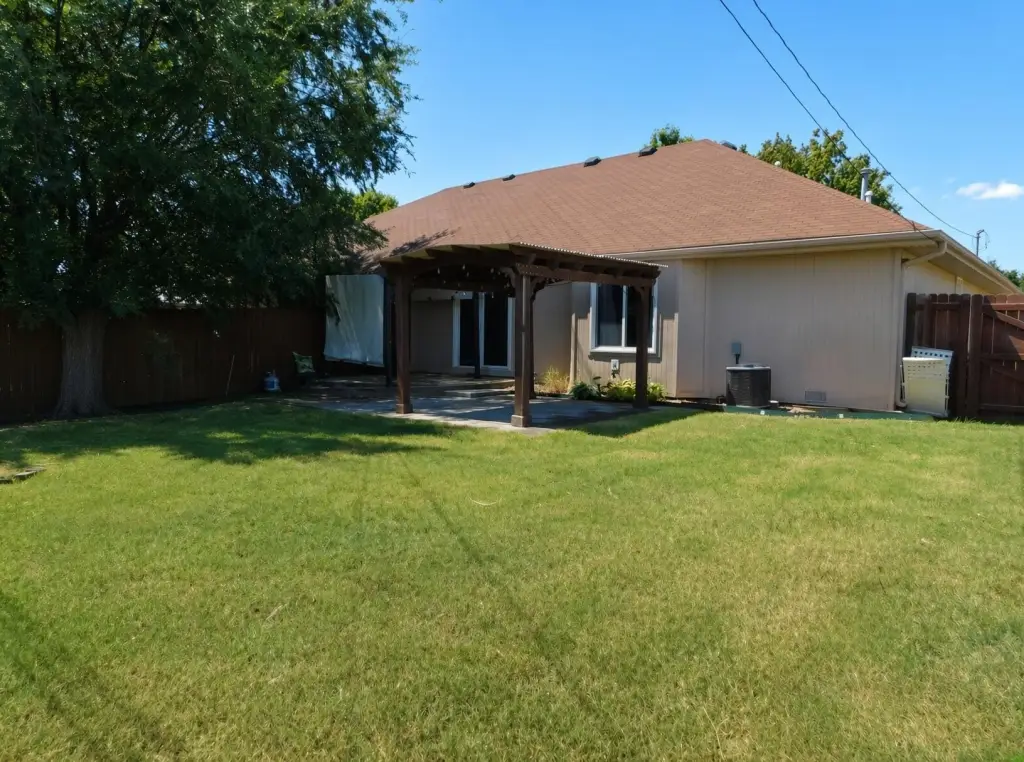
pergola
programmable thermostat
washer and dryer
privacy-fenced yard
Building Details
Year built
1991
Floors in Building
1
Flooring type
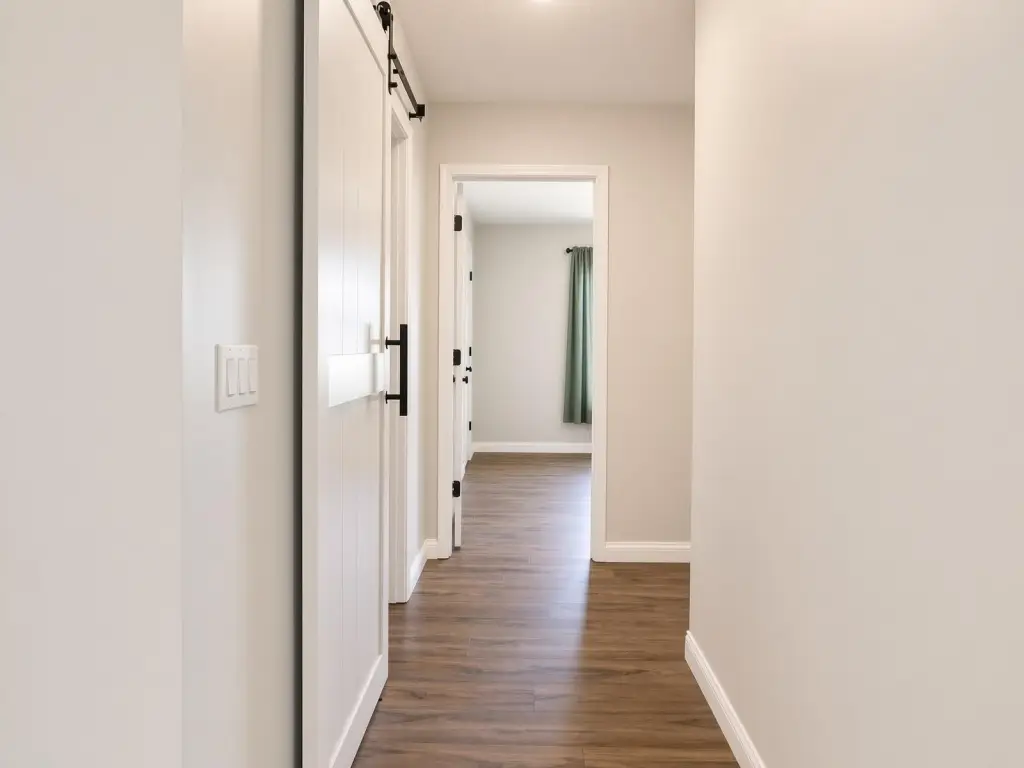
Tile, Vinyl
Building materials
Hardboard Siding
Roof type
Composition
Architectural style
Other
Listing Agency:
Keller Williams Tri-Lakes · Keller Williams Realty
(417) 336-4999
Listed By:
Shannon Hines
(661) 623-7688
Added: Aug 28
Changed: Oct 14
Last Checked: Oct 15 at 8:06AM
MLS# 60332572
Copyright © 2026 Southern Missouri Regional MLS, LLC (SOMO). All rights reserved. All information provided by the listing agent/broker is deemed reliable but is not guaranteed and should be independently verified.
Investment Insights
Based on property information with market context.
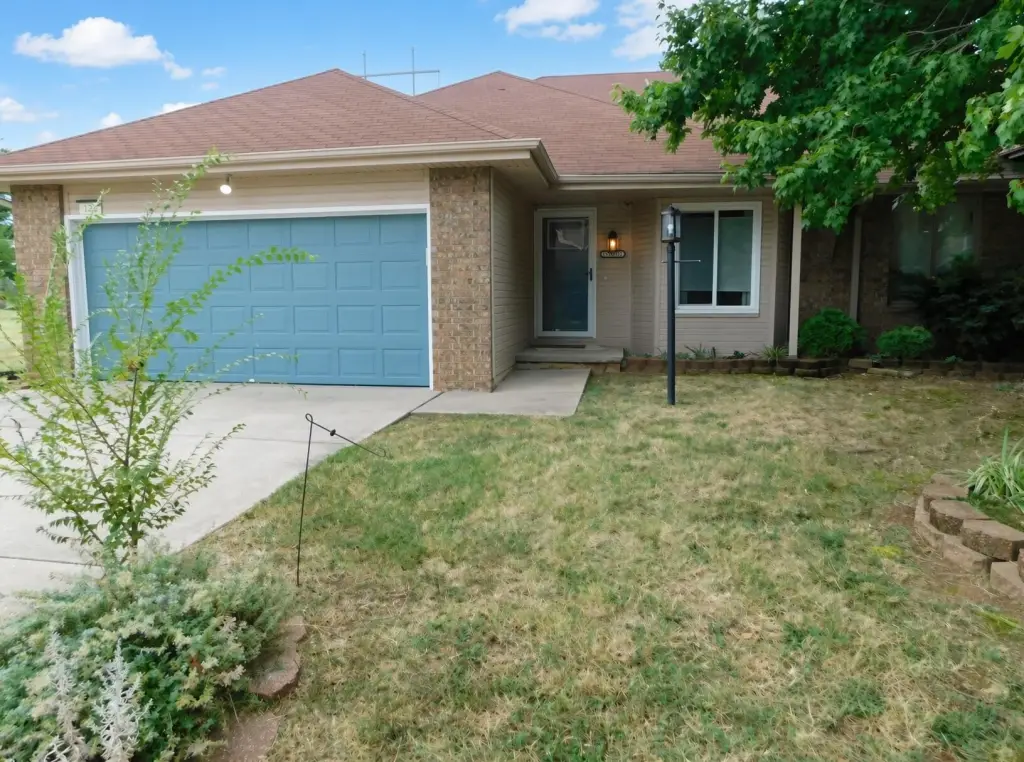
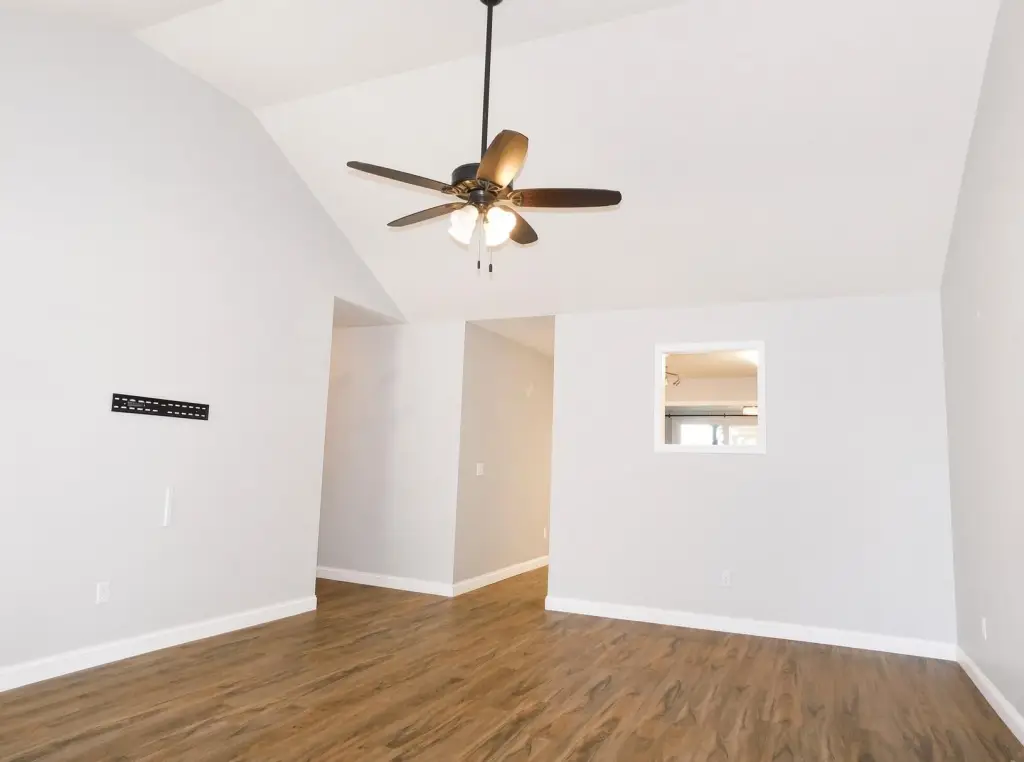
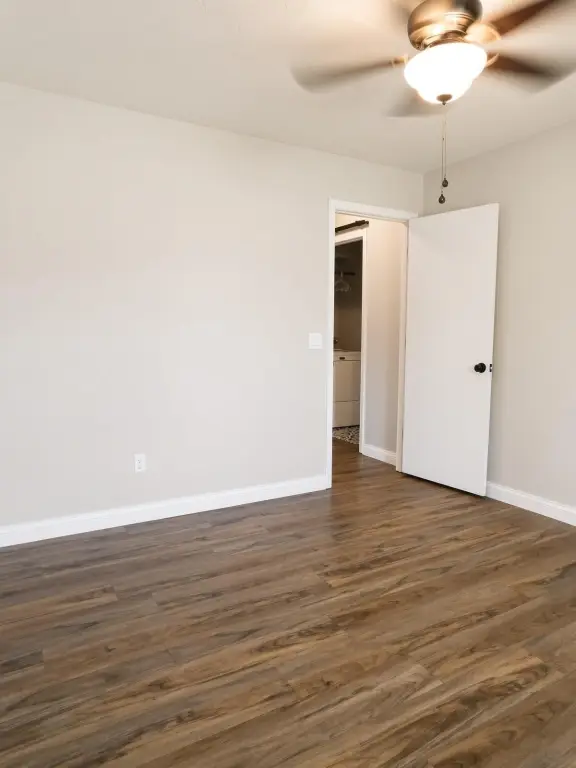
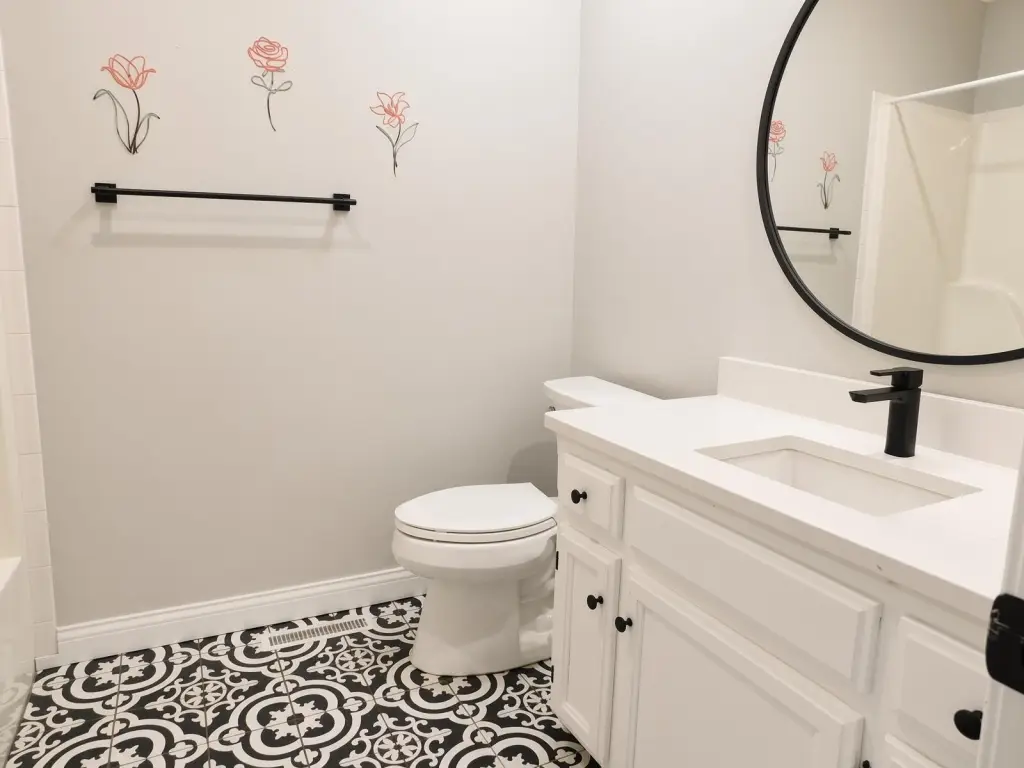
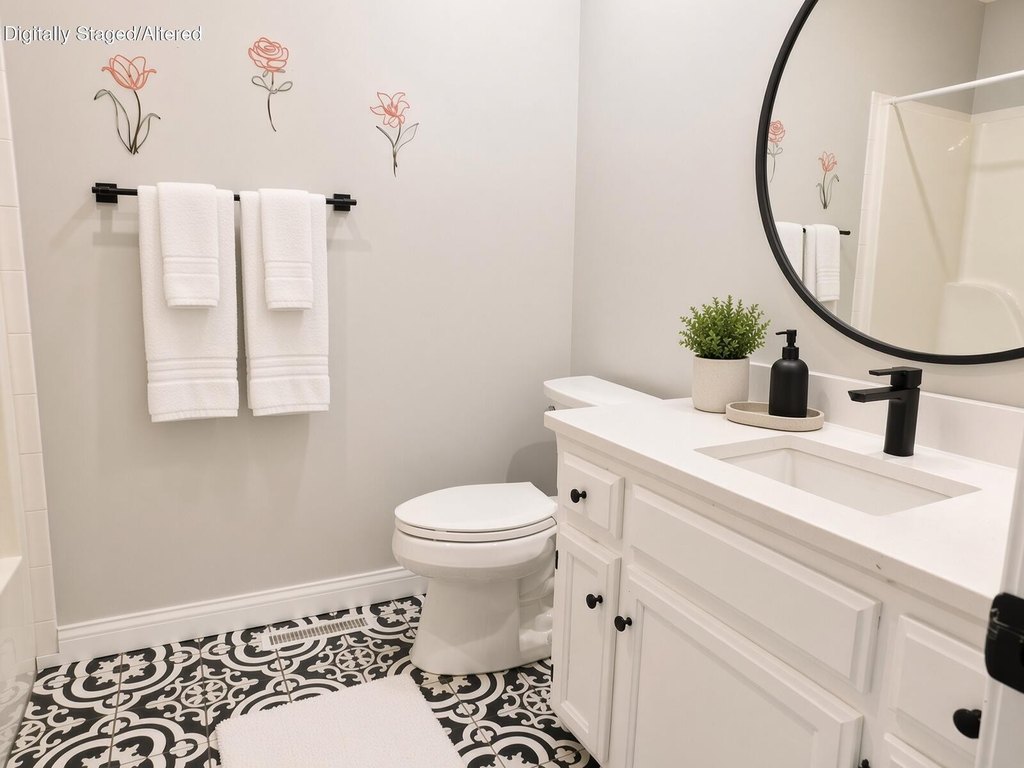
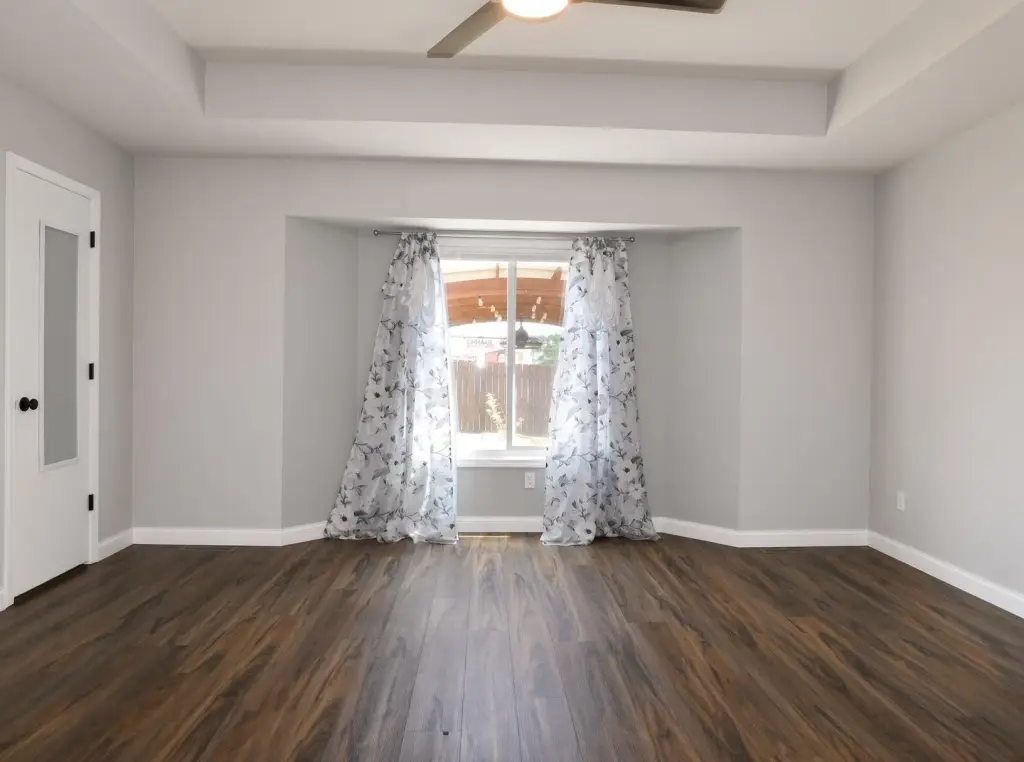
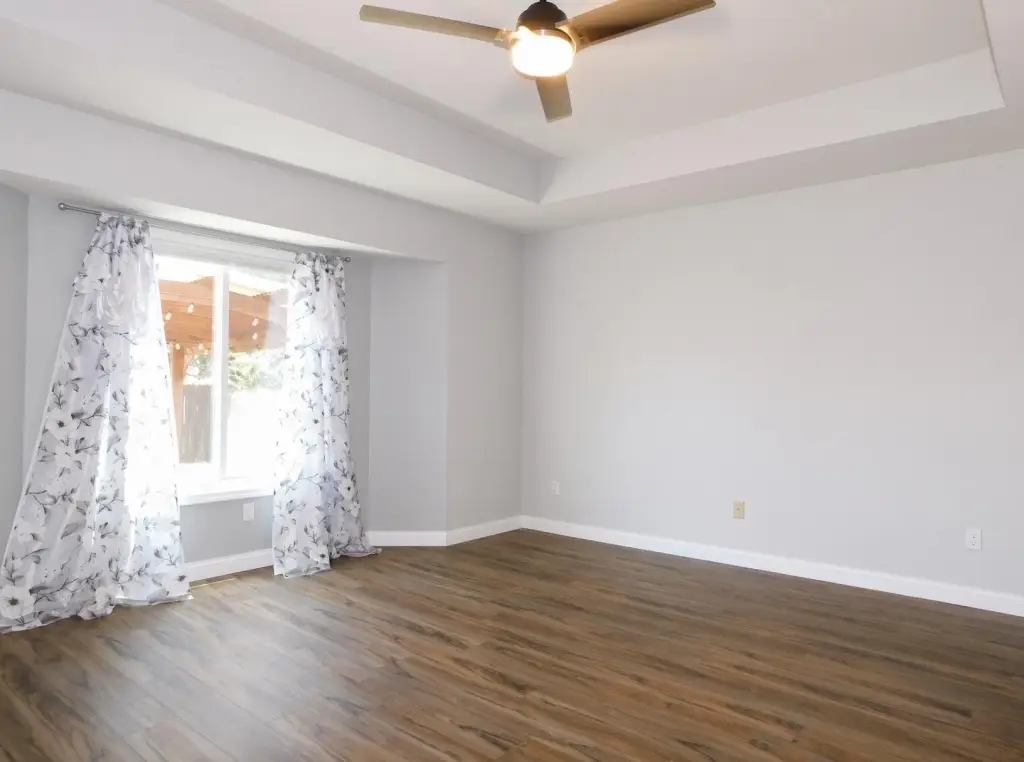
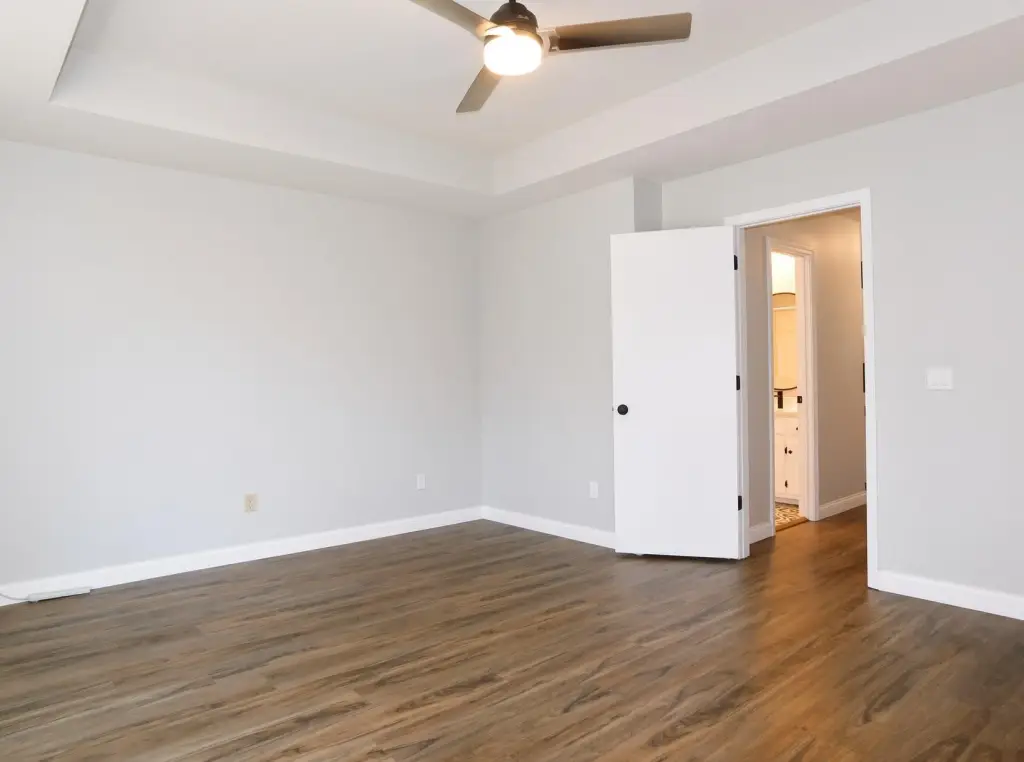
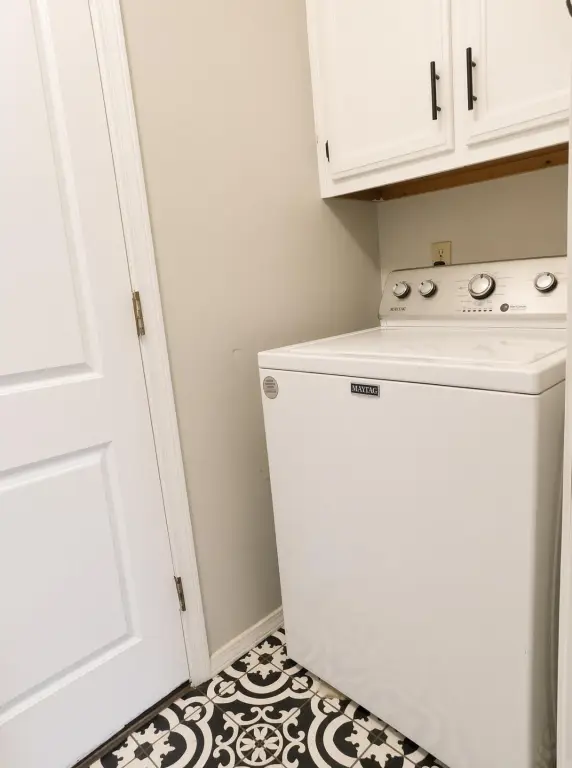
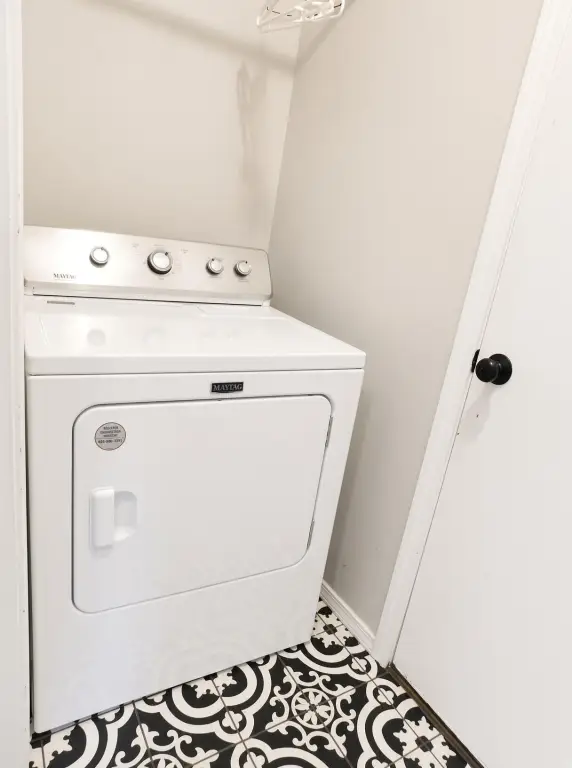
This 1,119-square-foot half duplex includes two bedrooms, two bathrooms, a vaulted living room, dining area, bonus room, and laundry room. Interior updates include LVP and tile flooring, updated fixtures, quartz kitchen counters, painted cabinetry, a black subway-tile backsplash, farmhouse sink, and included appliances. The primary suite features a walk-in closet, linen closet, and updated ensuite with a walk-in shower. A programmable thermostat and additional improvements completed within the last four years add to the updated interior.
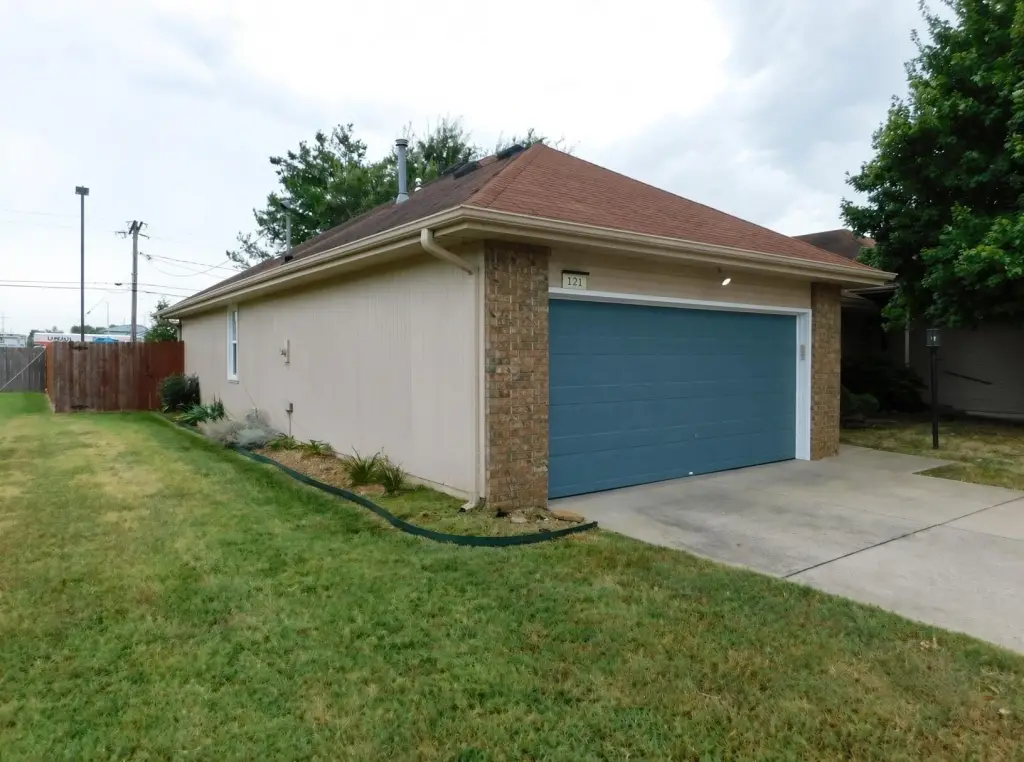
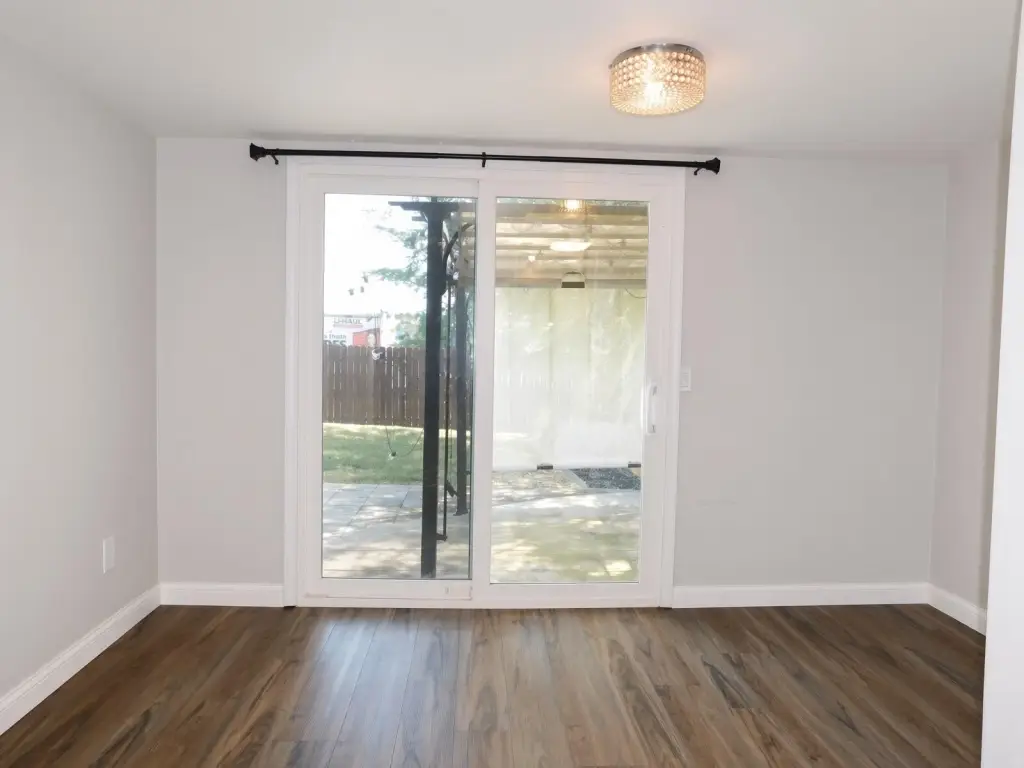
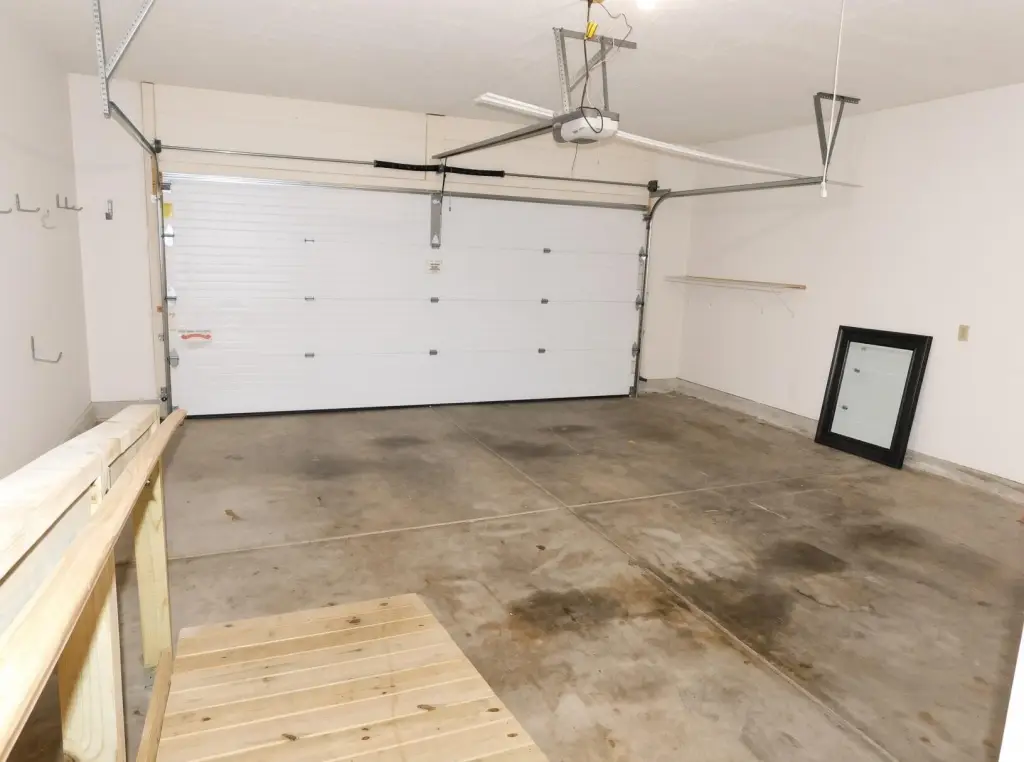
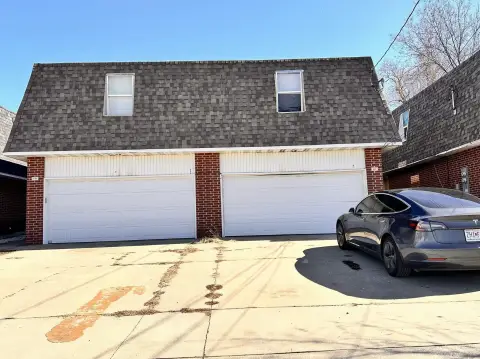
A new Pella slider opens to a privacy-fenced yard with stone pavers and two pergolas equipped with lighting and a fan. The attached two-car garage includes a ramp providing walk-in access to the home, while the laundry room connects directly to the garage. The property occupies 0.07 acres and is served by public sewer, central air, and forced-air heating.
A new Pella slider opens to a privacy-fenced yard with stone pavers and two pergolas equipped with lighting and a fan. The attached two-car garage includes a ramp providing walk-in access to the home, while the laundry room connects directly to the garage. The property occupies 0.07 acres and is served by public sewer, central air, and forced-air heating.
Key Highlights
- 1,119‑square‑foot half duplex with two bedrooms and two bathrooms
- Vaulted living room, bonus room, and refreshed LVP and tile flooring
- Kitchen with quartz counters, painted cabinets, farmhouse sink, and black subway‑tile backsplash
Financial Insights
Estimated NOI and Cap Rate
NOI / Yr
$10,143
Cap Rate
4.51%
Suggested Prices Based on Cap Rates
Cap Rate 5%
$202,860
$202.9K
Cap Rate 7%
$144,900
$144.9K
Cap Rate 9%
$112,700
$112.7K
Market Conditions
NOI Build-Up for 1,119 SF
Gross rent
$15.4K $13.80/SF
− Vacancy
−$953 −$0.85/SF
EGI
$14.5K $12.95/SF
− OpEx
−$4.3K −$3.88/SF
NOI
$10.1K $9.06/SF
Area
Springfield, MO
Vacancy
6.17%
Lease Rate
$13.80 /SF/Yr
Expense Ratio
30.00%
Simulate Cap Rate and NOI
Suggested Prices Based on Cap Rates
Cap Rate 5%
$202,860
Cap Rate 7%
$144,900
Cap Rate 9%
$112,700
Alternative Uses
Best Use
Multifamily LT 5
$144.9K
$126.8K – $169.1K
NOI $10,143 @ 7.0% cap · market cap 4.51%
Second Best
Apartment 5plus
$129.2K
$113.1K – $150.8K
NOI $9,046 @ 7.0% cap · market cap 4.02%
Theoretical Best
Office A
$168.9K
$147.8K – $197.1K
NOI $11,823 @ 7.0% cap · market cap 5.25%
Zoning and permitted uses should be independently verified with authorities.
How Realmo checks its estimates
Property Analytics
Unlock full access to Insights
Subscribe to Realmo Intelligence
Open Analytics
Current Use
Lease Details
1
Residential units
Location Intelligence
Trade Area within ½ mile
846
Businesses Nearby
Explore this area
Business Placement
Demographics for 65807, MO
55,168
Population
28,546
Households
1.9
Avg Household Size
36
Median Age
33%
College-Educated
94%
High-School Grad
21.0 sq mi
ZIP Area
2,627
Density / Sq Mi
$50,271
Median Household Income
$33,510
Median Earnings
$994
Median Rent
$174,000
Median Home Value
Check the figures for this property
Cap Rate, Value Estimation, Potential NOI and more
View Realmo Analytics
Market
Vacancy Rate% for Multifamily in Midwest region

Questions? Ask Rey
Realmo’s AI knows this listing — price, zoning, demand, history. Ask anything.

Frequently Asked Questions
What type of property is this?
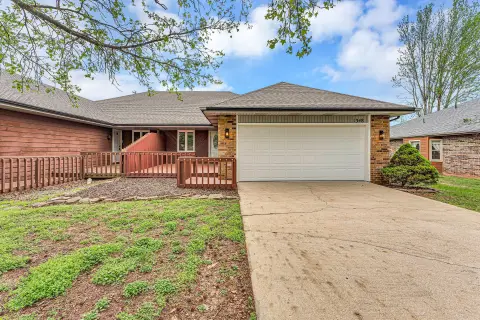
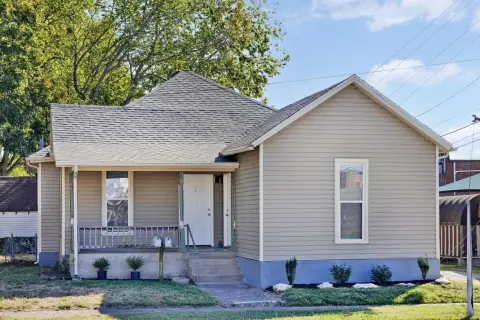
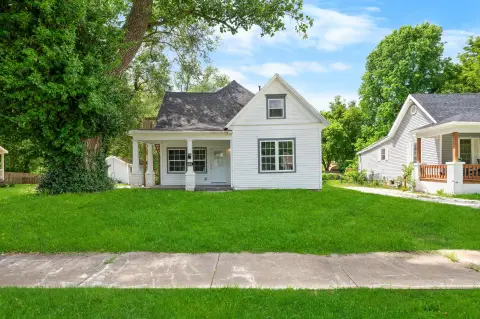
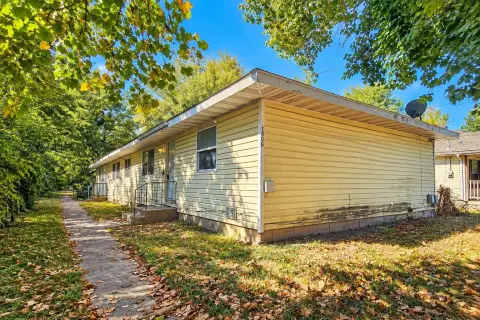
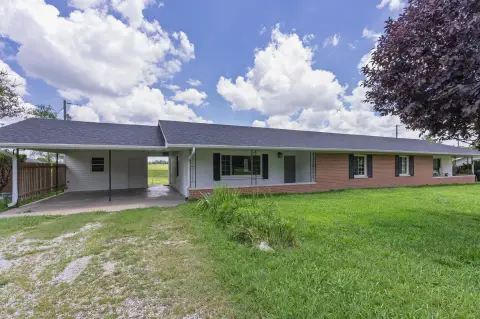
Duplex - Two-bedroom residence with refreshed interiors, private fenced outdoor space, and an attached two-car garage with ramp access.
Where is this duplex located?
The property is located at 3150 S Sagamont Avenue Springfield, MO.
What is the asking price?
The asking price for this property is $225,000.
What are key features of this property?
This property features: 1,119‑square‑foot half duplex with two bedrooms and two bathrooms; Vaulted living room, bonus room, and refreshed LVP and tile flooring; Kitchen with quartz counters, painted cabinets, farmhouse sink, and black subway‑tile backsplash


