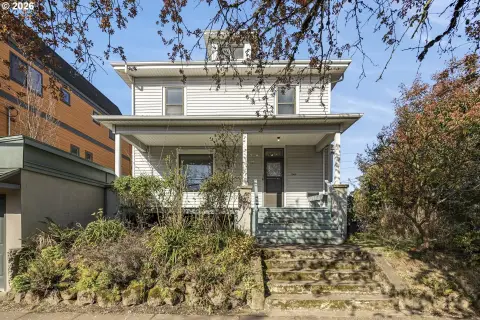
Updated-Roof Triplex with Separate
For Sale
$795,000
3123 SE 31st AVE, Portland, OR 97202
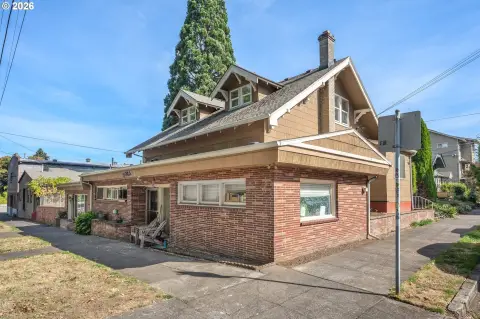
Well-maintained triplex featuring separate electrical meters and an attached garage presently rented with Unit C.
Property Size3,046 SF
Price / SF$260
Days on Market411

Ask AI about this property
Review the available facts, identify missing information and prepare questions for the agent.
Property Features for 3123 SE 31st AVE
General Information
Standard status
Active
Size
3,046 SF
Total Parking Spaces
1
Property subtype
Multi-Family
Zoning
R5
Net Operating Income
$50,071
Taxes and HOA fees
Annual Taxes
$9,256
Amenities
Basement
PartiallyFinished,SeparateLivingQuartersApartmentAuxLivingUnit
Other
UnitTypeType1,UnitTypeType2,UnitTypeType3
Electricity,Gas
2
Dishwasher,Range,Refrigerator,WasherDryer
Dishwasher,Range,Refrigerator,WoodFloors
Dishwasher,Microwave,Range,Refrigerator
1
1930
2020
1700
Level
PublicWater
1.0
43x90
0.09
Driveway,Garage
Paved
ConcretePerimeter
3046.0
LapSiding
Building Details
Building Size
3,046 SF
Year Built
1912
Stories
3
Tenancy
Multi
Listing Agency:
LUXE Forbes Global Properties
(971) 271-8932
Listed By:
Carmen Hart
(971) 266-0206
Source:
Premierepropertygroup
Added: Aug 31, 2025
Changed: Oct 15
Last Checked: Oct 14 at 8:12PM
Displayed information is deemed reliable but is not guaranteed and should be independently verified. All listing content including descriptions, pricing, images are the copyrighted material of LUXE Forbes Global Properties
Investment Insights
Based on property information with market context.
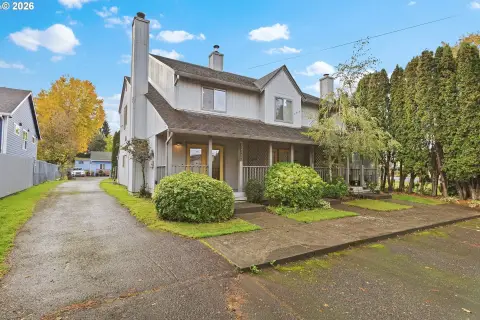
This well-maintained triplex offers a classic shared-entry setup, a grand front porch, and an inviting common yard. The roof has been updated, and each unit has separate electrical meters. While electrical is individually metered, the units share water, sewer, and garbage services. An attached garage is currently rented with Unit C, adding a practical companion to the unit layout. The property was owner-occupied until 2021 and has been carefully maintained, with ownership documented as changing hands only a few times since 1980.
Located at 3123 SE 31st Ave in Portland, the property is described as being in the Richmond area. Comprehensive financial records are available to support due diligence.
For buyers or operators seeking a residential income property with a straightforward utility arrangement, the separate electrical meters can simplify billing and reduce administrative complexity. At the same time, shared water, sewer, and garbage should be factored into budgeting, along with the provided annual expense figures for insurance, water, garbage, and lawn care. With the attached garage already leased with Unit C, the configuration supports an income approach that combines unit living space with an additional rented component.
Located at 3123 SE 31st Ave in Portland, the property is described as being in the Richmond area. Comprehensive financial records are available to support due diligence.
For buyers or operators seeking a residential income property with a straightforward utility arrangement, the separate electrical meters can simplify billing and reduce administrative complexity. At the same time, shared water, sewer, and garbage should be factored into budgeting, along with the provided annual expense figures for insurance, water, garbage, and lawn care. With the attached garage already leased with Unit C, the configuration supports an income approach that combines unit living space with an additional rented component.
Key Highlights
- Well‑maintained triplex with 3 units: Unit A (2/1) rent $1,930, Unit B (2/1) rent $2,020, Unit C (2/2) rent $1,700
- Separate electrical meters for the units; updated roof noted in property remarks
- Attached garage is presently rented with Unit C
Financial Insights
Estimated NOI and Cap Rate
NOI / Yr
$44,258
Cap Rate
5.57%
Suggested Prices Based on Cap Rates
Cap Rate 5%
$885,160
$885.2K
Cap Rate 7%
$632,257
$632.3K
Cap Rate 9%
$491,756
$491.8K
Market Conditions
NOI Build-Up for 3,046 SF
Gross rent
$67.6K $22.20/SF
− Vacancy
−$4.4K −$1.44/SF
EGI
$63.2K $20.76/SF
− OpEx
−$19.0K −$6.23/SF
NOI
$44.3K $14.53/SF
Area
ZIP 97202
Vacancy
6.50%
Lease Rate
$22.20 /SF/Yr
Expense Ratio
30.00%
Simulate Cap Rate and NOI
Suggested Prices Based on Cap Rates
Cap Rate 5%
$885,160
Cap Rate 7%
$632,257
Cap Rate 9%
$491,756
Alternative Uses
Best Use
Multifamily LT 5
$632.3K
$553.2K – $737.6K
NOI $44,258 @ 7.0% cap · market cap 5.57%
Second Best
Apartment 5plus
$587.1K
$513.7K – $684.9K
NOI $41,095 @ 7.0% cap · market cap 5.17%
Theoretical Best
Office A
$726.7K
$635.9K – $847.8K
NOI $50,868 @ 7.0% cap · market cap 6.40%
Zoning and permitted uses should be independently verified with authorities.
How Realmo checks its estimates
Property Analytics
Unlock full access to Insights
Subscribe to Realmo Intelligence
Open Analytics
Current Use
Lease Details
Multi-tenant
Tenancy
Location Intelligence
Trade Area within ½ mile
1,544
Businesses Nearby
Explore this area
Business Placement
Demographics for 97202, OR
43,193
Population
20,097
Households
2.1
Avg Household Size
38
Median Age
65%
College-Educated
96%
High-School Grad
6.3 sq mi
ZIP Area
6,856
Density / Sq Mi
$100,353
Median Household Income
$52,090
Median Earnings
$1,674
Median Rent
$684,800
Median Home Value
Check the figures for this property
Cap Rate, Value Estimation, Potential NOI and more
View Realmo Analytics
Market
Vacancy Rate% for Multifamily in West region



Frequently Asked Questions
What type of property is this?
Triplex - Well-maintained triplex featuring separate electrical meters and an attached garage presently rented with Unit C.
Where is this triplex located?
The property is located at 3123 SE 31st AVE Portland, OR.
What is the asking price?
The asking price for this property is $795,000.
What are key features of this property?
This property features: Well‑maintained triplex with 3 units: Unit A (2/1) rent $1,930, Unit B (2/1) rent $2,020, Unit C (2/2) rent $1,700; Separate electrical meters for the units; updated roof noted in property remarks; Attached garage is presently rented with Unit C