Mixed-Use Investment
For Sale
$1,300,000
3116 Brainerd Road, Chattanooga, TN 37411
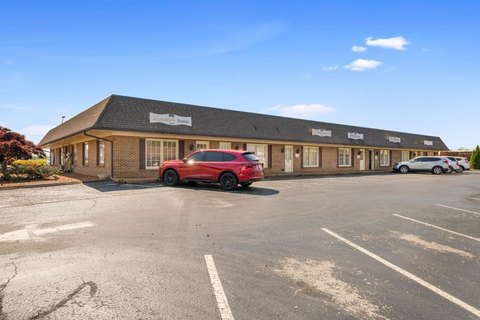
Multi-use property with office, retail, and restaurant spaces.
Property Size9,620 SF
Lot Size0.48 Acres
Price / SF$135.14
Days on Market215
Property Features for 3116 Brainerd Road
General Information
Standard status
Active
Size
9,620 SF
Lot size
0.48 Acres
Property subtype
Retail
Building Details
Building Size
9,620 SF
Year Built
1930
Listed By:
Cage Gary, CCIM · License #TN #370241
(770) 335-2672
Source:
Svn
Added: Mar 6
Changed: Oct 6
Last Checked: Oct 7 at 9:31AM
Displayed information is deemed reliable but is not guaranteed and should be independently verified. All listing content including descriptions, pricing, images are the copyrighted material of Cage Gary, CCIM
Investment Insights
Based on property information with market context.
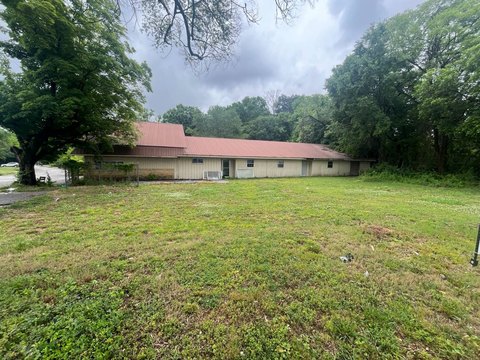
This property presents a multi-use investment opportunity, featuring three distinct revenue streams. The upper level is configured as office space, including multiple private offices, restrooms, and a kitchenette, suitable for long-term office tenants. A separate retail suite, accessible from the side of the building and equipped with its own restroom, provides an additional leasable unit for retail, service businesses, or a small independent operation. The main level houses a fully equipped restaurant and event space, complete with a commercial kitchen, stage area, and multiple restrooms, offering potential for a food-and-beverage tenant or owner-operator. The property allows for maximized income, diversified tenancy, and benefits from visibility along a high-traffic corridor. The building, constructed in 1930 and renovated in 1980, is approximately 9,620 square feet on two levels and is zoned C-2, allowing flexibility for various uses. The lower level, previously a restaurant and event venue, includes seating for up to 200 people, a stage area, a commercial kitchen, and five restrooms. The upper level is designed for office use, featuring eight private offices, a kitchenette, two restrooms, and its own HVAC system, with entrance options from the front and rear. A small side retail space has its own entrance and restroom. An additional 0.48-acre parcel behind the building is suitable for more parking or future development. With visibility along Brainerd Road and access to I-75, Highway 24, and downtown, the property is suited for office, retail, or mixed-use ventures seeking a strategic location.
Key Highlights
- Strong multi‑use investment opportunity with three distinct revenue streams (office, retail, restaurant/event space).
- Strategic, flexible location with high visibility along Brainerd Road and quick access to I‑75, Highway 24, and downtown Chattanooga.
- C‑2 zoning provides flexibility for a wide range of uses.
Financial Insights
Estimated NOI and Cap Rate
NOI / Yr
$110,390
Cap Rate
8.49%
Suggested Prices Based on Cap Rates
Cap Rate 5%
$2,207,800
$2.2M
Cap Rate 7%
$1,577,000
$1.6M
Cap Rate 9%
$1,226,556
$1.2M
Market Conditions
NOI Build-Up for 9,620 SF
Gross rent
$173.2K $18.00/SF
− Vacancy
−$26.0K −$2.70/SF
EGI
$147.2K $15.30/SF
− OpEx
−$36.8K −$3.82/SF
NOI
$110.4K $11.48/SF
Area
Chattanooga, TN
Vacancy
15.00%
Lease Rate
$18.00 /SF/Yr
Expense Ratio
25.00%
Simulate Cap Rate and NOI
Suggested Prices Based on Cap Rates
Cap Rate 5%
$2,207,800
Cap Rate 7%
$1,577,000
Cap Rate 9%
$1,226,556
Alternative Uses
Best Use
Office B
$1.58M
$1.38M – $1.84M
NOI $110,390 @ 7.0% cap · market cap 8.49%
Second Best
Mixed Use
$1.52M
$1.33M – $1.77M
NOI $106,205 @ 7.0% cap · market cap 8.17%
Theoretical Best
Office A
$2.12M
$1.86M – $2.48M
NOI $148,724 @ 7.0% cap · market cap 11.44%
Zoning and permitted uses should be independently verified with authorities.
Property Analytics
Unlock full access to Insights
Subscribe to Realmo Intelligence
Open Analytics
Current Use
Location Intelligence
Trade Area within ½ mile
439
Businesses Nearby
Explore this area
Business Placement
Demographics for 37411, TN
17,499
Population
8,807
Households
2
Avg Household Size
40
Median Age
29%
College-Educated
90%
High-School Grad
7.3 sq mi
ZIP Area
2,397
Density / Sq Mi
$50,180
Median Household Income
$34,045
Median Earnings
$1,031
Median Rent
$216,800
Median Home Value
Check the figures for this property
Cap Rate, Value Estimation, Potential NOI and more
View Realmo Analytics
Market
Vacancy Rate% for Office in South region

Questions? Ask Rey
Realmo’s AI knows this listing — price, zoning, demand, history. Ask anything.




Frequently Asked Questions
What type of property is this?
Mixed-use property - Multi-use property with office, retail, and restaurant spaces.
Where is this mixed-use property located?
The property is located at 3116 Brainerd Road Chattanooga, TN.
What is the asking price?
The asking price for this property is $1,300,000.
What are key features of this property?
This property features: Strong multi‑use investment opportunity with three distinct revenue streams (office, retail, restaurant/event space).; Strategic, flexible location with high visibility along Brainerd Road and quick access to I‑75, Highway 24, and downtown Chattanooga.; C‑2 zoning provides flexibility for a wide range of uses.



