Two-Story Office
For Sale
$1,249,000
311 S BREVARD AVENUE, Tampa, FL 33606
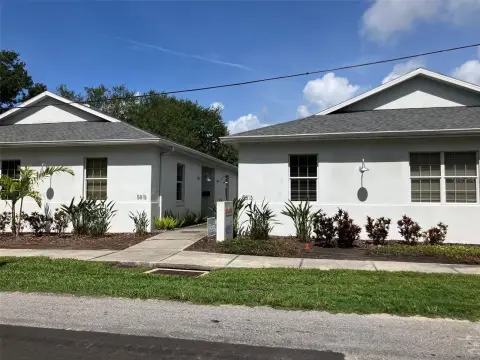
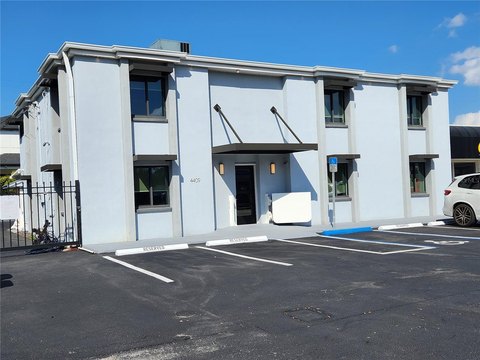
Two separate office suites are arranged across first and second floors with independent electrical meters and HVAC systems.
Property Size3,871 SF
Price / SF$322.66
Days on Market102
Property Features for 311 S BREVARD AVENUE
General Information
Standard status
Active
Size
3,871 SF
Total Parking Spaces
8
Property subtype
Office
Site & Location
Neighborhood
Hyde Park Spanishtown Creek Civic Association
Highway Access
Yes
Additional Details
Clear Height
11 ft
Office Units
2
Building Details
Year Built
1898
Stories
2
Tenancy
Multi
Listing Agency:
KELLER WILLIAMS TAMPA CENTRAL
(813) 865-0700
Listed By:
Harvey Petty · License #3223662
(813) 390-4038
Source:
Endlesssummerrealty
Added: Jul 15
Changed: Oct 23
Last Checked: Oct 23 at 9:44AM
Displayed information is deemed reliable but is not guaranteed and should be independently verified. All listing content including descriptions, pricing, images are the copyrighted material of KELLER WILLIAMS TAMPA CENTRAL

Ask AI about this property
Review the available facts, identify missing information and prepare questions for the agent.
Investment Insights
Based on property information with market context.
This two-story office building was moved to its current site approximately 28 years ago and installed with a new foundation and new water and sewer to the street at that time. The property is currently configured as two separate office spaces, with a first-floor and second-floor layout, each served by its own electrical meter and AC systems.
The first floor includes a front foyer waiting area, four large offices, a galley break area, an additional small office accessible from the break area or one of the offices, and a restroom. This level features 11-foot ceilings, solid oak floors, period moldings, and three decorative original fireplace mantles. A foyer staircase leads to the second level, which offers three large offices, a conference room that could also serve as a fourth office, a median office or waiting room, a restroom, and a galley breakroom. The second floor has 10-foot ceilings, plus a small staircase to air-conditioned storage in the third-floor attic (not included in the heated square footage).
An exterior door from the break area provides access to a rear exit staircase. Parking includes space for three cars in front and four to five spaces in the back, accessed via the Platt Street alley, along with street parking. The property is described as being close to Downtown, Water Street, Selmon Expy, and Bayshore Boulevard.
The first floor includes a front foyer waiting area, four large offices, a galley break area, an additional small office accessible from the break area or one of the offices, and a restroom. This level features 11-foot ceilings, solid oak floors, period moldings, and three decorative original fireplace mantles. A foyer staircase leads to the second level, which offers three large offices, a conference room that could also serve as a fourth office, a median office or waiting room, a restroom, and a galley breakroom. The second floor has 10-foot ceilings, plus a small staircase to air-conditioned storage in the third-floor attic (not included in the heated square footage).
An exterior door from the break area provides access to a rear exit staircase. Parking includes space for three cars in front and four to five spaces in the back, accessed via the Platt Street alley, along with street parking. The property is described as being close to Downtown, Water Street, Selmon Expy, and Bayshore Boulevard.
Key Highlights
- 1898 office building totaling 3,378 SF, configured as 2 separate office spaces on the first and second floors
- Each suite has its own electrical meter and AC systems for independent servicing
- First floor features a front foyer, 4 large offices, galley break area, small office, and restroom; 11‑ft ceilings and solid oak floors
Financial Insights
Estimated NOI and Cap Rate
NOI / Yr
$52,607
Cap Rate
4.21%
Suggested Prices Based on Cap Rates
Cap Rate 5%
$1,052,140
$1.1M
Cap Rate 7%
$751,529
$751.5K
Cap Rate 9%
$584,522
$584.5K
Market Conditions
NOI Build-Up for 3,871 SF
Gross rent
$92.9K $24.00/SF
− Vacancy
−$22.8K −$5.88/SF
EGI
$70.1K $18.12/SF
− OpEx
−$17.5K −$4.53/SF
NOI
$52.6K $13.59/SF
Area
Tampa, FL
Vacancy
24.50%
Lease Rate
$24.00 /SF/Yr
Expense Ratio
25.00%
Simulate Cap Rate and NOI
Suggested Prices Based on Cap Rates
Cap Rate 5%
$1,052,140
Cap Rate 7%
$751,529
Cap Rate 9%
$584,522
Alternative Uses
Best Use
Office B
$751.5K
$657.6K – $876.8K
NOI $52,607 @ 7.0% cap · market cap 4.21%
Second Best
—
—
no second resolved use
Theoretical Best
Office A
$901.8K
$789.1K – $1.05M
NOI $63,128 @ 7.0% cap · market cap 5.05%
Zoning and permitted uses should be independently verified with authorities.
How Realmo checks its estimates
Property Analytics
Unlock full access to Insights
Subscribe to Realmo Intelligence
Open Analytics
Current Use
Lease Details
11 ft
Clear height
2
Office units
Multi-tenant
Tenancy
Yes
Highway access
Location Intelligence
Trade Area within ½ mile
8,225
Businesses Nearby
Explore this area
Business Placement
Demographics for 33606, FL
22,271
Population
10,918
Households
2
Avg Household Size
30
Median Age
77%
College-Educated
98%
High-School Grad
3.3 sq mi
ZIP Area
6,749
Density / Sq Mi
$113,634
Median Household Income
$46,311
Median Earnings
$1,931
Median Rent
$796,000
Median Home Value
Check the figures for this property
Cap Rate, Value Estimation, Potential NOI and more
View Realmo Analytics
Market
Vacancy Rate% for Office in Tampa, FL






Frequently Asked Questions
What type of property is this?
Office building - Two separate office suites are arranged across first and second floors with independent electrical meters and HVAC systems.
Where is this office building located?
The property is located at 311 S BREVARD AVENUE Tampa, FL.
What is the asking price?
The asking price for this property is $1,249,000.
What are key features of this property?
This property features: 1898 office building totaling 3,378 SF, configured as 2 separate office spaces on the first and second floors; Each suite has its own electrical meter and AC systems for independent servicing; First floor features a front foyer, 4 large offices, galley break area, small office, and restroom; 11‑ft ceilings and solid oak floors