General Commercial

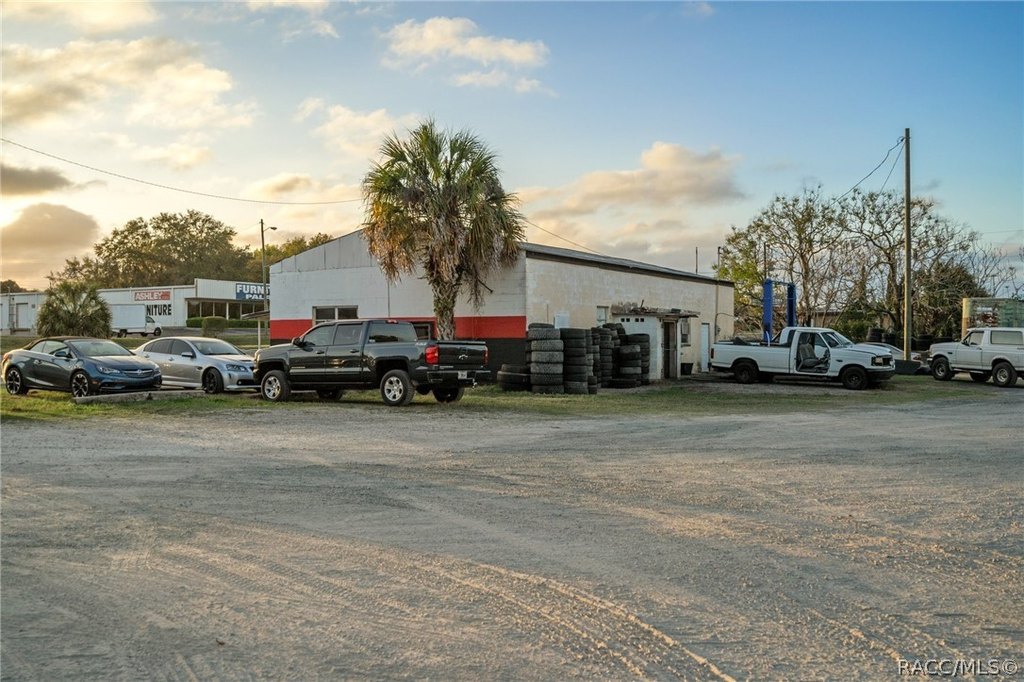
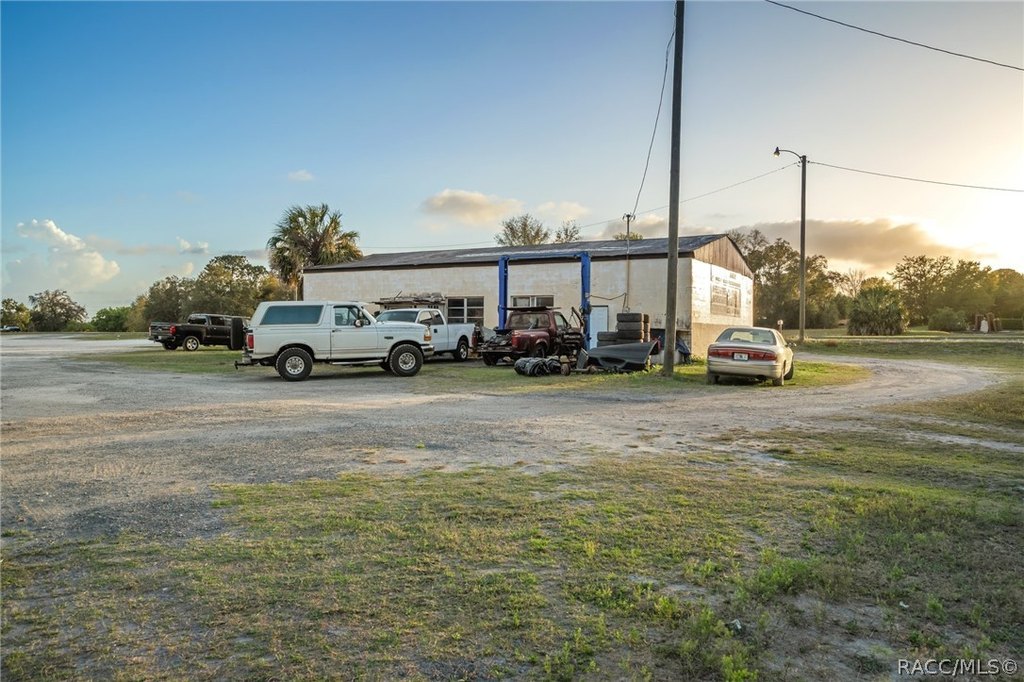
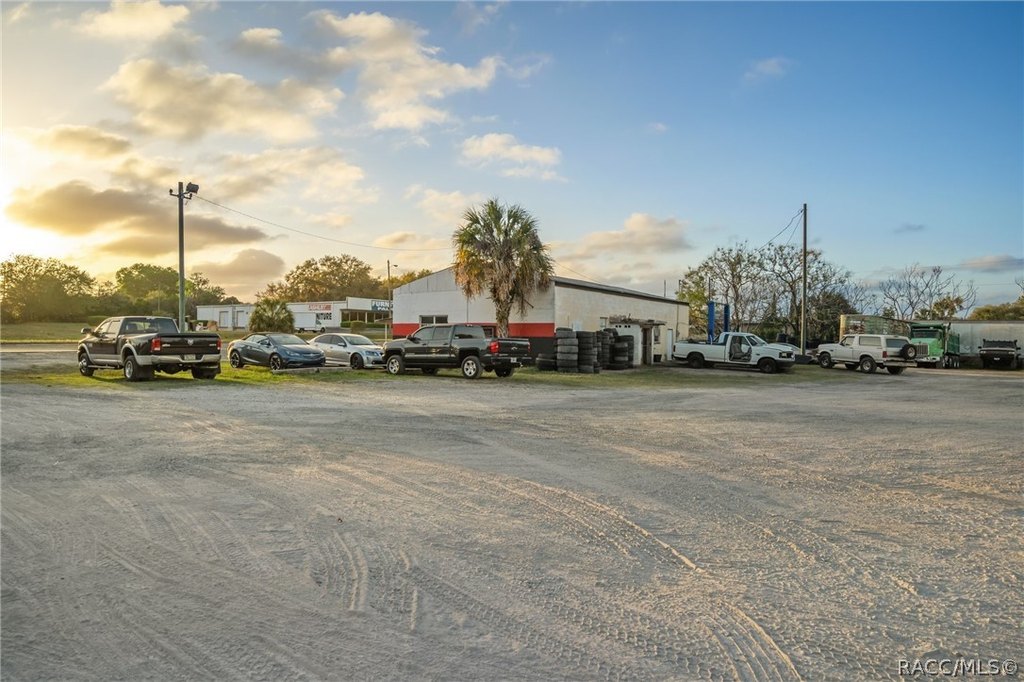
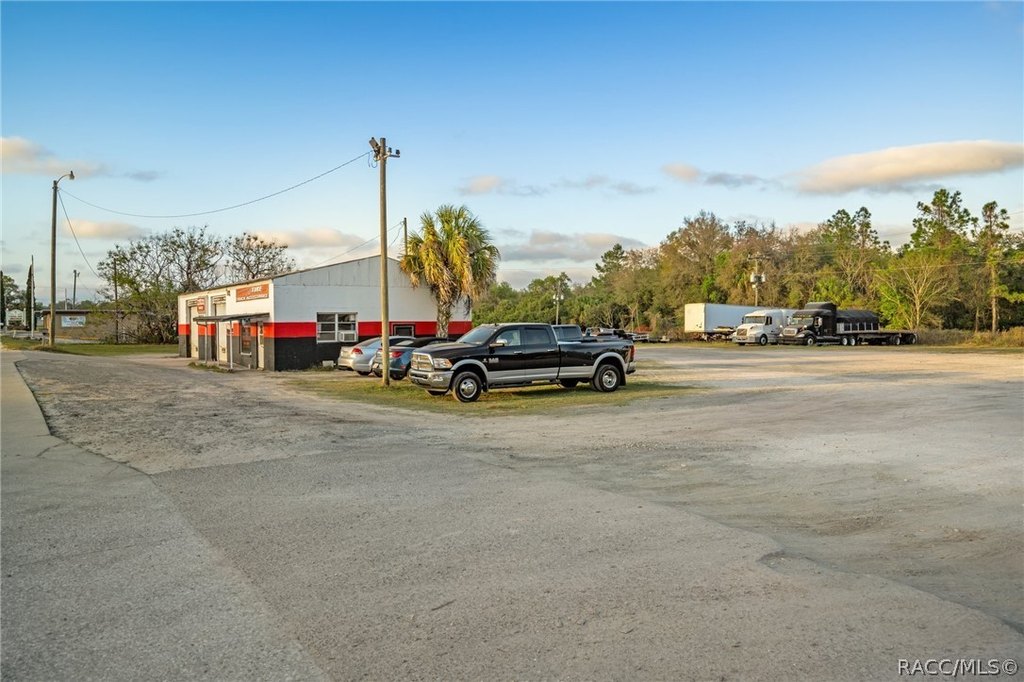
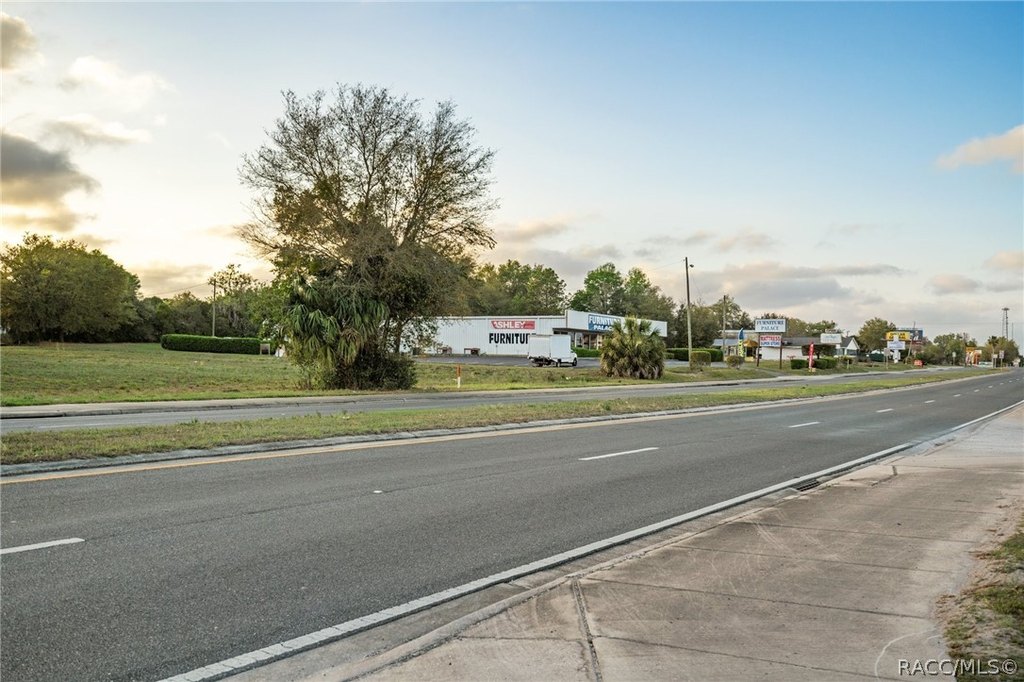
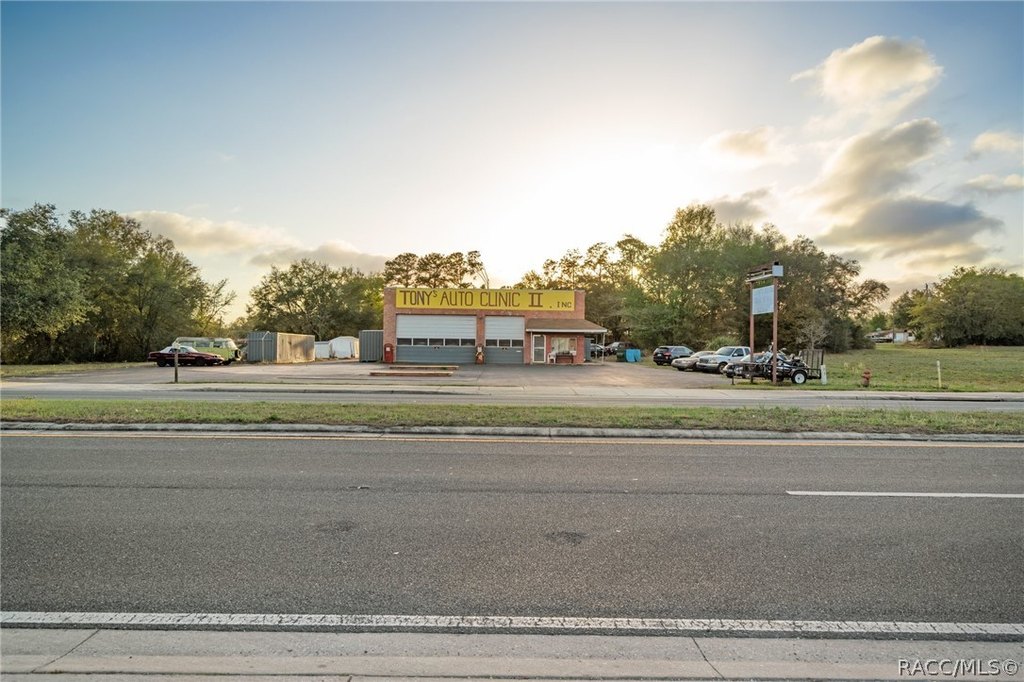


For Sale
$649,500
3109 S Florida Avenue, Inverness, FL 34450
CommercialSale, Inverness, FL
Property SizeContact for details
Lot Size1.85 Acres
Days on Market1656
Property Features for 3109 S Florida Avenue
General Information
Property type
Commercial Sale
Property subtype
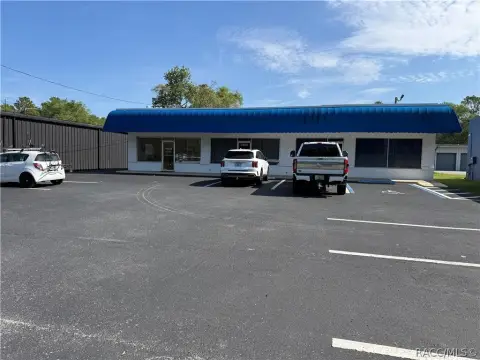
Retail
Zoning
GNC
Subdivision
Not on List
Lot features
Acreage
Directions
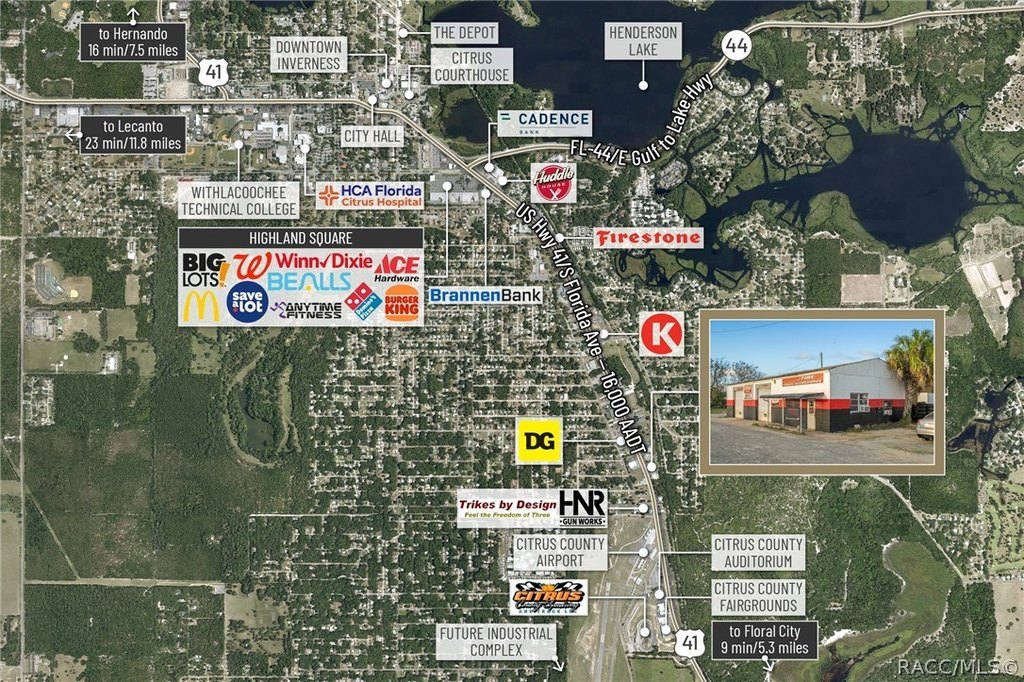
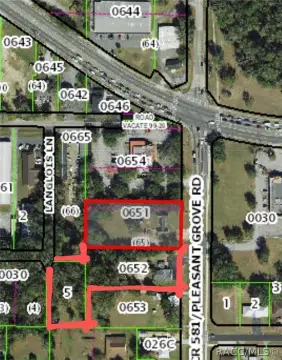
Located on S Florida Avenue north east of the Inverness Airport.
Standard status
Active
APN
2801492
Lot size
1.85 Acres
Taxes and HOA fees
Tax Year
2021
Tax Description
(LR96-07 OR BK 1122 PG 2025-2028) PCL A: TRACT OF LAND IN SE1/4 OF SW1/4 OF 21-19-20 DESC AS: COM AT SE COR OF SW1/4 OFSW1/4, TH N 657 FT, TH E 286.9
Tax Annual Amount
2585
Legal Description
(LR96-07 OR BK 1122 PG 2025-2028) PCL A: TRACT OF LAND IN SE1/4 OF SW1/4 OF 21-19-20 DESC AS: COM AT SE COR OF SW1/4 OFSW1/4, TH N 657 FT, TH E 286.9
Utilities
Sewer type
Septic Tank
Cooling system
Central Air
Water source
Public
Building Details
Year built
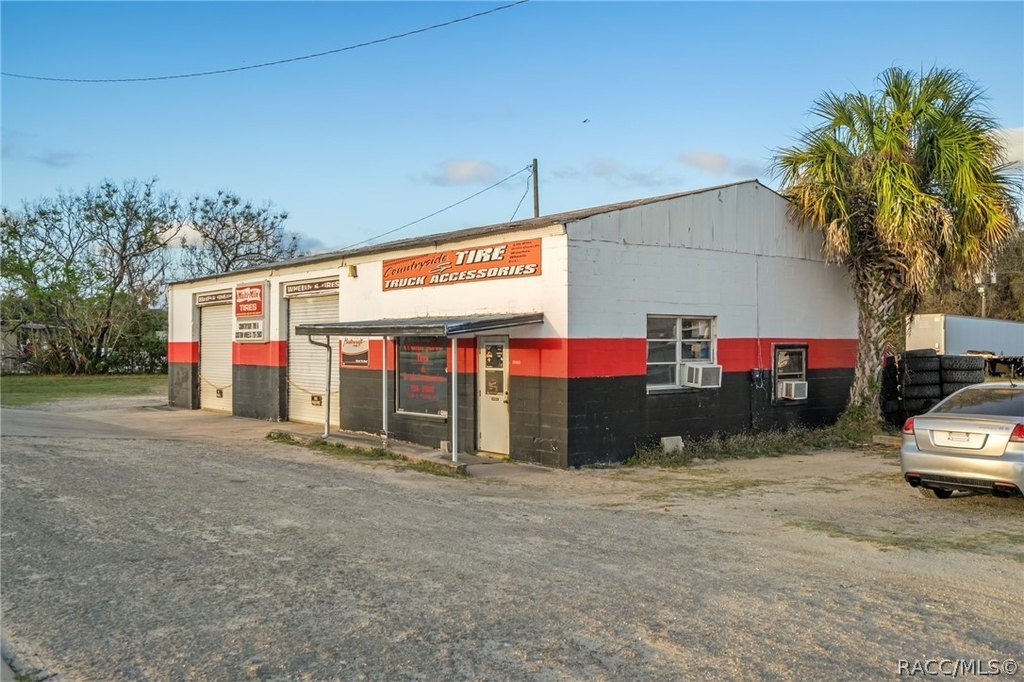
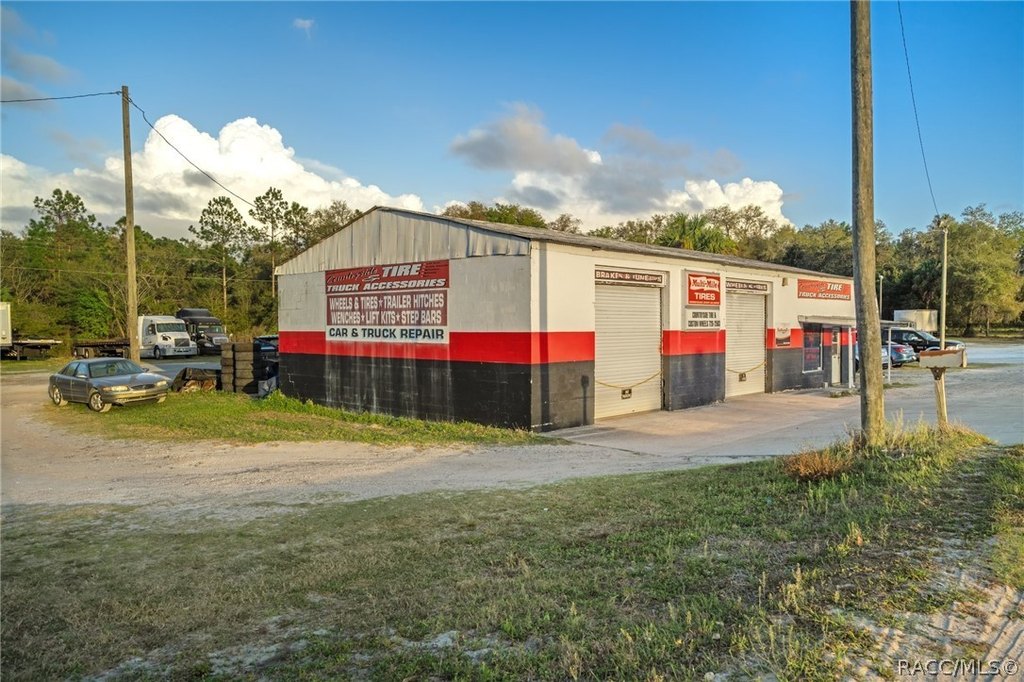
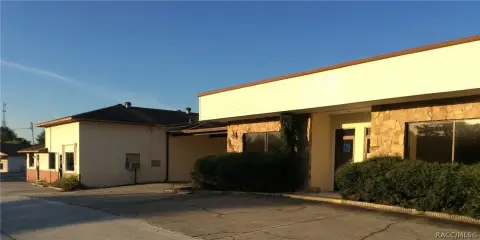
1970
Floors in Building
1
Flooring type
Concrete
Building materials
Block, Concrete
Roof type
Shingle, Asphalt
Listing Agency:
Century 21 J.W.Morton R.E. · Century 21 Real Estate
(352) 726-6668
Listed By:
Luke K Whitehurst · License #3273034
(352) 476-5578
Added: Mar 10, 2022
Changed: Sep 19
Last Checked: Sep 21 at 5:06AM
MLS# 810809
Copyright © 2026 REALTORS Association of Citrus County, Inc. All rights reserved. All information provided by the listing agent/broker is deemed reliable but is not guaranteed and should be independently verified.
Investment Insights
Based on property information with market context.
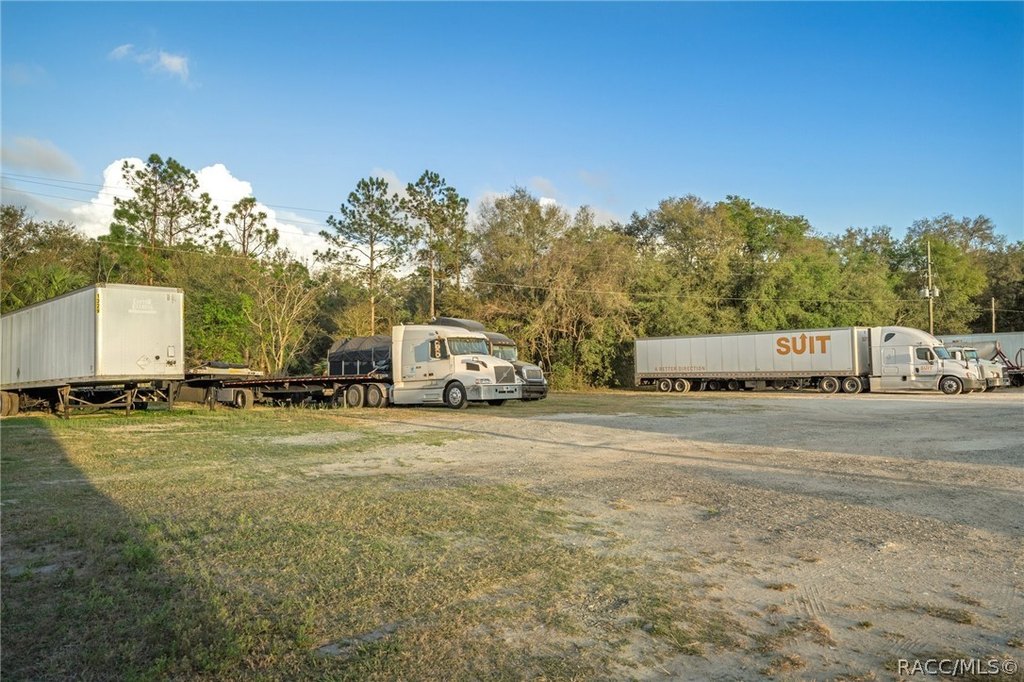
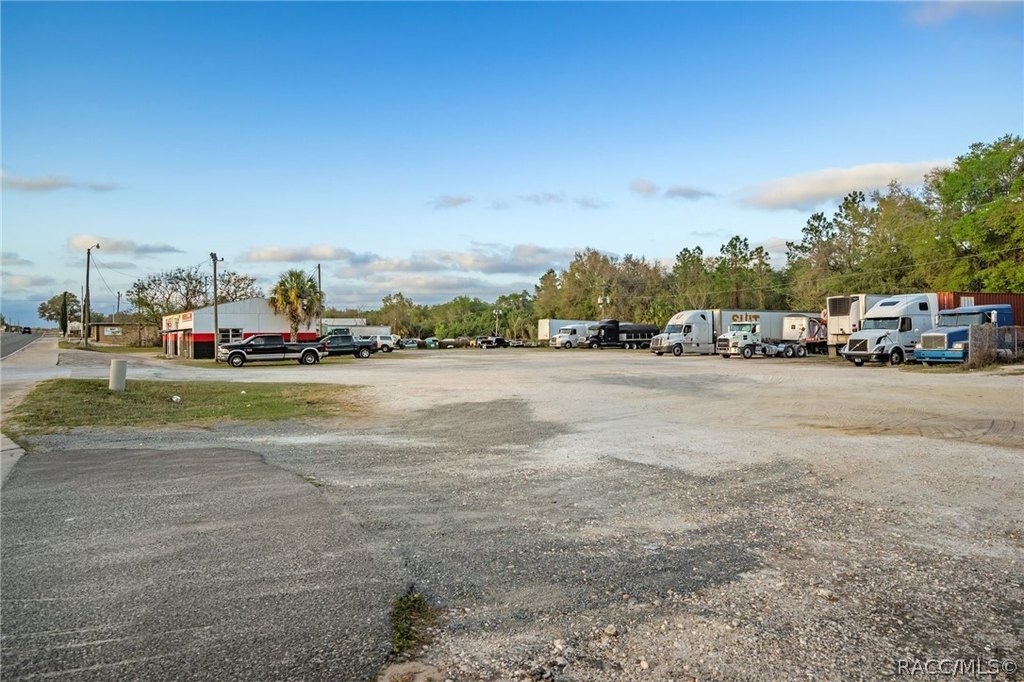
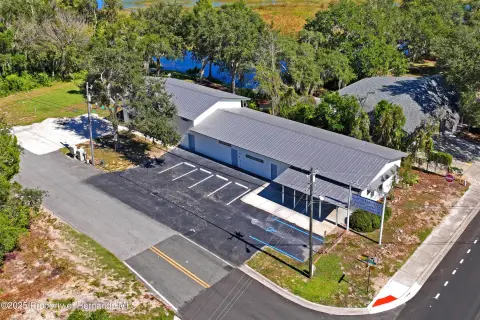
This 1.85-acre commercial parcel carries GNC zoning and fronts S Florida Avenue, also identified as Hwy 41 S. The zoning supports a range of listed uses, including retail and general commercial, professional or medical offices, gas stations and convenience stores, restaurants, and bars.
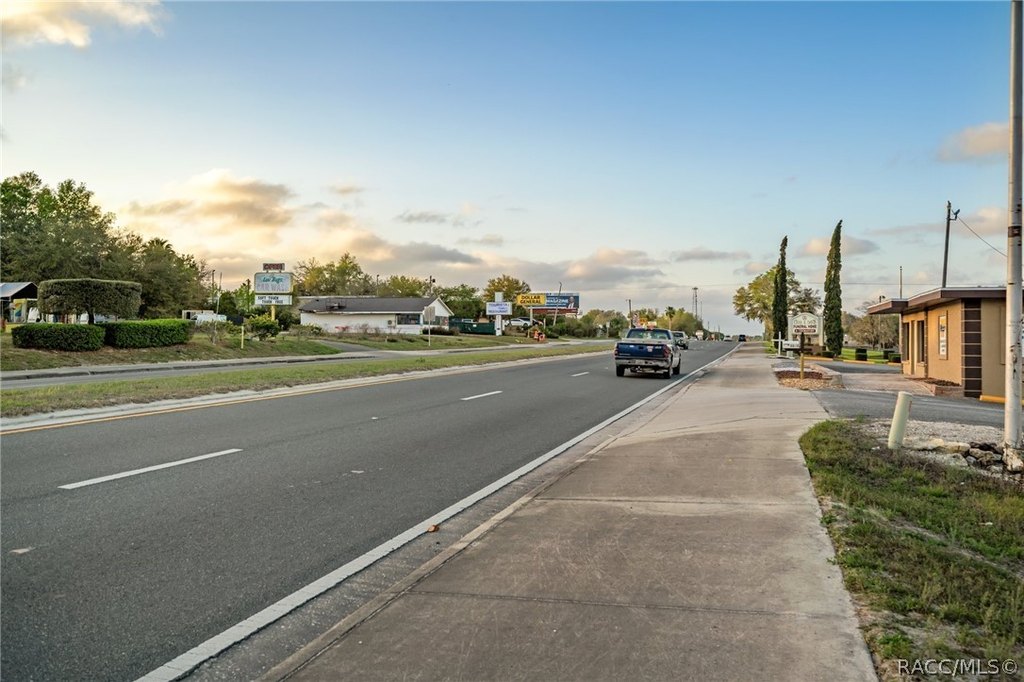
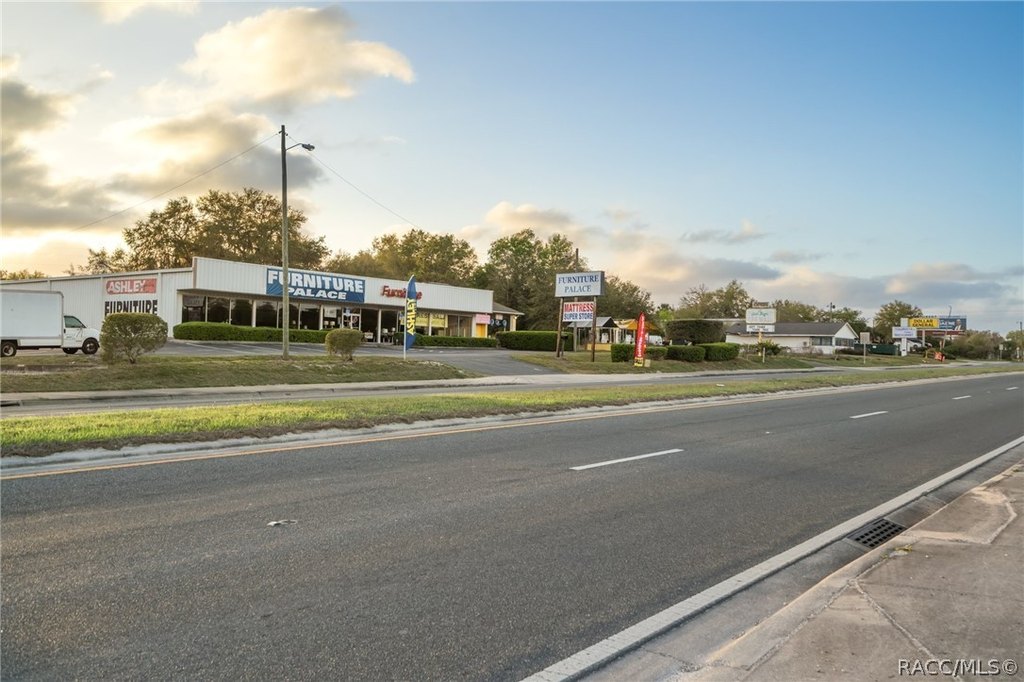
The property is located just outside Inverness city limits in unincorporated Citrus County, with proximity to Historic Downtown Inverness. Rails to Trails borders the east side of the property and extends more than 46 miles. The site is within a 15-minute drive of a stated population base of 46,361 residents, with an average age of 58. Public water and a septic tank are identified for the property.
The property is located just outside Inverness city limits in unincorporated Citrus County, with proximity to Historic Downtown Inverness. Rails to Trails borders the east side of the property and extends more than 46 miles. The site is within a 15-minute drive of a stated population base of 46,361 residents, with an average age of 58. Public water and a septic tank are identified for the property.
Key Highlights
- 1.85‑acre commercial parcel
- GNC zoning with retail, office, restaurant, gas station, and other listed use options
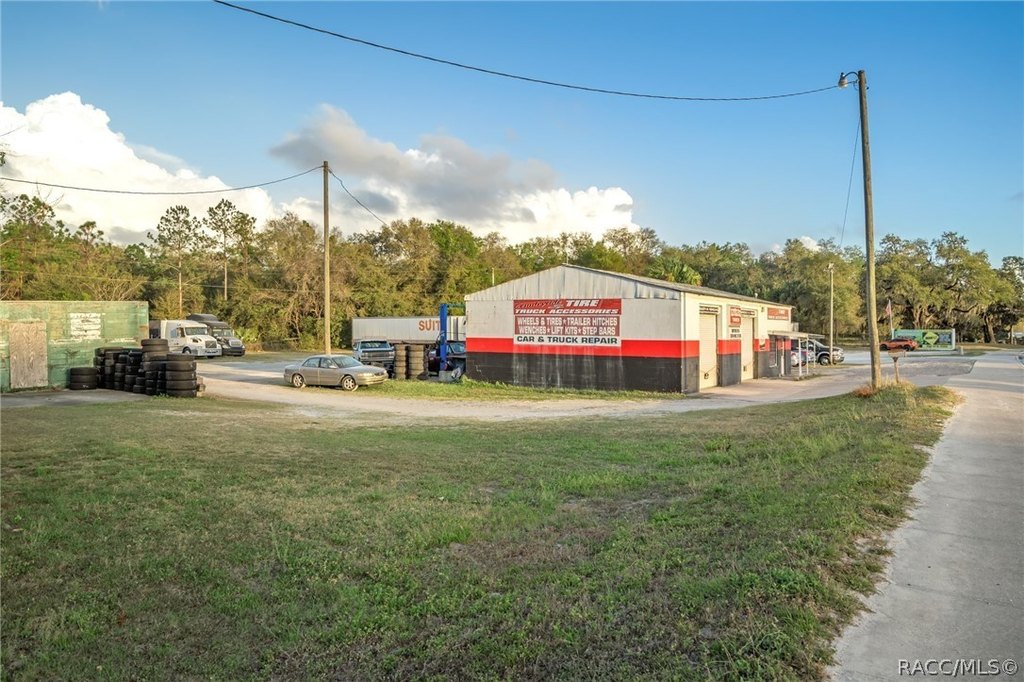
- Over 383' of frontage on S Florida Avenue/Hwy 41 S
Property Analytics
Unlock full access to Insights
Subscribe to Realmo Intelligence
Open Analytics
Current Use
Lease Details
11,200 VPD
Traffic count
Location Intelligence
Trade Area within ½ mile
167
Businesses Nearby
Explore this area
Business Placement
Demographics for 34450, FL
10,788
Population
6,642
Households
1.6
Avg Household Size
59
Median Age
25%
College-Educated
92%
High-School Grad
31.2 sq mi
ZIP Area
346
Density / Sq Mi
$48,955
Median Household Income
$39,409
Median Earnings
$973
Median Rent
$210,200
Median Home Value
Check the figures for this property
Cap Rate, Value Estimation, Potential NOI and more
View Realmo Analytics
Market
Vacancy Rate% for Retail in South region

Questions? Ask Rey
Realmo’s AI knows this listing — price, zoning, demand, history. Ask anything.






Frequently Asked Questions
What type of property is this?
Commercial land - GNC-zoned commercial land with public water, septic service, and frontage along S Florida Avenue/Hwy 41 S.
Where is this commercial land located?
The property is located at 3109 S Florida Avenue Inverness, FL.
What is the asking price?
The asking price for this property is $649,500.
What are key features of this property?
This property features: 1.85‑acre commercial parcel; GNC zoning with retail, office, restaurant, gas station, and other listed use options; Over 383' of frontage on S Florida Avenue/Hwy 41 S


