Mixed-Use Buildings with
For Sale
$799,000
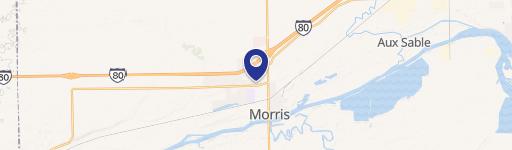
310 /312 Liberty St, Morris, IL 60450
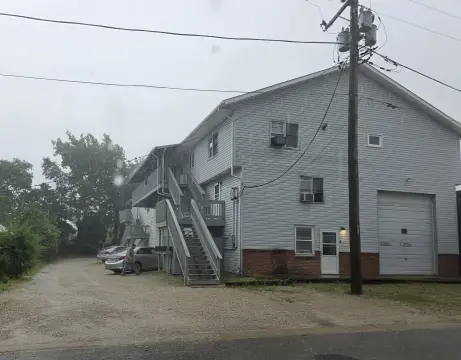
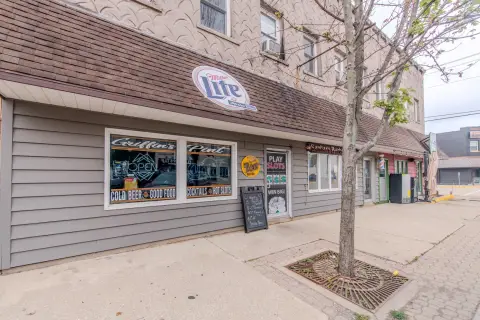
Two recently rehabilitated buildings offer retail, food-service, kitchen, rental, and party-room spaces.
Property Size8,700 SF
Price / SF$91.84
Days on Market55
Property Features for 310 /312 Liberty St
General Information
Standard status
Active
Size
8,700 SF
Amenities
elevator access between floors
stone fireplace
brick walls
corrugated steel and chain link fencing design
walk-in coolers, freezers and dry storage
Building Details
Year Built
1915
Buildings
2
Tenancy
Multi
Listing Agency:
Advantage Realty, Inc.
Listed By:
Stephen Barr · License #475098445
(815) 671-6701
Source:
Realtopiare
Added: Aug 20
Changed: Oct 12
Last Checked: Oct 7 at 2:42PM
Displayed information is deemed reliable but is not guaranteed and should be independently verified. All listing content including descriptions, pricing, images are the copyrighted material of Advantage Realty, Inc.
Investment Insights
Based on property information with market context.
This mixed-use property comprises two recently rehabilitated downtown buildings totaling 8,700 square feet. Constructed in 1915, the buildings include retail frontage, multiple rental areas, food-service spaces, and kitchens with equipment included. The 310 building offers main-floor retail, a rear kitchen rental, and two second-floor rental spaces, including one with separate exterior access. The 312 building contains bar and dining areas on both floors, restrooms on each level, a second-floor party room, and a separate first-floor kitchen rental. A finished basement provides walk-in coolers, freezers, dry storage, and additional preparation space.
Distinctive interior details include a stone fireplace, exposed brick, corrugated steel, and chain-link design elements. Elevator service connects the floors, and both buildings have exterior-access points. The property is located on Liberty Street in downtown Morris and is currently held under one PIN, with potential separation after purchase. The operating business is excluded from the sale.
Distinctive interior details include a stone fireplace, exposed brick, corrugated steel, and chain-link design elements. Elevator service connects the floors, and both buildings have exterior-access points. The property is located on Liberty Street in downtown Morris and is currently held under one PIN, with potential separation after purchase. The operating business is excluded from the sale.
Key Highlights
- Two‑building mixed‑use property totaling 8,700 SF
- Recently rehabilitated buildings constructed in 1915
- Elevator access between building floors
Financial Insights
Estimated NOI and Cap Rate
NOI / Yr
$37,451
Cap Rate
4.69%
Suggested Prices Based on Cap Rates
Cap Rate 5%
$749,020
$749.0K
Cap Rate 7%
$535,014
$535.0K
Cap Rate 9%
$416,122
$416.1K
Market Conditions
NOI Build-Up for 8,700 SF
Gross rent
$56.4K $6.48/SF
− Vacancy
−$2.9K −$0.33/SF
EGI
$53.5K $6.15/SF
− OpEx
−$16.1K −$1.84/SF
NOI
$37.5K $4.30/SF
Area
Grundy County, IL
Vacancy
5.10%
Lease Rate
$6.48 /SF/Yr
Expense Ratio
30.00%
Simulate Cap Rate and NOI
Suggested Prices Based on Cap Rates
Cap Rate 5%
$749,020
Cap Rate 7%
$535,014
Cap Rate 9%
$416,122
Alternative Uses
Best Use
Mixed Use
$2.10M
$1.84M – $2.45M
NOI $146,813 @ 7.0% cap · market cap 18.37%
Second Best
Specialty Retail
$2.08M
$1.82M – $2.43M
NOI $145,638 @ 7.0% cap · market cap 18.23%
Theoretical Best
Office A
$3.00M
$2.63M – $3.50M
NOI $210,260 @ 7.0% cap · market cap 26.32%
Zoning and permitted uses should be independently verified with authorities.
How Realmo checks its estimates
Property Analytics
Unlock full access to Insights
Subscribe to Realmo Intelligence
Open Analytics
Current Use
Lease Details
Multi-tenant
Tenancy
Location Intelligence
Trade Area within ½ mile
637
Businesses Nearby
4k
Monthly Visits Nearby
Explore this area
Business Placement
Foot Traffic Nearby
Shops & Services 68%
Dining 32%
Old National Bank
Shops & Services
2,675 visits/mo
0.1 miles
Aurelio's Pizza
Dining
1,450 visits/mo
0.3 miles
Napa Auto Parts
Shops & Services
352 visits/mo
0.1 miles
Demographics for 60450, IL
20,877
Population
9,306
Households
2.2
Avg Household Size
42
Median Age
25%
College-Educated
94%
High-School Grad
157.6 sq mi
ZIP Area
132
Density / Sq Mi
$81,716
Median Household Income
$45,813
Median Earnings
$1,122
Median Rent
$266,600
Median Home Value
Check the figures for this property
Cap Rate, Value Estimation, Potential NOI and more
View Realmo Analytics
Market
Vacancy Rate% for Retail in Midwest region

Questions? Ask Rey
Realmo’s AI knows this listing — price, zoning, demand, history. Ask anything.




Frequently Asked Questions
What type of property is this?
Mixed-use property - Two recently rehabilitated buildings offer retail, food-service, kitchen, rental, and party-room spaces.
Where is this mixed-use property located?
The property is located at 310 /312 Liberty St Morris, IL.
What is the asking price?
The asking price for this property is $799,000.
What are key features of this property?
This property features: Two‑building mixed‑use property totaling 8,700 SF; Recently rehabilitated buildings constructed in 1915; Elevator access between building floors


